Correlations among macular pigment optical density, central macular thickness and body mass index
2019-05-20 01:24LeeHongNienFazlianaIsmailRafidahSudarnoAngelaLooVoonPei2VisvarajaSubrayan
国际眼科杂志 2019年5期
Lee Hong Nien, Fazliana Ismail, Rafidah Sudarno, Angela Loo Voon Pei2, Visvaraja Subrayan
(作者单位:159100马来西亚吉隆坡,马来西亚大学医疗中心眼科;243000马来西亚吉隆坡蕉赖,Tunku Abdul Rahman大学医学部)
Abstract
INTRODUCTION
Lutein and zeaxanthin are pigments that are classified as xanthophyll carotenoids[1-2], which can be found in the human blood and body tissues, especially in the macula. Lutein, Zeaxanthin and Mesozeaxanthin constitute to the macular pigments[3]. Macula pigment is measured in optical density unit (d.u.) and termed as macula pigment optical density (MPOD). The concentration of macula pigments is highest at the fovea and reduces exponentially towards periphery. Several studies on the correlation between macula pigment and central macular thickness have been published. Veenetal[4]found a significant correlation between MPOD and central retinal thickness, whereas Nolanetal[5]found no such correlation.
The purpose of our study is to investigate the correlation between MPOD and central macular thickness in the healthy Malaysian individuals, aged 30-50 years old. Our study is the first study on the Malaysian population. The outcome of this study will contribute to the pool of the current scientific knowledge and may strengthen the outcome of the previous studies.
SUBJECTS AND METHODS
The study is adhered to the Declaration of Helsinki and Good Clinical Practice guidelines. Institutional Review Board approval was obtained from the Medical Ethics Board of the University Malaya Medical Centre (UMMC). It is a comparative cross-sectional study, conducted from December 2014 to July 2015. The subjects included were aged 30-50 years old, fit and healthy with visual acuity of LogMar 0.0-0.30, equivalent to 6/6-6/12 on Snellen (aided and unaided). Exclusion criteria are those taking lipid lowering medication, with systemic and ocular diseases that may affect the study result (Ocular: glaucoma, age-retinal pigment epitheliitis, cataract, retinal diseases; Systemic: diabetes, any illness that has effect on retina), and taking supplement or diet which contain high level of lutein and zeaxanthin.
Informed consent was obtained, and a full systemic and ocular history were taken. The visual acuity was checked with the LogMar visual acuity chart. A thorough ocular examination was carried out. The date of birth, weight and height were also recorded. MPOD measurement was done using MPS II, followed by central macular thickness measurement using SD Cirrus OCT.
MeasurementofMacularPigmentThe measurement of macula pigments is termed as macula pigment optical density (MPOD). It is a measurement of blue light attenuation by macula pigment and is measured in DU. It has a range of 0 to 1. The technique used for macula pigments is Heterochromatic Flicker Photometry (HFP). It is minimally invasive, does not require dilatation of pupil, and uses low light level[6-7]. The method is based on the property of the macula pigments that absorbed a spectrum of blue to green wavelength (460 nm to 570 nm). The MPOD is determined by a test stimuli that alternates between a wavelength absorbed by the macular pigments at the fovea and eccentric fovea, and at the same time, the radiance of the blue light is adjusted by the subject until the perception of flicker is minimized or eliminated. It is base on the assumption that macula pigment is maximum at the fovea, and reduces exponentially towards eccentricity, with minimal or absent of the pigments at 6-8 degree of eccentricity. The Log ratio of the radiance of blue light needed at the fovea (Bf) compared to that at the parafovea (Bp) gives the measurement of MPOD [MPOD=Log 10 (Bf/Bp)].
In the MPS II, the subject responds when they first see a flicker[8-9]. The flicker sensitivity of each subject is determined by a pre-set test which takes only few seconds. The blue-green alternation flicker is then initiated and decreased in 6 Hz steps from 60 Hz, which is above the critical flicker fusion frequency. At the initial part of the test, the subject will not notice any flickers. The sequence of the different blue-green ratios are continued until a blue curve is seen, follows by the peripheral test. The minimum point of each curve is taken for calculation of MPOD using the same formula mentioned earlier. The minimum point at the curve indicates the moment where blue and green light achieve an iso-luminance.
MeasurementofCentralMacularThicknessCentral macular thickness (CMT) is measured using OCT (SD Cirrus OCT Model 4000 from Carl Zeiss Meditec)[10]. The measurement of macular cube 512×128 scan was selected, to capture the central 6×6 mm central macula. Six radial scans (6 mm long) which centred on the fixation point were performed on each eye. This scan takes 2.4s to complete for each eye. The retinal thickness is calculated, which is the distance between the internal limiting membrane (ILM) and the retinal pigment epithelium (RPE). The Early Treatment Diabetic Retinopathy Study (EDTRS) grid is centred at the fovea automatically by a fovea finder. This grid consists of one innermost circle which corresponds to the central area of 500 μm radius, follows by a consecutive inner and outer ring measuring 1500 μm and 3000 μm radius respectively. The average thickness of each designated section of the central macula is documented in the grid in micrometre. The volume cube (total volume cube of 6×6 mm diameter) and thickness-average cube (overall average thickness of the entire 6×6 mm diameter) are also measured.
StatisticalAnalysisMicrosoft© Excel [Version 15.12.3 (150724) ℃2015 Microsoft], SPSS (IBM© SPSS© Statistics Version 2.2), and R (version 3.2.1; R Core Team 2015) were used for data processing and statistical analysis. Pearson correlation coefficient analysis was done to study the inter-ocular correlation for MPOD and CMT, and to study the correlation between MPOD, CMT, and body mass index (BMI). Two-samplet-test was used to compare the mean MPOD between male and female. Multiple linear regression analysis for MPOD against CMT and BMI was done to obtain regression coefficient models.
RESULTS
A total of 210 volunteers are recruited for this study (174 females, 36 males). The mean MPOD values were similar for both eyes (RE: mean 0.47, SD 0.16, range: 0.02-0.84, LE: mean 0.48, SD: 0.17, range: 0.05-0.94), and the inter-ocular correlation coefficient between subjects’ fellow eyes was 0.68 (P<0.01). The mean central subfield thickness, which is the central 1000 μm diameter area of both eyes, were similar and showed high inter-ocular correlation withrvalue of 0.90 (P<0.01) (RE: mean 241 μm, SD: 19.79, range: 191-316; LE: mean 241, SD: 19.85, range: 178-319). Left eye values were used for all statistical analysis in our study. The MPOD and CMT showed normal distribution patterns (skew test -0.17 and 0.38 respectively). No significant difference in mean MPOD between male and female (0.53 and 0.46,P=0.08).

Table 1 Summary of the statistics for the subjects(n=210)
SD:Standard deviation; BMI: Body mass index.
CorrelationBetweenMPODandCentralMacularThicknessThere was a significant positive correlation between MPOD and CMT (central 1000 μm diameter). Pearson correlation coefficient analysis showedrvalue of 0.42 (P<0.01). Regression coefficient between MPOD and CMT was statistically significant (P<0.01; 198 degrees of freedom,r2=0.18). The regression is given by the equation MPOD= -0.4623-0.0039 CMT. Figure 1 showed the scatter plot and the regression line for MPOD and CMT.
CorrelationBetweenMPODandBMIThere was a significant inverse correlation between MPOD and BMI (Pearson correlation,r=-0.23,P=0.001). Regression coefficient between MPOD and BMI was statistically significant (P<0.001; 201 degrees of freedom,r2=0.05). The regression is given by the equation MPOD=0.6995 -0.008 BMI. A further analysis into men and women groups showed a similar finding. There was a significant inverse correlation between MPOD and BMI, in men,r= -0.2294,P=0.003, and in women,r= -0.3447,P=0.0367.
MultiplelinearRegressionMultiple linear regression showed that CMT and BMI jointly explained about 25% variation in MPOD. The final regression model is given by the equation MPOD= -0.2705-0.0095 BMI+0.0041 CMT. Table 2 gives the predicted mean MPOD values for particular combinations of BMI and CMT.
DISCUSSION
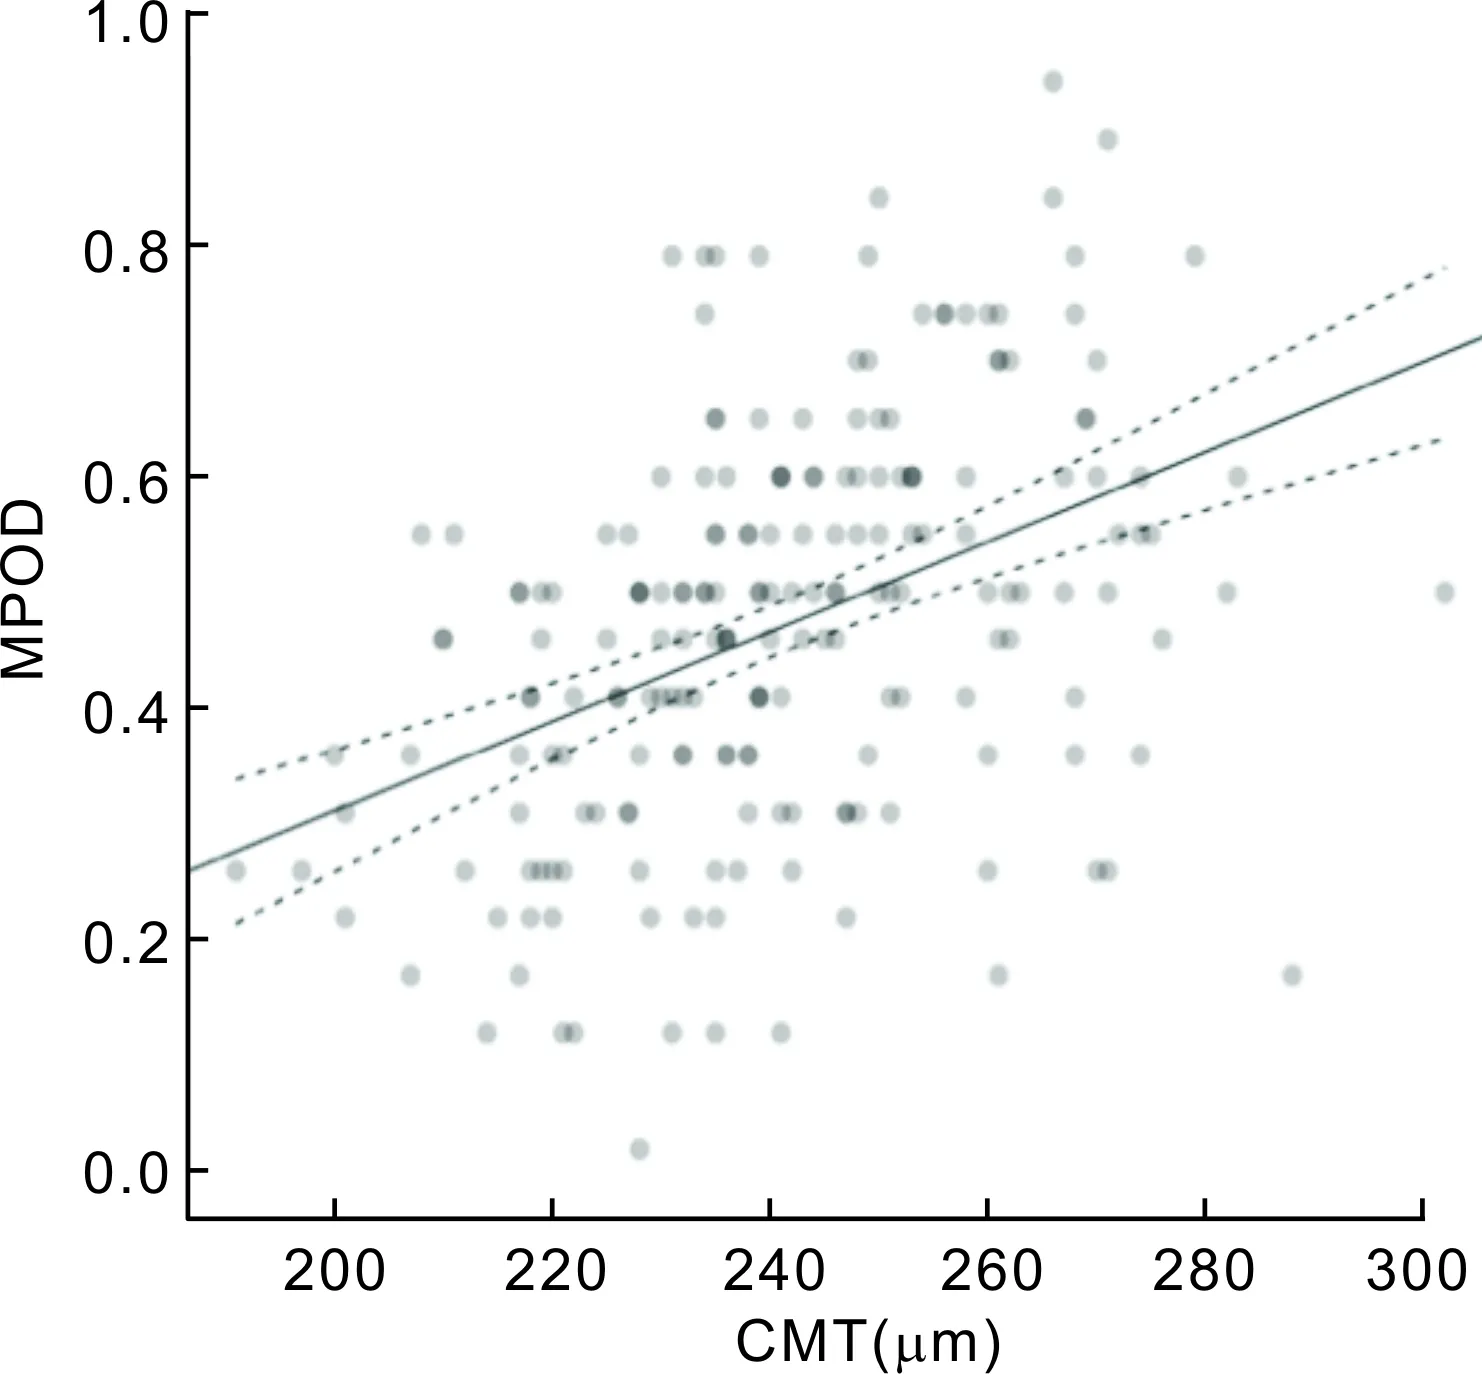
Our analysis showed a significant positive correlation of MPOD and central subfield thickness, volume cube and thickness area cube. Therefore, it can be suggested that MPOD is strongly correlated with macula thickness, up to 3 mm radius from central fovea, or 6 mm diameter of posterior pole. Our study agrees with the previous one done by Veenetal[4]. Liewetaldid a study on 300 female patients, aged less than 50 years old in the UK. They used two different methods to measure MPOD, HFP (using maculometer) and autoflourescence (scanning laser ophthalmoscope). Both methods yielded a significant correlation between MPOD and central retinal thickness (average thickness of 1 mm central diameter of fovea). Veenetal[4]did a study on 40 Netherlands patients (age 18-58, 87.5% female). The MPOD was measured using Macula Pigment Screener, which was similar to our study. They found a significant positiveFigure1ScatterplotofMPODagainstCMT,withfittedregressionline(solid)andcorrespondingupperandlowerlimitsofthe95%confidenceintervalofMPOD(dashedlines).
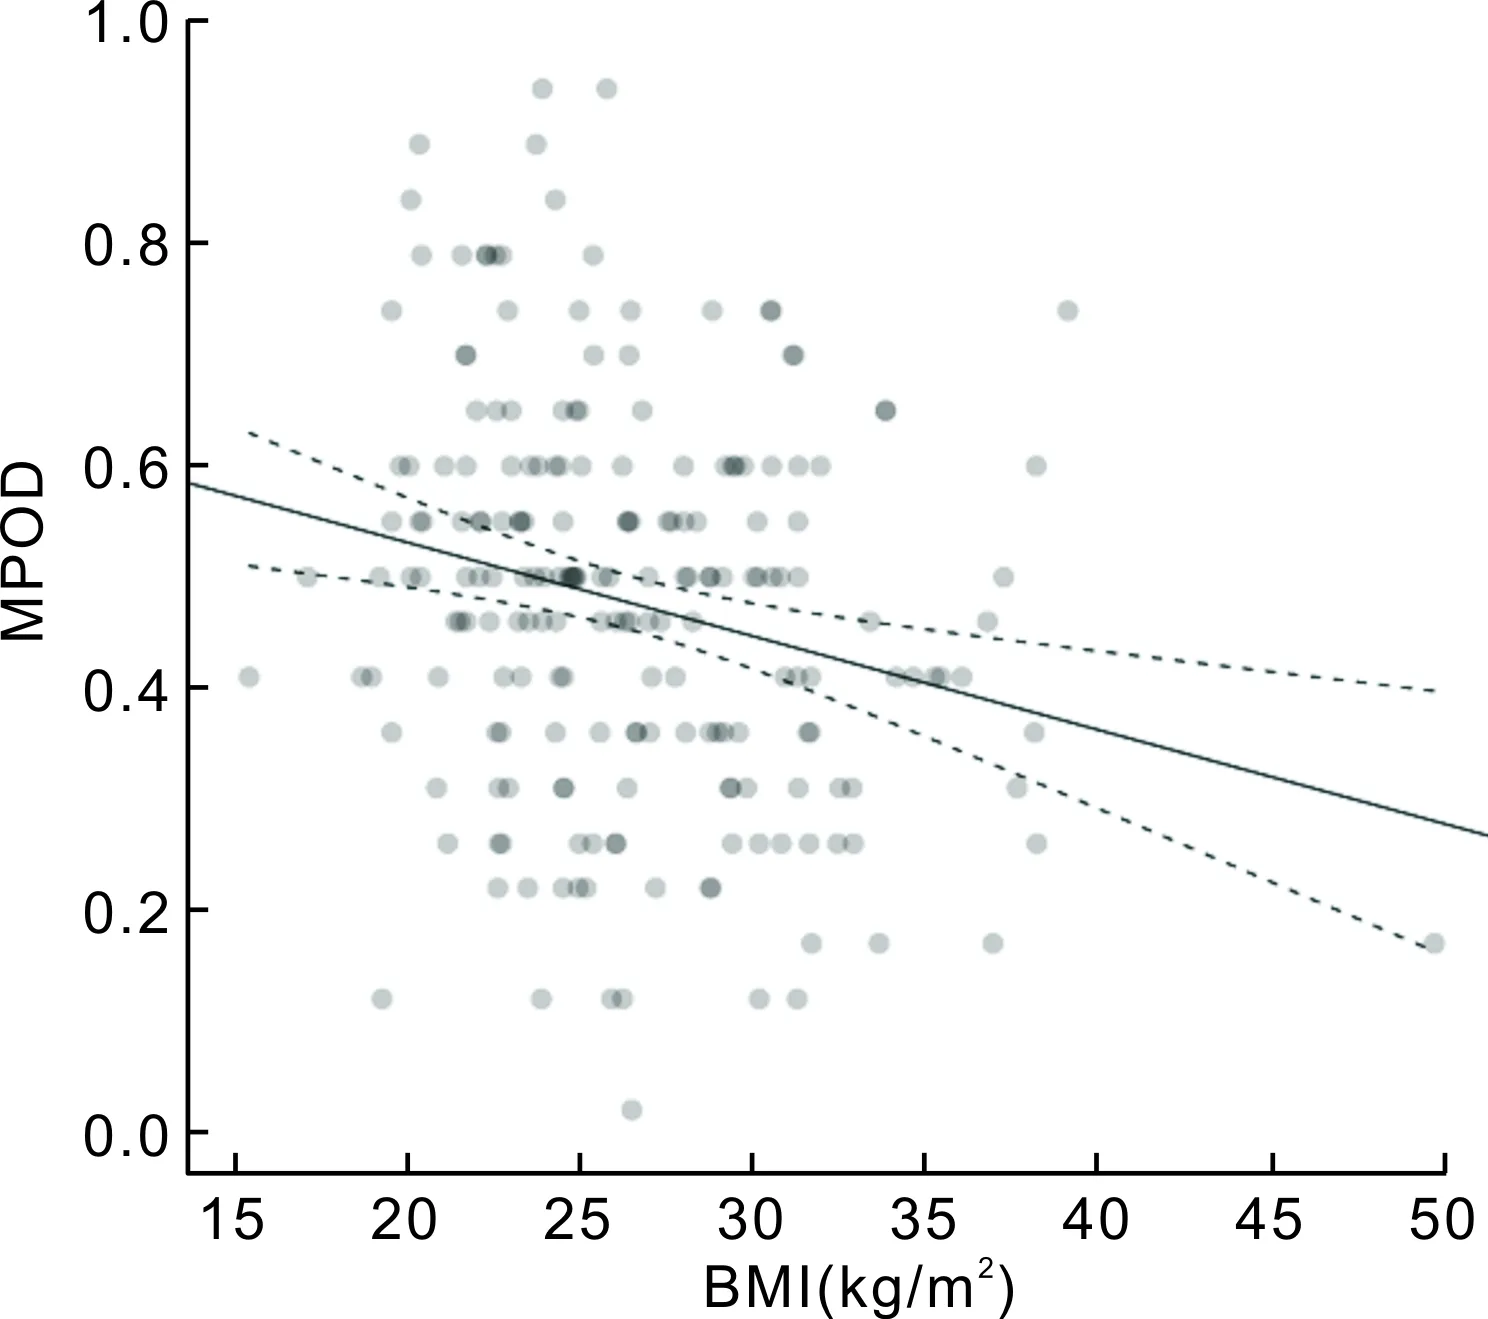
Figure 2 Scatter plot of MPOD against BMI, with fitted regression line (solid) and corresponding upper and lower limits of the 95% confidence interval of MPOD (dashed lines).
correlation between MPOD and central foveal thickness. The central foveal thickness is defined as the average retinal thickness at the intersection point of six radial scans. However, they found no correlation between MPOD and central retinal thickness (1 mm diameter of fovea).
Nolanetal[5]did a similar study in Georgia, US on 59 patients (age range 18-60, 59.3% female), and found a significant correlation between MPOD and MFT (minimal foveal thickness-the average retinal thickness at point intersection point of six radial scans), only in their non-white population (n=18, 31%) which consisted of 5 Indians, 6 Asians, 3 Hispanics and 4 Blacks. No correlation was found between MPOD and CFT (central foveal thickness, 1 mm diameter) or MFT when the whole population, including the white population, was taken into account. In their study, macula densitometer (customized HFP) was used. This technique yielded higher MPOD values compared to MPS. Their study also did not find a similar correlation to ours. The differences can be explained by two factors: the distribution of macula pigments and the size of study population. It is known that the peak distribution of macula pigment is at the centremost of the fovea and decrease exponentially to undetectable levels at 6 to 8° eccentricity[1,3-4]. Note that in Veenetal[4]and Nolanetal[5]studies, the sample sizes were small. They could only find a significant correlation between MPOD and central foveal thickness at the centremost point of the fovea, where the 6 radial scans intersect with each other and not at the central 1 mm of foveal thickness. Zhengetal[11]found that MPOD in examined Chinese school age children, showed no significant association with the minimum and central foveal thickness. A similar finding was found by Abelletal[12], in which no significant correlation between macular OCT profile and MPOD.
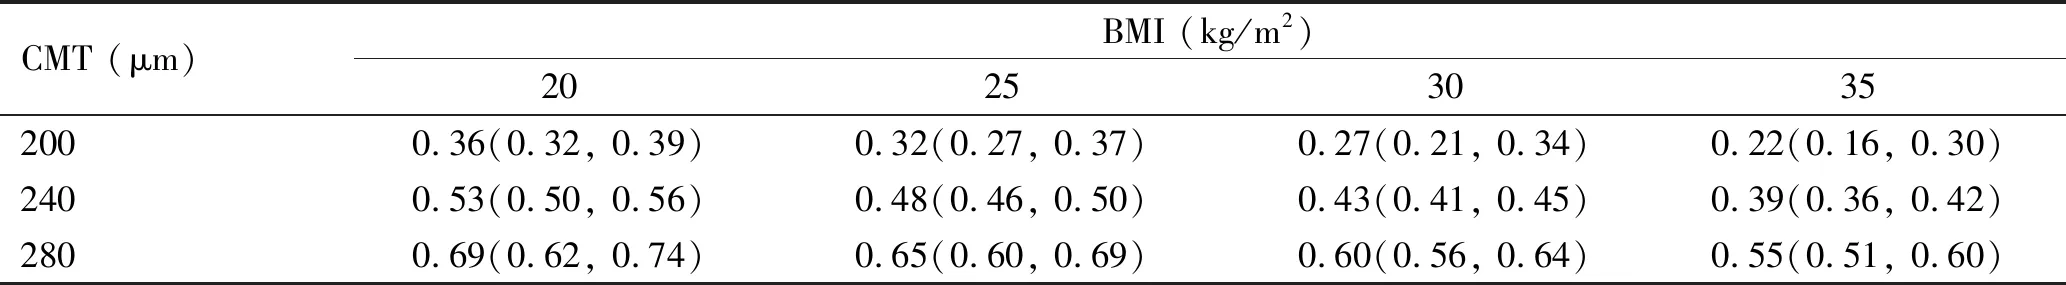
Table 2 Predicted mean MPOD values for particular combinations of CMT and BMI
The 95% confidence interval for mean MPOD is given in brackets. MPOD: Macula pigment optical density; CMT: Central macular thickness; BMI: Body mass index.
From our findings on the correlation of MPOD and foveal thickness, we could suggest that the volume of retinal tissue may influence the amount of macula pigment accumulated in the retina. The relationship is linear, and we suggest that central subfield thickness may explain about 18% variations of MPOD (r2=0.18).
In our study on the further analysis on the correlation between MPOD and BMI, we found a significant inverse correlation between MPOD and BMI. The trend is the same from a low to a high BMI as in a study by Dietzeletal[13]and Ramanetal[14]. In the study done by Bovieretal[15], the MPOD at each retinal eccentricity was related to body fat mass, which is statistically significant for men. However, in a study by Jietal[16], there was no relationships found between MPOD and BMI.
It is possible that there is a competitive factor in uptake of macular pigments into the body fat and the retinal tissue and this postulation is supported by a study done by Johnsonetal[17]. The study measured the amount of pigments in the serum, adipose tissue and the macula of subjects who were supplemented with spinach and corn for 15wk. The diet contained about 5 times as much lutein and 2 times of zeaxanthin in a usual healthy diet. Subcutaneous adipose tissue sample was taken for adipose tissue pigments measurements. They found that the adipose tissue lutein concentration was inverse to the pattern of MPOD. They also noted that at 4wk supplement, there was a significant decrease in adipose tissue lutein and significant increase of MPOD compared to baseline. At the 8wk of supplement, the pattern reversed. Note that in this study, only lutein had significant correlations whereas zeaxanthin correlations were modest. This was due to the small amount of zeaxanthin content in the supplemented diet. The LUTEGA study also found that the supplementation of Lutein, zeaxanthin and omega-3-longchain-polyunsaturated-fatty-acids resulted in considerable increase in MPOD[18-19]. In the PIMAVOSA study has showed an association of MPOD level with plasma lutein, zeaxanthin and omega-3 long chain polyunsaturated fatty acids[20]. The serum xanthophylls, retinal xanthophylls and lipoproteins concentration are significantly related. The changing of the lipoprotein levels may impact the retinal xanthophylls level[21].
The animalstudy done by Thomsonetal[22]analysed the amount of pigments from the sacrificed carotenoid-deficient quails after supplementation with lutein/zeaxanthin. Serum sample, liver, fat and retina tissue biopsies were taken and analysed using a HPLC method. They found a significant inverse correlation between lutein in the fat and in the retina. A study done in spain over 108 subjects, have found a significant correlations in dietary intake and MPOD in the older subjects[23-24].
The findings above, both on human and animal studies, suggest that adipose tissue acts as a reservoir and also compete for the macular pigments. Thereare evidence that adipose tissue has preference on lutein over zeaxanthin[2].
猜你喜欢
无机化学学报(2023年1期)2023-02-03
中国眼镜科技杂志(2022年9期)2022-09-07
国际眼科杂志(2022年7期)2022-07-13
国际眼科杂志(2022年6期)2022-06-05
中国-东盟博览(政经版)(2020年8期)2020-09-27
中国-东盟博览(政经版)(2020年7期)2020-07-30
环球时报(2019-01-31)2019-01-31
学习月刊(2016年4期)2016-07-11
河南教育·职成教(2014年5期)2015-02-02
世界热带农业信息(2014年1期)2014-08-09