
Lamb waves topological imaging combining with Green's function retrieval theory to detect near filed defects in isotropic plates∗
2019-08-06 02:06HuiZhang张辉HaiYanZhang张海燕MengYunXu徐梦云GuoPengFan范国鹏WenFaZhu朱文发andXiaoDongChai柴晓冬
Chinese Physics B 2019年7期
Hui Zhang(张辉), Hai-Yan Zhang(张海燕),†, Meng-Yun Xu(徐梦云), Guo-Peng Fan(范国鹏),Wen-Fa Zhu(朱文发), and Xiao-Dong Chai(柴晓冬)
1Shanghai Institute for Advanced Communication and Data Science,School of Communication and Information Engineering,
Shanghai University,Shanghai 200444,China
2School of Urban Railway Transportation,Shanghai University of Engineering Science,Shanghai 201620,China
Keywords: Lamb waves,topological imaging,cross-correlation,Green’s function
1. Introductions
The use of ultrasonic imaging for nondestructive testing(NDT) has been the subject of many investigations in recent years.[1]B-scan is the simplest method available with a transducer array. Imaging techniques derived from B-scan, such as spatial compounding technique,[2]synthetic aperture,[3]and synthetic aperture focusing techniques,[4]directly associate the arrival time of the ultrasonic waves with the defect positions in the medium. Other techniques, such as migration techniques[5]and time reversal techniques,[6]are based on prior knowledge of the wave propagation in the medium.Topological imaging is an emerging ultrasonic imaging method based on two wave field computations performed for the so-called reference medium.[7]This method relies on mathematical tools to create an image in an equivalent virtual domain from a set of experimental data. Topological optimize is a mathematical method that was first applied to optimize mechanical structures. The topological image will highlight all the differences between the investigated experimental medium and the reference medium. Defect imaging is achieved after an optimization process in which a cost function between the forward and adjoint problem is minimized,without prior assumptions of locations and shapes of defects.
The application of topological imaging in NDT started in the last decade. High resolution results have been presented for imaging scatterers using bulk wave inspection.[8-14]In the early stage, topological gradient was mainly used as imaging function,[8-11]because it directly influenced the change of cost function. However, the method required many times of iterations to achieve a high resolution. Subsequently, the researchers began to explore the use of other fast imaging methods,for instance,the time domain topological energy method proposed by Dominguez and Gibiat[13]and frequency domain topological imaging by Rodriguez and his co-authors.[14]Recently, the topological imaging has been extended to inspect the plate-like waveguide.[15,16]Rodriguez et al.[15]investigated guided wave topological imaging of isotropic plates based on propagation of the single S0 Lamb mode. Despite a high dispersion of S0 mode, scatterers were accurately located and the defect imaging was obtained with a spatial resolution of one wavelength.In contrast to classical and advanced delay and sum imaging method, topological method does not involve explicit computations of rays among emitters,defects,and receivers.The necessary information is implicit in the two wave field computations performed in the defect-free medium.Therefore,if wave propagation can be properly simulated in a given medium,then the defects of the medium can be imaged whatever the complexity of the propagation process.The topological method has also been applied to defect imaging in the anisotropic plates.[16]
Ultrasonic array imaging has been widely used in modern industrial NDT.[17]Each element of an array can be pulsed independently. The response of an ultrasonic transducer in pulse-echo operation contains nonlinear effects caused by physical limitations of acquisition systems(e.g.,ultrasonic reverberation within the transducer) which obscure early time acoustic information.[18]The problem is exacerbated when using ultrasonic arrays in which the proximity of elements leads to saturation of neighboring elements through electrical and mechanical cross-talk. A solution to alleviate the nonlinear effect is to introduce a stand-off medium between the transducer and specimen, which reduces the acoustic energy transmitted to the specimen and the additional refracted modes that may induce imaging artifacts. Classical techniques for NDT purposes rely mainly on pitch-catch measurements of direct ultrasonic waves between an actuator and a receiver in the region to be measured. In this study,we propose an approach to retrieve the near field acoustic information through cross-correlation of directly received ultrasonic signals between sensor pairs.
It has been indicated theoretically and experimentally that the cross-correlation between signals recorded simultaneously at two points can provide an estimate of the Green’s function between two points.[19-24]Through this, a virtual array of emitters and receivers is formed. Hence, Green’s function is applicable for the retrieval of information obscured by the operating limitations of the acquisition systems.Early applications were in the fields of geo-physics and underwater acoustics.[19-21]Recently, researchers have applied this method for the purpose of structural diagnostics. Yang et al.[22]presented a characterization method by measuring Green’s function reconstruction from noise excitation and verified the feasibility of crack detection in poor noise source detection. Experimental investigations were undertaken to detect fatigue cracking due to variation of the cross-correlation function as a damage index between pristine state in lowamplitude excitation and the crack open-closure state. A fatigue crack introduced in an aluminum plate was successfully identified and oriented,proving that this technique was effective in detecting fatigue cracking from ambient noise. Duroux et al.[23]performed experimental study for damage detection in a thin aluminum plate with complex geometry. The experimental results of this study suggested that measuring the relative amplitude variations of the cross-correlation function of elastic diffuse fields could potentially provide a sufficiently robust tool for passive monitoring or imaging of a structural damage. Chehami et al.[24]presented an experimental validation of a passive technique for defect localization in metallic plates. A correlation matrix was estimated from noise vibrations recorded on a transducer array. A defect was localized by applying a beam forming algorithm to the difference between the correlation matrices obtained with and without the defect. They successfully detected defects for different kinds of noise sources. Sabra et al.[25]experimentally used the cross-correlation of ambient vibrations (CAV) technique in a high-speed naval ship for passive structural health monitoring. The influence of the ship’s operating conditions on the stability of the peak coherent arrival time was discussed.
This paper reports an approach of retrieval and imaging of near field defects using Lamb waves. The capacity of the proposed approach to identify near field defects is demonstrated experimentally on two aluminum plates containing two and four defects,respectively. This paper is organized as follows.Section 2 illustrates the method of full matrix reconstruction.Section 3 presents the theory of topological imaging. Experiments are conducted and the results are discussed in Section 4. Section 5 summarizes the main work.
2. Full matrix reconstruction method
2.1. Retrieval of Green's function
It has been shown in seismology that ensemble averaging the cross-correlation of responses recorded at two monitoring stations, the direct response between the stations is obtained.It is assumed that there is random noise source ri(i=1,2,...)on a closed surface S surrounding two receivers A and B,and their field intensities are q(ri,ω). The derivation in this work is applicable to the frequency domain. According to acoustic field superposition principle,acoustic fields at receiver A and B are

where G(rA,ri,ω) and G(rB,ri,ω) denote the Green’s function between riand rAand rB,respectively.
In an acoustic field, it is assumed that the noise sources are spatially distributed and uncorrelated. With the power spectrum|q(ω)|2,we have

where 〈·〉 denotes the expectation value,∗denotes complex conjugation,and δ(·)is Dirac delta function. The correlation between p(rA,ω)and p(rB,ω)is given by

where r1=r2=r,and r is the distance from the noise source to the scatterer.
The following expression can be deduced:[26]

Inserting Eq.(4)into Eq.(3)gives

Through the inverse Fourier transform of Eq. (5), Green’s function in the time domain is obtained

where ∗denotes the convolution.CA,B(t)=p(rA,t)⊗p(rB,t)is the cross-correlation between p(rA,t) and p(rB,t), and Cq(t)is the auto-correlation of q(t).
It is indicated from Eq.(6)that the time-derivation of the cross-correlation function converges to a Green’s function between two points,and is a theoretically symmetric function of time owing to the wave reciprocity.[22]
2.2. Reconstruction of full matrix
Full matrix capture is a process of sequential acquisition of responses for every transmitter-receiver transducer pair of ultrasonic array which are then collated to form the so-called full matrix.[27]Various post-processing approaches are developed to improve the imaging resolution.[28]Here,the time domain responses of the direct captured full matrix hi,j(t) are called as directly captured full matrix,where the first and second indices correspond to transmitting and receiving elements,respectively. The reconstructed full matrix gi,j(t)is obtained by cross-correlating the responses of element i with that of element j,averaged over all transmitting elements. For an N element array,in the time domain,the new matrix may be written as follows:

The new matrix is equivalent to hi,j(t), i.e., gi,j(t)≈hi,j(t)but is not polluted by the early time measurement noises.
3. Topological imaging method
The topological imaging method defines two physical problems to be solved: the direct and the adjoint problem.[15]The solution of these problems corresponds to the simulation of the propagation of two different sets of waves emitted at the location of the array. In the direct problem, the experimental source is simulated. In the adjoint problem, the source is the time-reversed difference between the measured wave field and that obtained from the direct problem. The two field computations are performed in the defect-free medium.The topological image is computed by multiplying both wave fields together in the time or frequency domain, and integrating over the time or frequency. The work presents the application of time domain topological energy method(TDTE)[11,13]for nondestructive testing. The analytical method is used in the acoustic field simulation.
Considering two isotropic homogeneous bounded media,the first is defect-free(reference medium Ω0)while there are defects in the second one (inspected medium Ωm). Both of them are insonified by a linear transducer array. Transducer i (i=1,2,...,N) transmits a plane wave to both media. Backscatter signals are captured by each receiver j(j =1,2,...,N). The residue between these two ultrasonic responses is then computed as

The forward and adjoint problems are solved according to Lamb wave propagating model. Let the exciton be e0(t),and the acoustic field u0(x,y,t)at imaging area(x,y)is calculated based on the Eq.(9). This is the acoustic field solution in the forward problem[29]
where F{·} and F-1{·} are Fourier transform and inverse Fourier transformation, respectively, and cp(f) is the phase velocity of Lamb wave mode computed by Rayleigh-Lamb equation.[30]represents the distance between the acoustic field coordinates(x,y)and emitting source coordinate(x0,y0). In the adjoint problem, the timereversal Δsi,j(t)is used as emitting source of each transducer.The acoustic field in the adjoint problem is calculated
where T is the duration of wave propagation. The topological energy E0(x,y)[11,13]can then be expressed from the two fields u0(x,y,t)and v0(x,y,t)
The topological imaging process using the time domain topological energy method is shown in Fig.1.
4. Experiment
Measurements are carried out using an M2M MultiX LF system (M2M-NDT Co. Ltd, France). Two 1 mm thickness aluminum plates are investigated in this work. A 16-element linear array(Shantou Ultrasonic Electronics Co. Ltd,Guangdong,China)is used. The array is composed of 16 transducers each with a central frequency of 1 MHz. The transducer width is 1.8 mm and the pitch size is 2 mm. Thus,the whole array is 31.8 mm long. The height of the transducer is 15 mm. Similar to previous literatures,[15,16]the array is coupled to the plate on the edge so that it is sensitive to the in-plane motion,as shown in Fig. 2. The transducers apply a force along the z-axis and are in contact with the whole thickness of the plate,which allows the displacement over the entire thickness of the plate on the contacting boundary to be recorded. Thus, it is assumed that only the stress component on the z-axis is nonzero and is constant over the thickness. Therefore,only the symmetric modes propagate significantly in the medium.
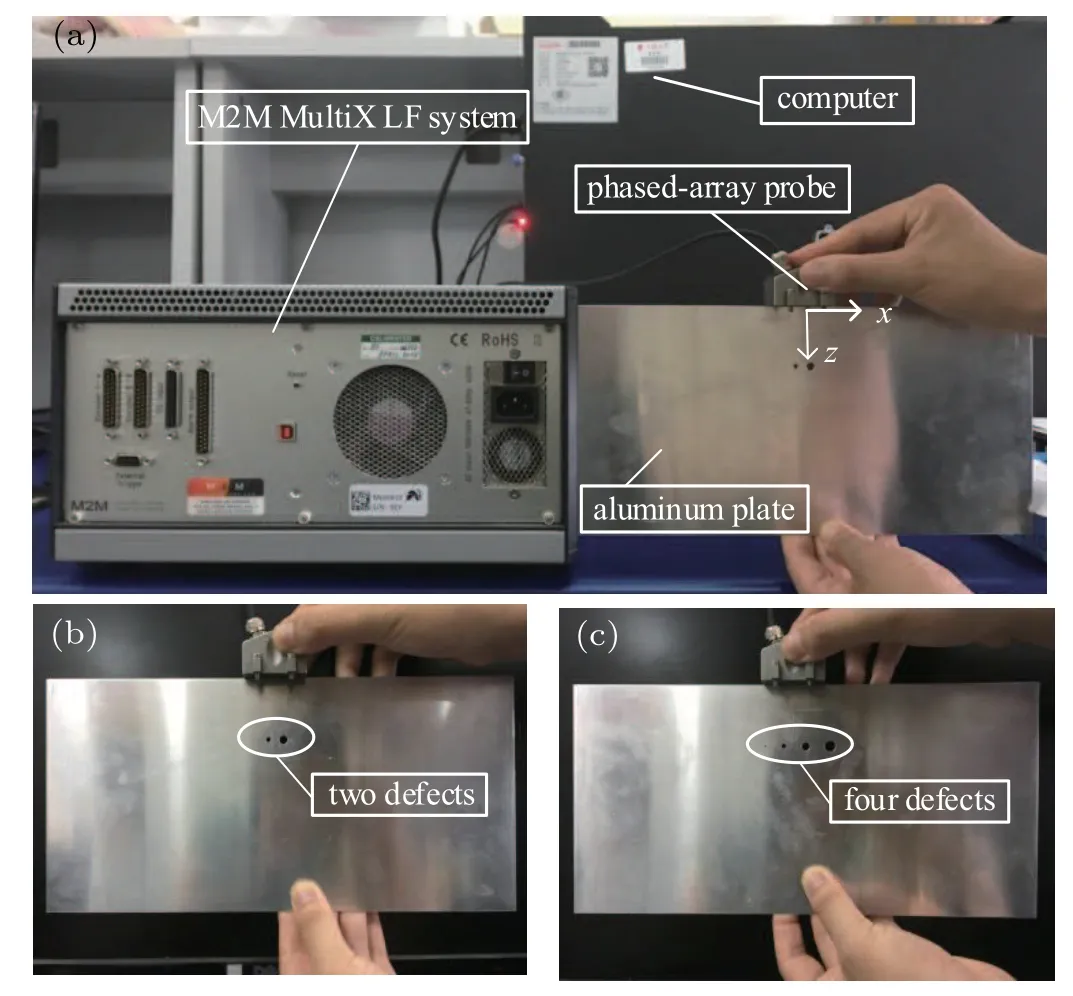
Fig. 2. Experimental setup: (a) system configuration; (b) aluminum plate A with two defects;(c)aluminum plate B with four defects.
The relative positions of the defects on the two inspected plates are specified in Fig. 3. Both plates are 300 mm long and 150 mm wide. In plate A, the defects are two throughthickness holes with the diameter 3 mm and 5 mm respectively and the distance between their centers is 6 mm, as shown in Fig. 3(a). In plate B, the defects are four through-thickness holes with the diameter 1 mm, 3 mm, 5 mm, and 7 mm respectively,and the distance between their centers is 9 mm,as shown in Fig.3(b). These defects are 40 mm from the edge of the two plates.

Fig.3. Schematic diagram of defects and transducers location: (a)aluminum plate A with two defects; (b) aluminum plate B with four defects.
The excitation is a five-cycle Gaussian sinusoidal signal with a central frequency of 1 MHz. Such a signal covers the whole frequency bandwidth of the transducers. Considering the 1 mm thickness of the two plates,the frequency-thickness product is 1 MHz·mm. The corresponding S0 mode is excited at this frequency-thickness product and its velocity v and the wavelength λ (λ =v/f) are equal to 5300 m/s and 5.3 mm,respectively. According to the near field formula[31]

These defects are located in the near field because the distance of the defects from the plate edge 40 mm is less than Nd=D2/4λ =31.82/(4×5.3)=47.7 mm, where D is the aperture of the array transducer.
The emitting-receiving mode of the probe is set to the full matrix mode. The sampling frequency is 50 MHz. One of the transducers is used as an emitter and all of the transducers(including the emitter itself)record the Lamb wave signals.

Fig.4. Time trace of i=16, j=12 for aluminum plate A:(a)directly captured;(b)reconstructed.
To quantitatively evaluate the processing effect of the reconstructed matrix, the signal to noise ratio (SNR) is calculated[32]
where var(signal) and var(noise) are the variances of the signal within the scattering zone and the incident zone, respectively. In Fig. 4, the zones of signal and noise are 20-30 µs and 0-20 µs, respectively. In Fig. 5, the zones of signal and noise are 20-40 µs and 0-20 µs, respectively. For the signal in Fig. 4, the SNR of the directly captured signal is 10log109.12×10-5/0.1017≈-30.5 dB, and the SNR of the reconstructed signal is 10log10≈-25.1 dB. The improvement of SNR is about 5.4 dB. For
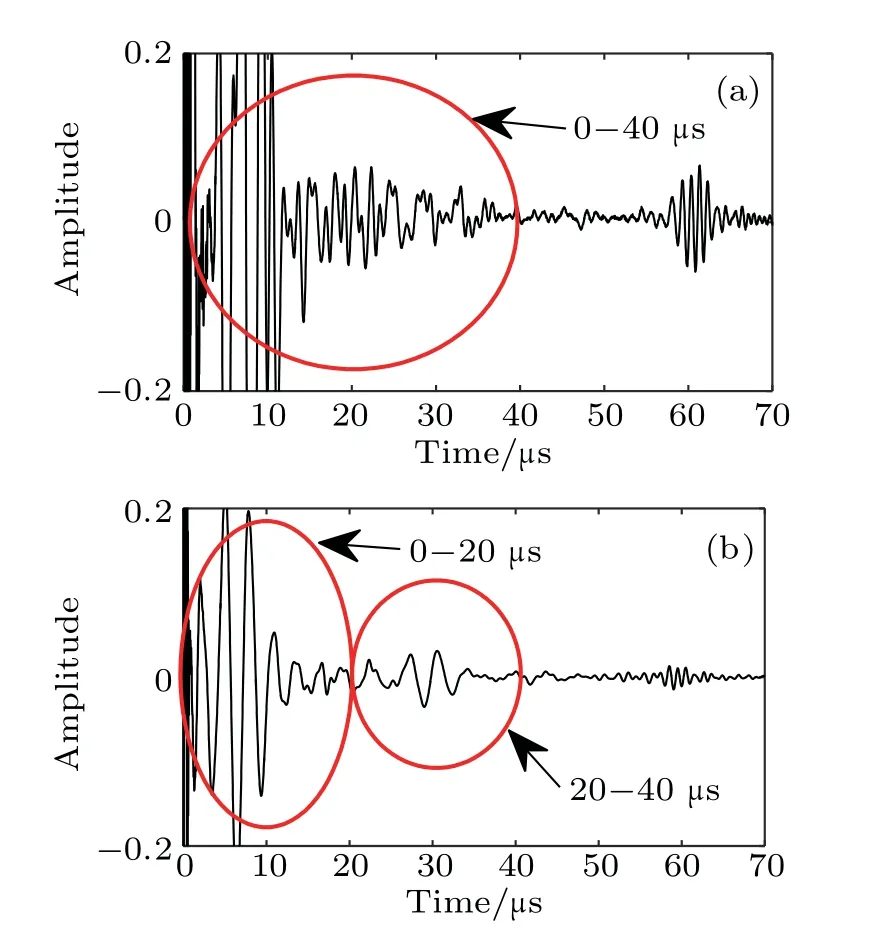
Fig.5. Time trace of i=16, j=12 for aluminum plate B:(a)directly captured;(b)reconstructed.
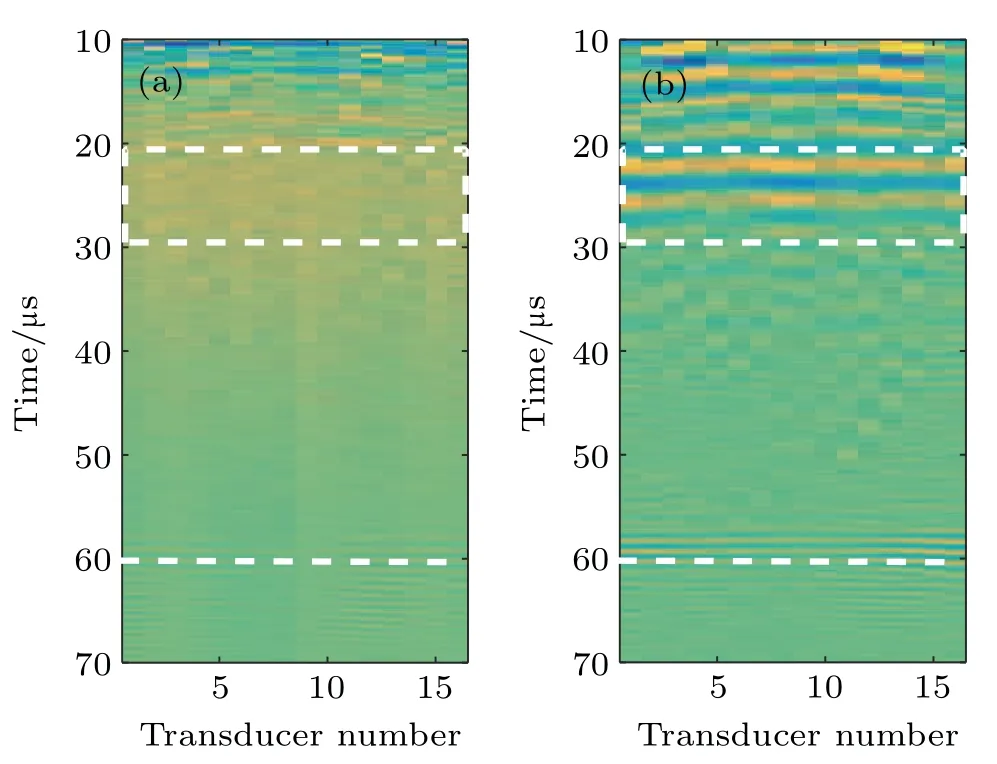
Fig.6.Pulse-echo responses of each element(i= j)for aluminum plate A:(a)directly captured;(b)reconstructed.

Fig.7.Pulse-echo responses of each element(i= j)for aluminum plate B:(a)directly captured hi,j(t);(b)reconstructed gi,j(t).
Thus,a 16×16 full matrix is captured. Two examples of typical time traces for i=16, j=12,of each full matrix for two plates are shown in Figs.4 and 5. The length of captured windows is 70µs, corresponding to 3500 data points captured at a sampling rate of 50 MHz. Each time trace is normalized to its peak value. It can be seen that the near-field defect information obscured in the direct capture signal hi,j(t) has been retrieved in the reconstructed signal gi,j(t). The restoration of near-field information can be presented more clearly when viewing a larger subset of the full matrix. Figures 6 and 7 show the pulse-echo response that is equivalent to a B scan for each element(i= j).Here,individual near-field reflections for the defects can easily be distinguished in the time domain 20-30µs(marked in the dashed box)in the reconstructed full matrix in Figs.6(b)and 7(b). However,the information is hidden in the initial waves because the defects are located in the nearfield region, as seen in Figs. 6(a) and 7(a). Additionally, the bottom reflection present at approximately 60 (marked with dashed line)can be displayed in the reconstructed data but not as clearly as when it is obtained directly.the signal in Fig. 5, the SNR of the directly captured signal is 10log10≈-36.5 dB and the SNR of the reconstructed signal is 10log10≈-24.5 dB. The improvement of SNR is about 12 dB.
In terms of this calculation,the SNR of the reconstructed full matrix is obviously improved,which demonstrates the feasibility of the proposed method.
5. Imaging results and discussion
It has been observed that although the defects in aluminum plate A and B are different, the B-scan images of the two plates are visually similar, especially for Figs. 6(b) and 7(b). Subtle difference of these images can be displayed in the residuals of Figs.6(a)and 7(a),and Figs.6(b)and 7(b),as shown in Figs.8(a)and 8(b). Thus,more advanced ultrasonic array imaging method is required to identify the number and size of defects. In this paper,the recent emerging topological imaging is used for obtaining high resolution images. As described in Sections 2 and 3,ultrasonic signals of directly captured full matrix are first processed using cross-correlation and statistical average calculation by Eq.(7).Then,the fields associated to direct and adjoint problems are calculated by Eqs.(9)and (10). Finally, the topological energy formula in Eq. (11)is used to topological imaging.
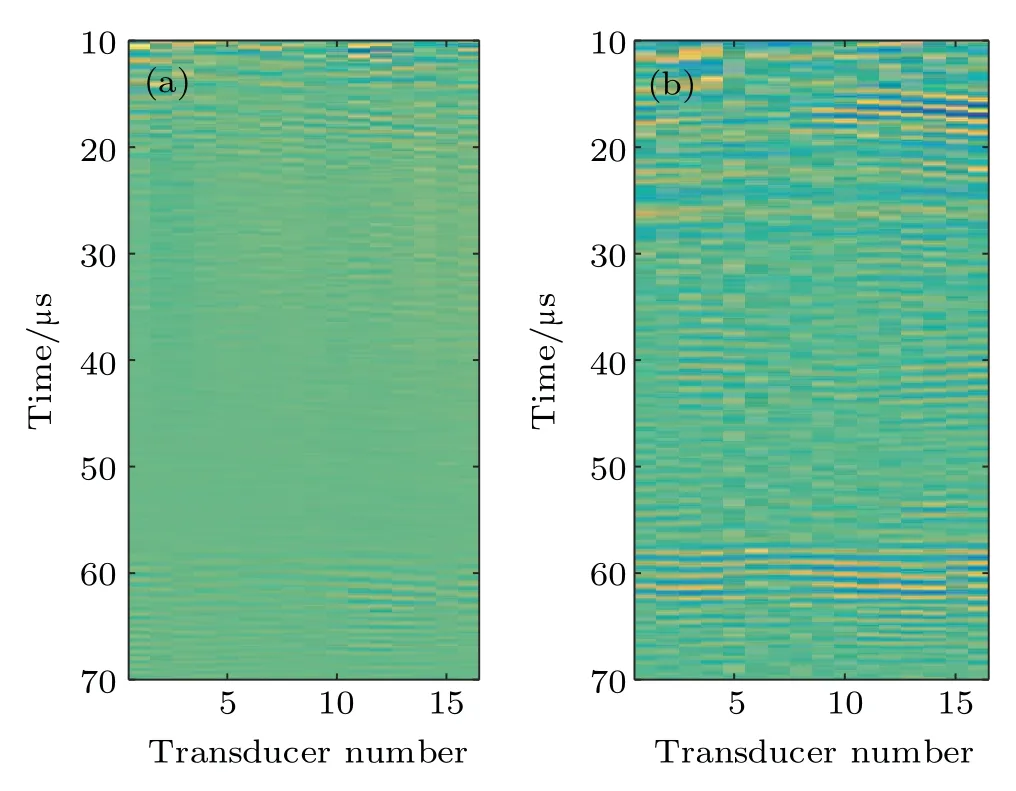
Fig.8. Residuals of(a)Figs.6(a)and 7(a),and(b)Figs.6(b)and 7(b).
Topological images generated using directly captured and reconstructed full matrices for two inspected specimens are shown in Figs. 9 and 10, respectively. For aluminum plate A, the distance between two defects is 6 mm, which is approximately equal to one wavelength of the S0 mode.As shown in Figs. 9(a) and 9(b), the two defects can be individually distinguished in the reconstructed full matrix image, while they overlap in the directly captured full matrix because of the background noise. Figures 9(c) and 9(d)provide a face to face comparison between the results obtained using the directly captured and reconstructed methods,

Fig. 9. Topological image of the aluminum plate A: (a) using the directly captured full matrix; (b) using the reconstructed full matrix; (c)profile curve of panel (a) along the center of the defects; (d) profile curve of panel(b)along the center of the defects.
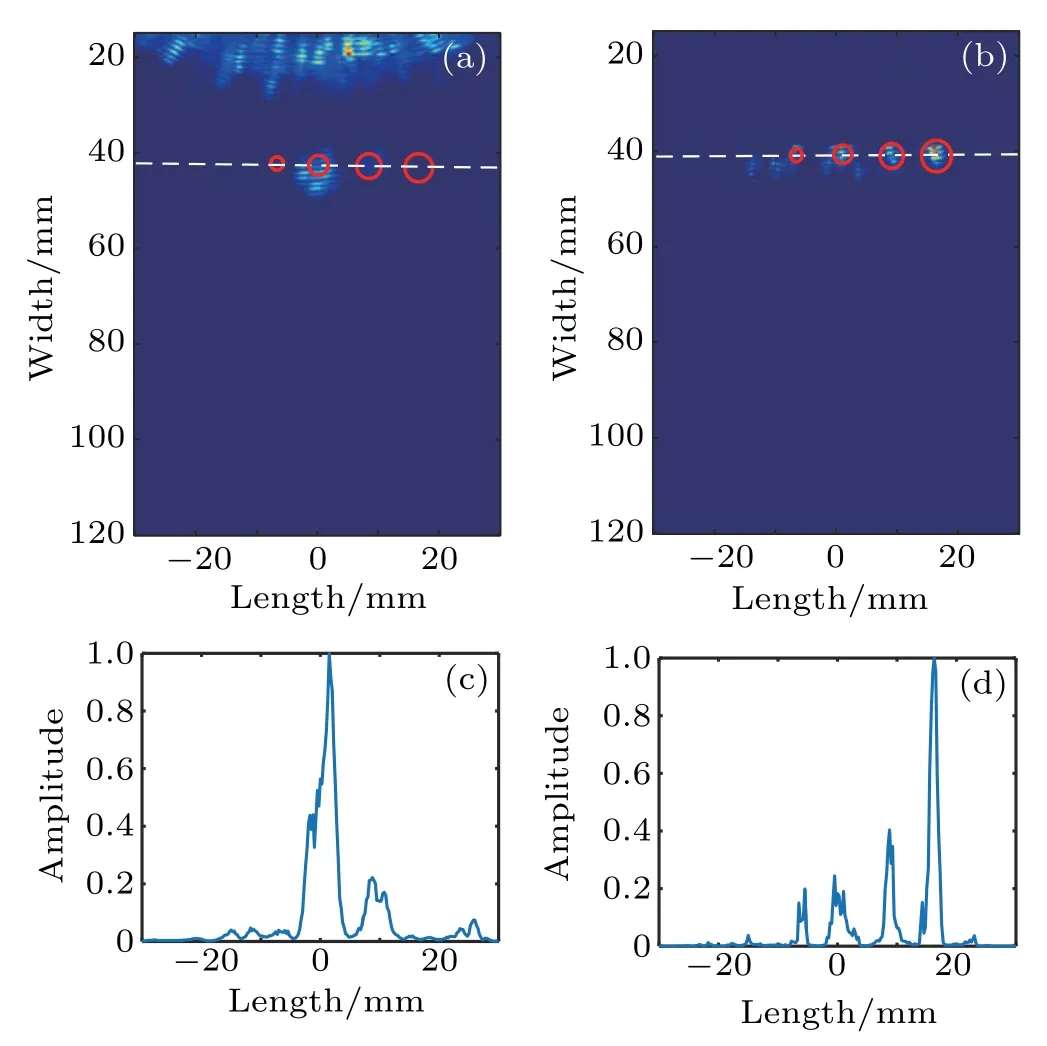
Fig. 10. Topological image of the aluminum plate B: (a) using the directly captured full matrix; (b) using the reconstructed full matrix; (c)profile curve of panel (a) along the center of the defects; (d) profile curve of panel(b)along the center of the defects.
where the related amplitude profiles are obtained at 40 mm far from the probe. As shown in Fig. 9(d), two peaks of different amplitudes correspond to two defects of different sizes. The spacing of two peaks is about 6 mm. This is consistent with that of the actual defects. However, there is only a main large peak in Fig. 9(c) and the small defect cannot be determined. Similar phenomena can be observed in Fig.10 for aluminum plate B with four defects. The distance between adjacent defects is 9 mm, which is about 1.6 times of the wavelength. The smallest defect is 1 mm,which is approximately equal to one fifth of the wavelength. The four defects of different sizes are still clearly distinguished in the topological image of reconstructed full matrix,the spacing of which is consistent with that of the actual defects. Because of the scattering among the defects,the energy of each defect in Fig. 10(b) is not as concentrated as that of each defect in Fig.9(b).
6. Conclusions
In this paper, we have applied the Green’s function retrieval theory and Lamb wave topological imaging method to discern near field defects in thin aluminum plates. Near field acoustic information is obscured by nonlinear effects of instrument acquisition system. The theory demonstrates that a full matrix can be reconstructed through cross-correlation of directly received ultrasonic signals between sensor pairs. The new matrix restores the near-field defect information without acquisition artefacts. Experiments are undertaken to detect both aluminum plates containing near filed defects with different sizes. Compared to the conventional directly captured full matrix, the SNR of the reconstructed full matrix is improved by more than 5 dB.Furthermore,topological imaging shows that the aliasing holes in a conventional directly captured topological image can be clearly resolved when using the reconstructed full matrix. The spatial resolution is equal to one wavelength of the selectively excited S0 mode and the identifiable defect is about one fifth of the wavelength. The results demonstrate that the method based on Green’s function reconstruction is effective for near field defect imaging from directly contact ultrasonic measurement.
To show the great potential of Green’s function retrieval and topological imaging of near field defects to inspect large plate-like structures, the results presented in this paper have been preliminarily limited to monomodal excitation and isotropic media. Since the presented method is in essence based on information processing and wave field computation, there is no theoretical obstacle in applying the method to anisotropic media, such as the detection of fatigue cracks and depressions in flying bodies or multimodal guided wave inspection. These new investigations are now in progress.
猜你喜欢
大观(2022年11期)2023-01-03
中国典型病例大全(2022年11期)2022-05-13
中国典型病例大全(2022年9期)2022-04-19
Chinese Physics B(2022年2期)2022-02-24
河北教育(教学版)(2021年10期)2022-01-14
书香两岸(2020年3期)2020-06-29
创新作文(1-2年级)(2019年5期)2019-11-21
武大国际法评论(2019年6期)2019-04-09
作文大王·低年级(2018年7期)2018-08-15
西部论丛(2017年3期)2017-09-11

- Chinese Physics B的其它文章
- Coercivity mechanisms in nanostructured permanent magnets∗
- Progress in recycling of Nd-Fe-B sintered magnet wastes∗
- Grain boundary restructuring and La/Ce/Y application in Nd-Fe-B magnets∗
- Topology of triple-point metals∗
- Local evolutions of nodal points in two-dimensional systems with chiral symmetry∗
- Structural,elastic,and electronic properties of topological semimetal WC-type MX family by first-principles calculation∗