
Photoluminescence properties of blue and green multiple InGaN/GaN quantum wells∗
2019-11-06 00:46ChangFuLi李长富KaiJuShi时凯居MingShengXu徐明升XianGangXu徐现刚andZiWuJi冀子武
Chinese Physics B 2019年10期
Chang-Fu Li(李长富), Kai-Ju Shi(时凯居), Ming-Sheng Xu(徐明升),Xian-Gang Xu(徐现刚), and Zi-Wu Ji(冀子武),†
1School of Microelectronics,Shandong University,Jinan 250100,China
2School of Physics and Electronic Engineering,Taishan University,Taian 271000,China
3Key Laboratory of Functional Crystal Materials and Devices(Ministry of Education),Shandong University,Jinan 250100,China
Keywords:photoluminescence,multiple quantum wells,localization effect,light-emitting diodes
1.Introduction
White light-emitting diodes(WLEDs)have exhibited more extensive applications in liquid crystal display backlighting and solid-state general lighting in recent years.[1–5]However,the most common WLEDs are LED-plus-phosphorbased,and they suffer an unavoidable Stokes energy loss and have a low color-rendering index(CRI).[2,6,7]Therefore,it is necessary to find a new method of preparing prototype phosphor-free monolithic WLEDs as an alternative to phosphor-based WLEDs. The entire spectral range of a nitride system can be obtained by tuning the indium composition in an InGaN alloy,so the InGaN alloys have become materials having significant potential to be used as active layers in LEDs.[8–11]It has been reported that monolithic WLEDs can be achieved by stacking dual-wavelength emitting InGaN/GaN multiple quantum wells(MQWs)in GaN p–n junctions.[12,13]
Currently, the preparation technology of InGaN/GaN MQW-based blue LEDs has become relatively mature,and a high-efficiency(84.3%)blue LED based on InGaN/GaN MQWs has been achieved.[14]However, the InGaN/GaN MQW-based long-emitting-wavelength LED,such as green LED,is still in its inception in research and development terms;moreover,the optimal parameters for the growth of a high-In-content InGaN epilayer on GaN remain uncertain.The difficulty in preparing high-In-content InGaN epilayers is due mainly to the fact that indium and gallium have a significant discrepancy in atomic size,and the lattice mismatch between InN and GaN is as high as 11%, which may cause slight compositional fluctuations or strong phase separation.[8]These In-rich regions in this kind of structure serve as localization centers of carriers to improve the radiation recombination rate of the carriers,but at the same time they also lead the structural defects to be generated and light emission efficiency to be reduced.[9]Moreover,a quantumconfined Stark effect(QCSE)triggered by a piezoelectric polarization field in the high-In-content InGaN/GaN QW due to the large lattice mismatch between GaN and InGaN,also results in an increase in the spatial separation of electrons and holes and a decrease in the radiative recombination efficiency of the carriers in the MQW.Therefore,although monolithic WLEDs simultaneously emitting two colors have been achieved by growing two InGaN/GaN MQW-based active regions with different indium content on a single substrate,the long-wavelength components demonstrated quite a low internal quantum efficiency(IQE).[12,13]Hence,it is necessary to improve the understanding of the emission mechanism of blue and green dual-wavelength InGaN/GaN MQW epitaxial structures,thus preparing high-performance phosphor-free monolithic WLEDs that emit photons at different wavelengths with an appropriate power ratio.
Photoluminescence(PL)measurements are an effective method to analyze the characteristics of InGaN/GaN MQWs.They can clearly reflect the effects of impurities/defects,composition fluctuation,and strain on optical properties of the MQWs.Here,in order to ascertain the effects of the indium content on the emission mechanism in InGaN/GaN MQWs and the mechanism of interrelation between two active regions grown on a single sapphire substrate,an InGaN/GaN MQW structure containing two active regions with lower(blue MQWs)and higher(green MQWs)indium content,is grown,while dependence of the PL spectrum on temperature(T)and excitation power for the two active regions are investigated in a large range of temperature and excitation power.
2.Experiment
Through using the metal-organic chemical vapor deposition(MOCVD),one has grown an InGaN/GaN MQW sample on a sapphire substrate oriented to(0001). Before the process,the substrates were thermally annealed at 1100◦C in a hydrogen atmosphere to remove surface contamination from the sapphire substrate. In the process of growth,a 25-nm-thick GaN nucleation layer was deposited at 530◦C,followed by forming a 4-µm-thick undoped GaN layer and a 3-µm-thick Si-doped GaN layer at 1080◦C.Then,three pairs of InxGa1−xN/GaN(x ≈0.05)strain relief layers(SRLs)with 1-nm-thick InGaN wells and 5-nm-thick GaN barriers were grown at 800◦C.Two InGaN/GaN MQW active regions,blue MQW(BMQW)and green MQW(GMQW),were formed at the same trimethylindium(TMIn)flow rate and in an N2ambient atmosphere after growing SRL:firstly,three pairs of InxGa1−xN/GaN(x ≈0.15)BMQWs with 3-nmthick InGaN wells(750◦C)and 17-nm-thick GaN barriers(850◦C)separately were grown,followed by growing nine pairs of InyGa1−yN/GaN(y ≈0.22)GMQW with InGaN wells(725◦C,3-nm thick)and GaN barriers(850◦C,17-nm thick).
For the measurement of PL dependence on excitation power and temperature,the sample was placed in a closedcycle He cryostat to control the temperature changing from 6 K to 300 K.A 405-nm continuous wave(CW)semiconductor laser with a spot size of approximately 300µm was adopted to excite the PL signals, and the excitation power was varied between 0.005 mW and 100 mW.A Jobin–Yvon iHR320 monochromator and a thermo-electrical cooled Synapse charge-coupled device(CCD)detector were used for the dispersion and detection of PL signals from the sample.
3.Results and discussion
Figure 1 shows a typical PL spectrum of sample obtained at 100-mW excitation power and 300 K.Two emission peaks related to InGaN matrix can be found at approximate 2.603 eV(476 nm)and 2.338 eV(530 nm),which are assigned to the near-band-edge transitions(denoted by PBand PG)related to the BMQW matrix and GMQW matrix,respectively.To reveal the transfer and recombination mechanism of carriers in the two active regions,the dependence of their PL spectra on temperature and excitation power are presented and discussed below.
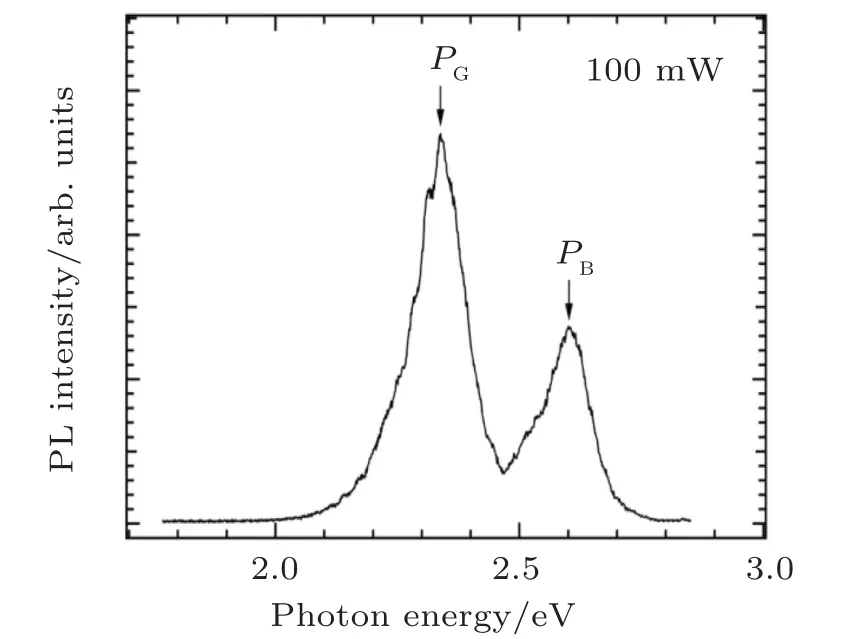
Fig.1.Measured PL spectrum of sample at 100 mW and 300 K.
Figure 2 shows the dependence of peak energy for the two emissions(PBand PG)on temperature at 0.005-mW excitation power.It can be found from Fig.2 that no dependence follows Varshni’s equation[15]

where α=0.329 meV/K and β=972 K for PB,and α=0.294 meV/K and β=878 K for PG,while they are“Sshaped”.[9]It was also found(from Fig.2)that the peak energy conforms to Varshni’s equation only when the temperature exceeds ∼160 K for PBand ∼180 K for PG.Also,the temperature-dependent behavior of the PGpeak energy shows a larger localization depth(∼22 meV)than that of the PBpeak energy(∼5 meV).[8,16]These behaviors indicate that carrier localization effects originating from the compositional fluctuation in InGaN well layers are present in both the BMQW and GMQW,[17]but the latter is found to have a higher localization effect than the former.This may be due to the stronger compositional fluctuation in the green multiple InGaN/GaN quantum well with its higher indium content.The presence of the higher In-content and stronger compositional fluctuation in the green multiple InGaN/GaN quantum well is mainly attributed to the lower growth temperature(725◦C)and the strain release induced by the underlying BMQW layer of the green multiple InGaN/GaN quantum well.

Fig.2.Temperature-dependent peak energy for PB and PG,measured at 0.005 mW.
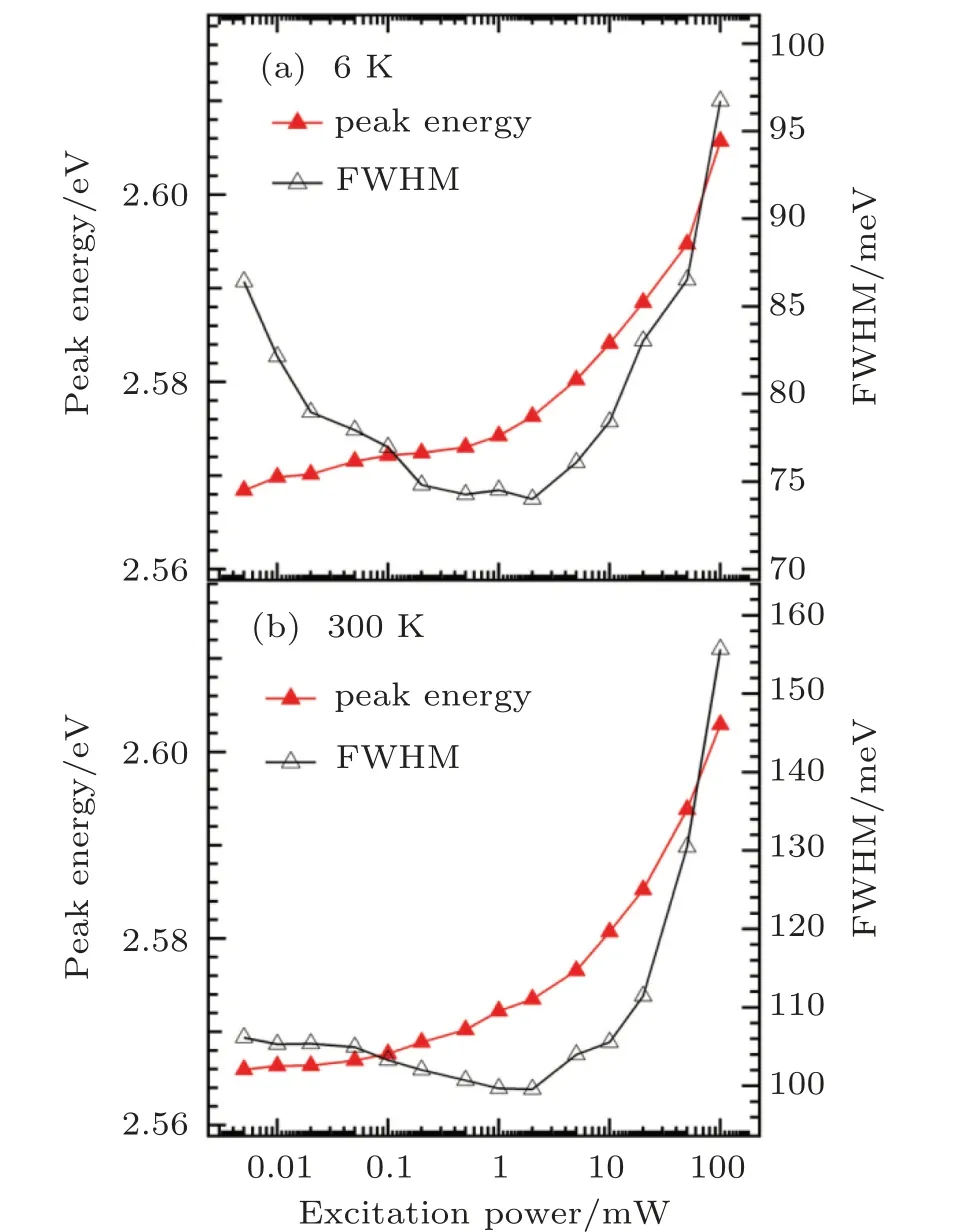
Fig.3. Dependence of PB peak energy and full-width at half-maximum(FWHM)on excitation power,measured at 6 K(a)and 300 K(b).
Figures 3(a)and 3(b)show excitation-power-dependent PBpeak energy and line-width at 6 K and 300 K,respectively.As shown in Fig.3(a),when the excitation power increases from 0.005 mW to 100 mW at 6 K,the peak energy tends to increase monotonically,showing a narrowing line-width below 2 mW and then a broadening line-width above 2 mW.The former is explained by the Coulomb screening of the QCSE in the BMQW,and the latter is mainly because of the band filling of the localized centers in the higher excitation power range due to the reduction of the QCSE.[9,18–20]At 300 K,as seen in Fig.3(b),comparing with the situation at 6 K,both initial increase in the peak energy and the initial narrowing in the peak line-width,which is a function of the excitation power,become less significant in a lower range of excitation power below ∼0.05 mW.This phenomenon may be attributed to the combined effect of Coulomb screening and non-radiative recombination,since the defect-related non-radiative centers in the BMQW are thermally activated at 300 K.Nevertheless,as the excitation power increases to greater than ∼0.05 mW,a trend similar to that observed in Fig.3(a)is seen in Fig.3(b)as non-radiative centers become saturated.
Figures 4(a) and 4(b) show the excitation-powerdependent PGpeak energy and line-width,measured at 6 K and 300 K,respectively. Figure 4(a)shows that at 6 K,unlike the case of the PBpeak energy at 6 K in Fig.3(a),when the excitation power rises within an excitation power range below ∼0.2 mW,both the PGpeak energy and line-width significantly decrease.This happens because of an strengthened scattering effect of carriers,which results in carriers being transferred from shallow localized states downwards deeper states through tunneling effect when the excitation power is increased.[21,22]The aforementioned experimental result(Fig.2)evinces this point:a GMQW has a stronger potential inhomogeneity and localized characteristic for recombination of carriers than a BMQW;however,when the excitation power exceeds 0.2 mW,the scattering effect of carriers is inhibited because deep localized states are saturated,so a similar phenomenon(Fig.3(a)for PB)is observed across a higher excitation power range above ∼0.2 mW in Fig.4(a)for PG.However,at 300 K,it can be seen from Fig.4(b)that unlike the situation at 6 K(Fig.4(a)),the PGpeak energy increases slightly as the excitation power increases from 0.005 mW to∼0.02 mW.Apart from this,the peak line-width exhibits that it narrows down to 59.0 meV at 300 K,which is markedly larger than that(17.6 meV)at 6 K in the range of evaluating excitation power.This happens because at the higher temperature(300 K),localized carriers in the GMQW are thermally activated;activated carriers partially occupy the localized states at higher energy levels and partially shift from localized states into conduction and valence bands.As a result,when the excitation power is increased from 0.005 mW to 0.02 mW,the scattering effect of localized carriers and Coulomb screening effect of free carriers together play a dominant role in the recombining of the GMQW,and this leads to a very slight increase in the peak energy,in addition to significant narrowing of the line-width. Nevertheless,if the excitation power exceeds ∼0.02 mW,the Coulomb screening effect of free carriers gradually diminishes and scattering effect of localized carriers is enhanced since the conduction and valence band of the GMQW structure gradually become flat. Hence,a phenomenon similar to that described in Fig.4(a)occurs at excitation powers above 0.02 mW(Fig.4(b)).
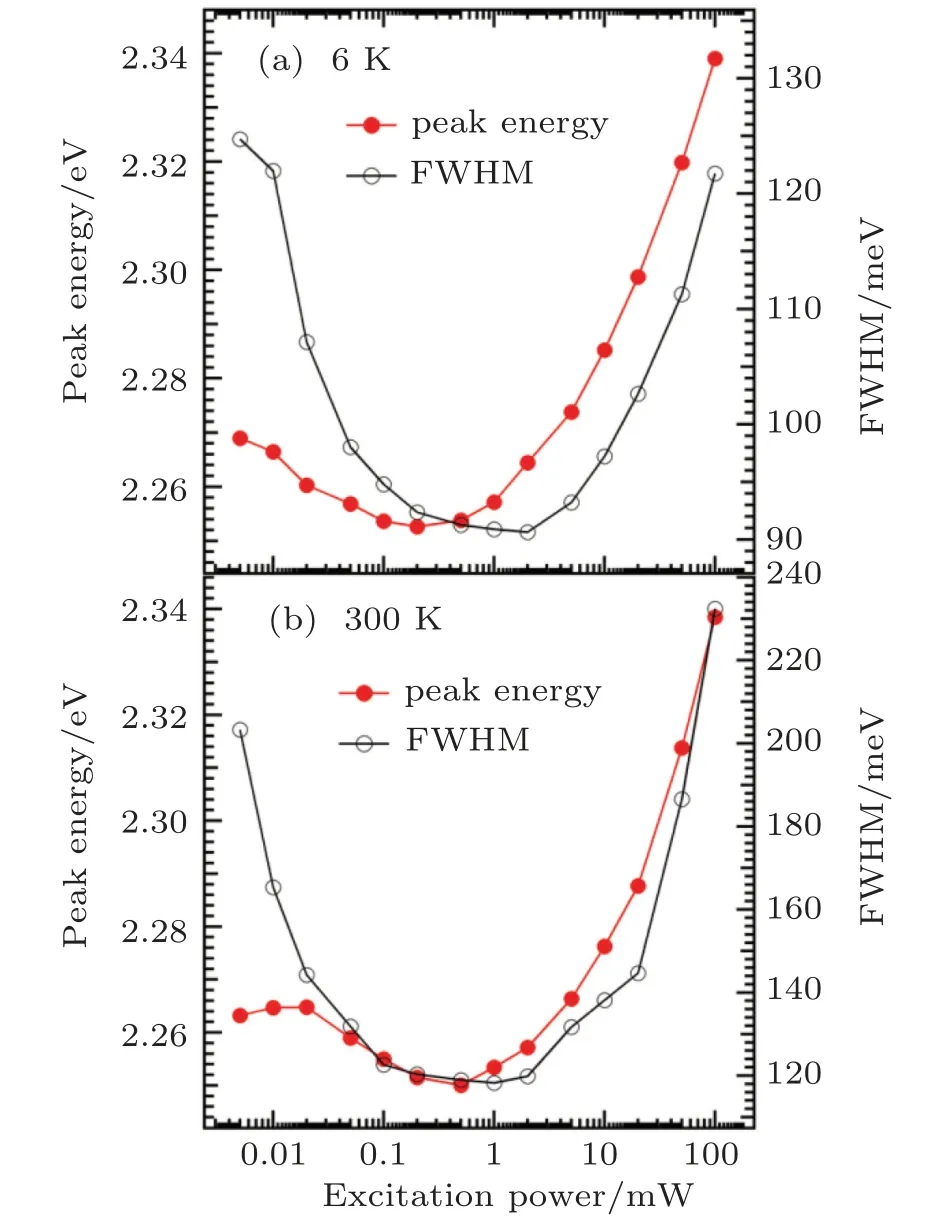
Fig.4.Dependence of PG peak energy and FWHM on excitation power at 6 K(a)and 300 K(b).
For assessing and comparing the strengths of QCSE in the two aforementioned MQWs,the excitation-power-dependent PL peak energy and line-widths shown in Figs.3 and 4,will be further analyzed. As discussed above for both MQWs in Figs.3 and 4,the dominant carrier recombination mechanism is excitation-power-dependent,and the carrier recombination process contains several possible mechanisms combining dominant and non-dominant positions,such as i)Coulomb screening of QCSE,ii)band filling for localized states,iii)carrier-scattering,and iv)defect-related non-radiative recombination,as mentioned above.Although the different recombination mechanisms result in the different excitation-powerdependent behaviors of the PL spectra,i.e.,the above mechanism i)(mechanism ii))results in a peak blue-shift(blue-shift)together with the line-width narrowing(broadening),and the above mechanism iii)(mechanism iv))results in a peak redshift(red-shift)together with the line-width narrowing(broadening),the strengths of QCSE of these two MQWs can be compared with each other based on the experimental fact that when the excitation power is increased from 0.005 mW to 100 mW,the total blue-shift(narrowing)of peak position(line-width)is about 70 meV(3.0 meV)for the PGemission,and 37 meV(−10.3 meV)for the PBemission at 6 K,and is about 75 meV(−29.1 meV)for the PGemission and 37 meV(−49.5 meV)for the PBemission at 300 K.That is,the total blue-shift(narrowing)of peak positions(line-width)for the PGemission is more significant than that for the PBemission in the range of excitation powers evaluated at both 6 K and 300 K.The results show that the GMQW has a stronger QCSE than the BMQW.
Figure 5(a)shows integrated PL intensity(I)varying with excitation power(P)for PBemission and PGemission at 300 K.Usually,the relationship between I and P is expressed as[8,9]

where parameter F mirrors the diverse processes involved in the recombination from a physical perspective.As shown in Fig.5(a),F has a higher value(2.22)for PGemission than that(1.66)for the PBemission,indicating that the GMQW has more non-radiative recombination centers than the BMQW due to fact that the higher the In content,the higher the dislocation density induced in the InGaN layers will be.[8,9]

Fig.5.Integrated PL intensities(a)and internal quantum efficiencies(b)for the BMQW and the GMQW(shown as functions of excitation power).
Figure 5(b)shows the excitation-power-dependent IQE of the BMQW and GMQW.IQE is defined here as the ratio of integrated PL intensity at 300 K to that at 6 K.[9,23]As shown in Fig.5(b),IQE for the BMQW and GMQW gradually increase as the excitation power is increased from 0.005 mW to 100 mW.This behavior is attributed to the fact that at 300 K,when the excitation power increases,non-radiative recombination gradually weakens but radiative recombination gradually increases because the non-radiative centers gradually become saturated.This leads the IQE to gradually increase for both the BMQW and the GMQW.In addition,as shown in Fig.5(b),the GMQW demonstrates lower IQE within the selected measurement range than the BMQW.This can be mainly attributed to the more non-radiative centers in the GMQW than in the BMQW,due to the marked deterioration of the crystalline quality of the GMQW with higher indium content.
4.Conclusions
In this work,an InGaN/GaN MQW sample containing two active regions,BMQW and GMQW(the latter is deposited on the former),is grown. In addition,the PL spectra of the sample are studied at excitation powers in a range between 0.005 mW and 100 mW and temperatures ranging from 6 K to 300 K.It is found that the peak energy of PGemission demonstrates stronger dependence in an“S-shape”on temperature than that of PBemission,and an excitationpower-dependent carrier-scattering effect is observed only in the PGemission;when the excitation power is increased from 0.005 mW to 100 mW separately at 6 K and 300 K,the total blue-shift(narrowing)of peak position(line-width)for the PGemission is more significant than that for PBemission;the GMQW has a lower IQE than the BMQW.All of these results can be attributed to the fact that the GMQW has higher indium content than the BMQW,and the higher indium content in the GMQW induces a more significant compositional fluctuation and localized character of the carrier recombination,a stronger QCSE,and more non-radiative centers.The reason why more indium elements are incorporated into the GMQW is considered mainly because the GMQW is grown at a lower temperature(725◦C).Additionally,the BMQW underlying layer,acting as a layer for strain release,also facilitates the incorporation of In into the GMQW and the In compositional fluctuation therein.
- Chinese Physics B的其它文章
- Compact finite difference schemes for the backward fractional Feynman–Kac equation with fractional substantial derivative*
- Exact solutions of a(2+1)-dimensional extended shallow water wave equation∗
- Lump-type solutions of a generalized Kadomtsev–Petviashvili equation in(3+1)-dimensions∗
- Time evolution of angular momentum coherent state derived by virtue of entangled state representation and a new binomial theorem∗
- Boundary states for entanglement robustness under dephasing and bit flip channels*
- Manipulating transition of a two-component Bose–Einstein condensate with a weak δ-shaped laser∗