
Assessment of internal controls for data normalization of gene expression after diff erent bacterial stimulation by quantitative real-time PCR in golden pompano Trachinotus blochii*
2020-03-19 12:31CHENXiaojuanZHANGXiaoqiSUNYunTUZhigangCAOZhenjieWANGShifengZHOUYongcan
CHEN Xiaojuan , ZHANG Xiaoqi , SUN Yun , TU Zhigang CAO Zhenjie WANG Shifeng ZHOU Yongcan
1 State Key Laboratory of Marine Resource Utilization in South China Sea, Hainan University, Haikou 570228, China
2 Hainan Academy of Ocean and Fisheries Sciences, Haikou 570228, China
Abstract Trachinotus blochii is one of the important commercial f ish species. In this study, we aim to conf irm the reliability reference genes in T. blochii during diff erent bacterial challenge through quantitative real-time PCR (qRT-PCR). The expression of the seven selected genes in four immune organs (i.e., spleen,kidney, intestine, and gill) stimulated with Vibrio harveyi, Edwardsiella tarda, and Streptococcus agalactiae were determined by qRT-PCR. The PCR data was analyzed using the geNorm and NormFinder algorithms.The results showed the selection of the internal controls should be tissue specif ic when studying gene expression in response to bacterial stimulation. After 48 h of stimulation with V. harveyi, geNorm ranked EF1A/Actin, 18S rRNA/B2M, UBCE/B2M, and 18S rRNA/B2M, as the most stably expressed genes in spleen, kidney, intestine, and gill, respectively. After 48 h of stimulation with E. tarda, geNorm ranked 18S rRNA/EF1A, 18S rRNA/B2M, B2M/RPL13, and 18S rRNA/EF1A, as the most stably expressed genes in spleen, kidney, intestine, and gill, respectively. After 48 h of stimulation with S. agalactiae, 18S rRNA/EF1A, 18S rRNA/B2M, B2M/Actin, and 18S rRNA/B2M were ranked as the most stably expressed genes in spleen, kidney, intestine, and gill, respectively. Compared to the results analyzed by geNorm, reference genes received similar rankings when using NormFinder software. The results showed that the reference genes appeared to be not only tissue specif ic, but also specif ic to the infecting species of bacteria. If one gene is preferred when T. blochii were infected by bacteria, 18S rRNA, B2M, B2M, 18S rRNA may be used in spleen, kidney, intestine, and gill, respectively.
Keyword: Trachinotus blochii; housekeeping gene; expression stability; reference gene
1 INTRODUCTION
During the last several years, quantitative real-time PCR (qRT-PCR) has been in widespread use for quantitation and detection of mRNA in all kinds of organisms (Sun and Hu, 2015). In comparison with traditional methods of RNA quantitation, qRT-PCR is substantially more sensitive, accurate, and accessible(Heid et al., 1996; Haller et al., 2004; Ransbotyn and Reusch, 2006; Yoo et al., 2009). However, some studies have reported that the selected housekeeping genes were not necessarily appropriate for the given experimental conditions when using qRT-PCR (Liu et al., 2005; Qiu et al., 2013). Many studies have also shown that the expression of housekeeping genes was aff ected by some external environmental factors(Infante et al., 2008; Zhong et al., 2008; Dang and Sun, 2011; Zheng and Sun, 2011; Li et al., 2016),indicating that the housekeeping gene is not truly stable. Therefore, the selection and normalization of the most appropriate housekeeping genes under diff erent environmental conditions are very important(Selvey et al., 2001; Huggett et al., 2005).
The golden pompanoTrachinotusblochii(Lacépède) was misapplied toTrachinotusovatus,which is an Indo-Pacif ic species distributed from north to southern Japan and south to Australia (Liu et al., 2014). In China,T.blochiiis one of the important commercial species. With the expansion of aquaculture industry, many bacterial diseases erupt,such asVibrioharveyi,Edwardsiellatarda, andStreptococcusagalactiae, which cause substantial economic losses (Sun et al., 2009; Amal et al., 2012;Fransiska et al., 2019). At present, to our knowledge,there is no research related to the normalization of housekeeping genes ofT.blochiiduring bacterial infection. In terms of qRT-PCR data analysis,geNorm, and NormFinder are typical algorithms(Vandesompele et al., 2002; Andersen et al., 2004).Specif ically, the geNorm is used to assess the expression stability measure (M) value and to rank the optimum pair of reference genes (Vandesompele et al., 2002). However, in order to measure the systematic error, the NormFinder is applied to estimate the expression variation of each gene(Andersen et al., 2004).
In this study, we utilized qRT-PCR to analyze the accurate housekeeping gene ofT.blochiifollowing challenged by diff erent bacterial diseasesV.harveyi,E.tarda, orS.agalactie, using both geNorm and NormFinder to analyze the data. Seven common housekeeping genes were selected in the present study, including beta actin (Actin), 18S ribosomal RNA (18S rRNA), β-2-Microglobulin (B2M),glyceraldehyde-3-phosphate dehydrogenase(GAPDH), ubiquitin-conjugating enzyme E2(UBCE), ribosomal protein L13 (RPL13), and elongation factor-1-α (EF1A). We identif ied and normalized the best internal genes after infecting juvenileT.blochiiwith each of the above pathogenic bacteria. These results will provide useful guidance for the selection of internal controls in future qRTPCR studies in this species.
2 MATERIAL AND METHOD
2.1 Experimental animal
Trachinotusblochii(45±2 g,n=60) were supplied by a commercial f ish farm in Sanya, Hainan Province,China. The f ish were maintained in oxygenated seawater at 26°C for two weeks to allow for acclimation to the new environment. Before initiating the experiments, f ish were randomly selected for an inspection to conf irm their health status (Wang et al.,2009). Tricaine methanesulfonate (Sigma, St. Louis,MO, USA) was used to anesthetize the f ish prior to tissue collection (Schoettger and Julin, 1967;Hattingh, 1977).
2.2 Pathogen strains and culture conditions
The pathogensV.harveyi,E.tarda, andS.agalactiae, were previously isolated from diseased f ish in Hainan Province. The isolated bacteria were cultured at 28°C in Luria-Bertani (LB) broth.
2.3 Bacteria challenge and tissue collection
The healthyT.blochiiwere randomly divided into four groups (A, B, C, and D), with 15 individuals per group. The pathogensV.harveyi,E.tarda, andS.agalactiaewere cultured in LB medium to an OD600≈0.8 and then re-suspended in phosphatebuff ered saline (PBS). Since the fact that diff erent bacteria have diff erent lethal dose and disease time,we used diff erent concentration of bacteria inoculum.Fish in the group A, B, and C was injected intraperitoneally with 100 μLV.harveyi(105CFU/mL),E.tarda(106CFU/mL) andS.agalactie(104CFU/mL), respectively. While f ish in the group D was injected intraperitoneally with 100 μL PBS as a control. After 48 h post challenge,f ive f ish were randomly selected from each of the four groups, respectively. Tissues (spleen, kidney,intestine, and gill) were collected under sterile conditions after euthanasia. The tissues were then f lash frozen in liquid nitrogen for preservation. The bacteria challenge experiment was repeated independently three times.
2.4 RNA extraction and cDNA library construction
Total RNA from the tissues samples (spleen,kidney, intestine, and gill; 30 mg per each) were extracted with the EZNA Total RNA Kit (Omega Bio-Tek, Doraville, GA, USA) and treated with RNasefree DNase I (Omega Bio-Tek, Doraville, GA, USA).The quality of the RNA was examined by determining 260/280 or 260/230 absorbance ratio using NanoDrop2000 (Thermo Scientif ic, USA) and gel electrophoresis. The f inal concentration of the extracted RNA was adjusted to 0.1 μ g/ μ L with nuclease-free water. After that, cDNA was synthesized with 1 μ g total RNA, random and Oligo (dT) primers,and the M-MLV reverse transcriptase (TaKaRa,Dalian, China) according to manufacturer’s instructions.

Table 1 The housekeeping genes used in this study

Table 2 Primer pairs used in this study and the amplif ication effi ciencies of PCR
2.5 Determination of PCR effi ciency
Seven housekeeping genes (Actin, 18S rRNA,B2M, GAPDH, UBCE, RPL13, and EF1A; Table 1)were selected to determine the most stably expressed genes ofT. blochiifollowing bacterial injection. The specif ic primer pairs used to amplify each candidate housekeeping gene are designed by the Primer Premier 5 software (Table 2) with the following parameters: 37-270 bp product, 50%-65% GC content, 58-62°C annealing temperature, and avoiding secondary structure. The specif ic of diff erent PCR primer pairs was conf irmed by the single band with appropriate size obtained after PCR amplif ication.There are three parallels for technical replicate comparison. The melting curve analysis was used to conf irm the amplif ication specif icity of each PCR.The amplif ication effi ciency (E) and correlation coeffi cient (R2) values were assessed according to the slopes of the standard curves obtained from the use of serial 10-fold dilutions of cDNA; while the calculated formula is:E(%)=(10-1/slope-1)×100 (Kubista et al., 2006).The acceptableEvalues range from 95% to 102%.
2.6 qRT-PCR and data analysis
Quantitative real-time PCR was used to analyze the stabiblity of housekeeping genes using the SYBR®Premix DimerEraser (Perfect Real Time) (TaKaRa,Dalian, China). The reaction was amplif ied in a total volume of 20 μ L mixture with three replications. The mixture contained 1 μ L cDNA, 0.2 μ L each of the forward and reverse primers (10 μ mol/L), 10 μ L SYBR Premix buff er, and 8.6 μ L PCR grade water.The cycling program was set with the following prof ile: 94° C for 2 min, followed by 40 cycles at 94° C for 15 s, 59° C for 15 s, and 72° C for 30 s. geNorm is used to calculate the gene expression stability measure(M) for a reference gene as the average pairwise variation (V) for that gene with all other tested reference genes; stepwise exclusion of the gene with the highest M value allows ranking of the tested genes according to their expression stability (Vandesompele et al., 2002). NormFinder utilizes a mathematical model of gene expression that enables estimation of the overall variation of the candidate normalization genes and the variation between sample subgroups of the sample set (Andersen et al., 2004).
3 RESULT
3.1 Quality of qRT-PCR amplif ication
TheEandR2values of the seven candidate reference genes ranged from 95% to 102%, and 0.993 to 0.999, respectively (Table 2).
3.2 The expression of housekeeping genes following stimulation with diff erent bacteria
After stimulation for 48 h with various bacteria,there were variations in the transcription levels of all the genes in various tissues (Table 3). In terms ofV.harveyistimulation, the least changes were observed with the 18S rRNA and UBCE in spleen,while all other genes, particularly GAPDH, exhibited a maximum Ct variation of 5.1. In kidney, the RPL13 was the only gene that showed less change. In intestine, except for the 18S rRNA and EF1A, all other genes had Ct variations greater than 1, with the highest Ct variation (4.3) exhibited by the RPL13. In gill, the GAPDH and B2M exhibited high Ct variations, 3.1 and 2.8, respectively. In terms ofE.tardastimulation, the RPL13 showed a maximum Ct variation of 7.3 in spleen (Table 3). There were slightly diff erence of Ct variation observed with the EF1A in kidney (3.8), the GAPDH in intestine (3.5),the Actin in kidney (3.4), the 18S rRNA in kidney(2.9), the B2M in kidney (2.8), and UBCE in kidney(2.0). In terms ofS.agalactiestimulation, the RPL13 showed a maximum Ct variation of 7.6 in spleen,following by the GAPDH, EF1A, B2M, 18S rRNA,Actin and UBCE with variations of 5.4 in intestine,5.1 in intestine, 4.9 in spleen, 4.8 in spleen, 4.7 in intestine and 4.4 in kidney, respectively (Table 3).
3.3 The suitability of housekeeping genes following bacterial stimulation
3.3.1 geNorm
The geNorm analysis indicated that theMvalues of all the genes in the four examined tissues after three bacteria stimulated varied from 0.01 to 1.68 (Figs.1-3). Apart from the GAPDH in spleen afterS.agalactiestimulated (Mvalue=1.68, Fig.3), theMvalues underthe other treatments were lower than the expression stability threshold (i.e., 1.5) proposed by geNorm.FollowingV.harveyistimulation, in spleen, theMvalue of the GAPDH was the highest (1.32), which was followed in decreasing order by those of 18S rRNA, UBCE, RPL13, B2M, EF1A, and Actin (Fig.1),with the last two genes (EF1A/Actin) being recognized as the most stable genes. In kidney, intestine, and gill,the minimumMvalue was observed in 18S rRNA/B2M, UBCE/B2M, and 18S rRNA/B2M, respectively(Fig.1). Similarly, in response toE.tardastimulation,18S rRNA/EF1A, 18S rRNA/B2M, B2M/RPL13 and 18S rRNA/EF1A were indicated the minimumMvalue in spleen, kidney, intestine, and gill, respectively.Therefore, these genes were determined to be the optimal housekeeping genes in these tissues (Fig.2).FollowingS.agalactiestimulation, 18S rRNA/EF1A,18S rRNA/B2M, B2M/Actin, and 18S rRNA/B2M were observed to have the minimumMvalues in spleen, kidney, intestine, and gill, respectively. Thus,these genes were the best target housekeeping genes in these tissues for analysis (Fig.3).
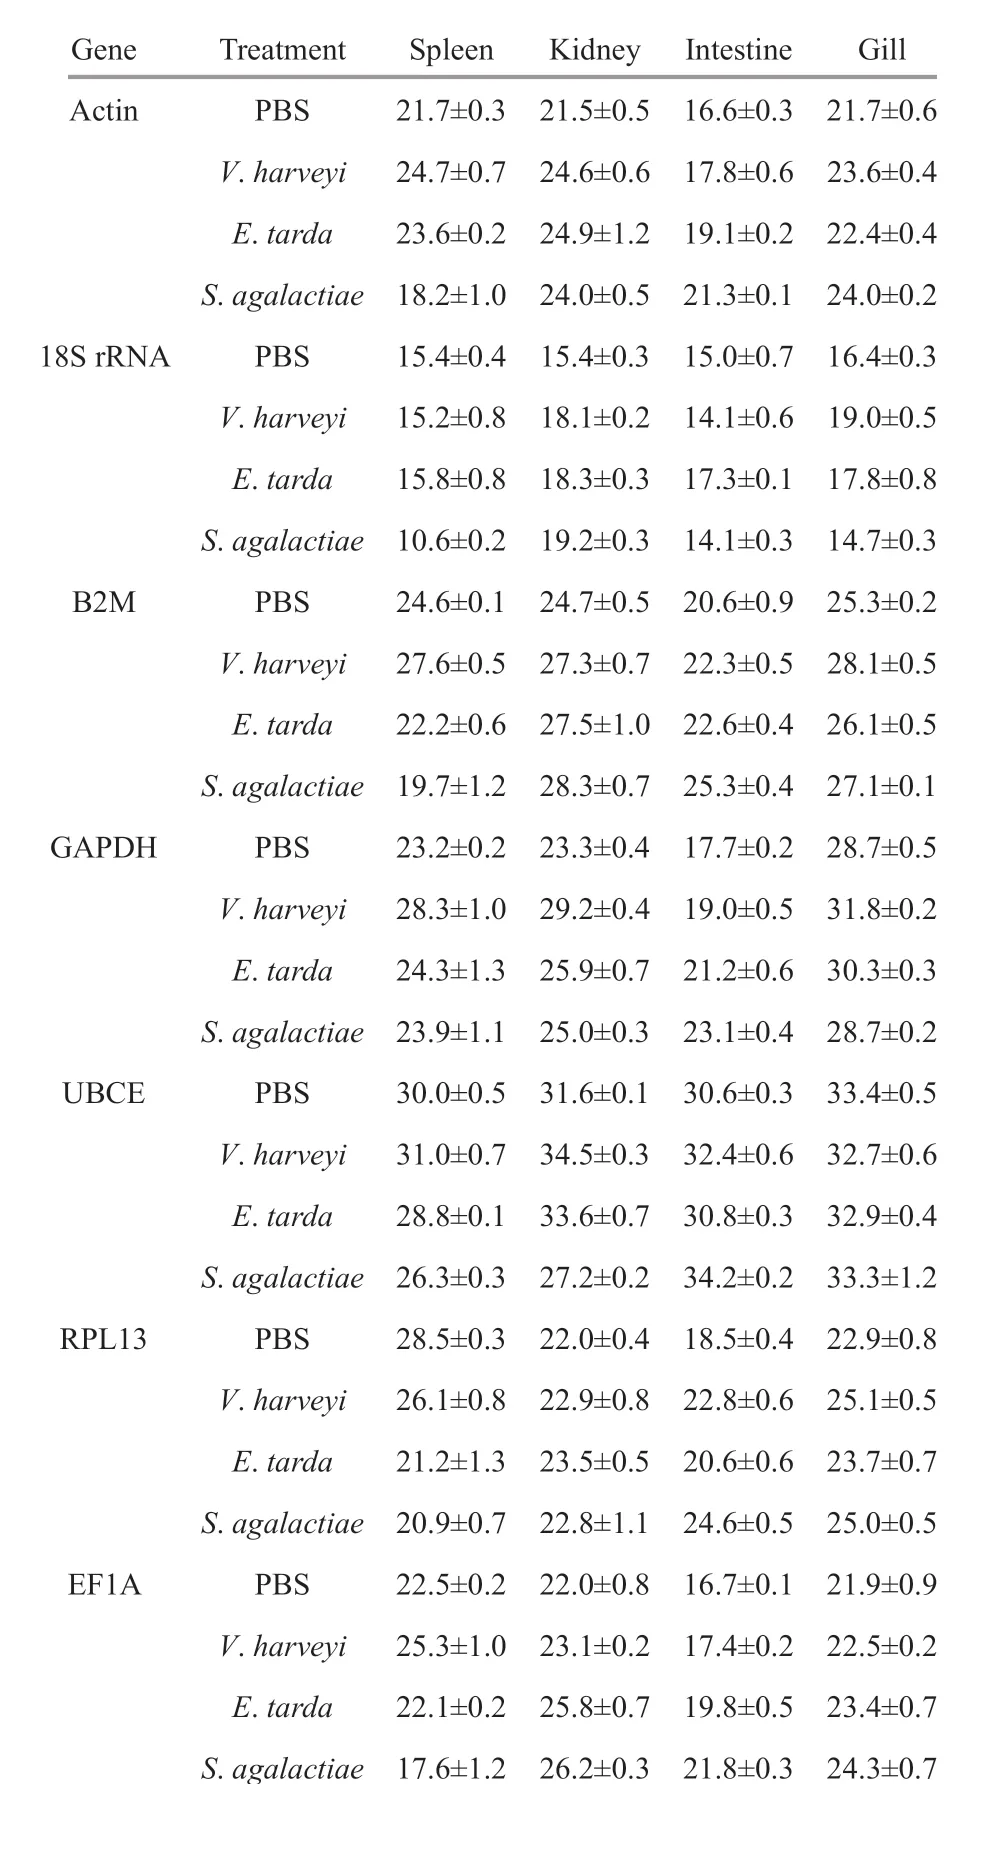
Table 3 Ct values of the housekeeping genes expressed in the tissues of bacterial challenged golden pompano at 48 h after the challenge

Fig.1 Expression stability of the housekeeping genes conf irmed by geNorm at 48 h post-infection by V. harveyi in T. blochii tissues

Fig.2 Expression stability of the housekeeping genes conf irmed by geNorm at 48 h post-infection by E. tarda in T. blochii tissues
The pairwise variation (V) between two sequential normalization factors containing a growing number of genes was assessed to determine the optimal number of genes required for data normalization. For expressions in four tissues followingV.harveyistimulation, all of the V2/3 values exhibited less than 0.15 (Fig.4) that indicating the third reference gene was not necessary included in each case. Similarly, in response toE.tardaandS.agalactiestimulation, the results of measurements on 48 h samples indicated that the V2/3 values were all lower than 0.15 of all the genes in the four tissues tested (Figs.5 & 6).Therefore, the target pairs V2/3 are considered the most reliable and eff ective housekeeping genes in these tissues.
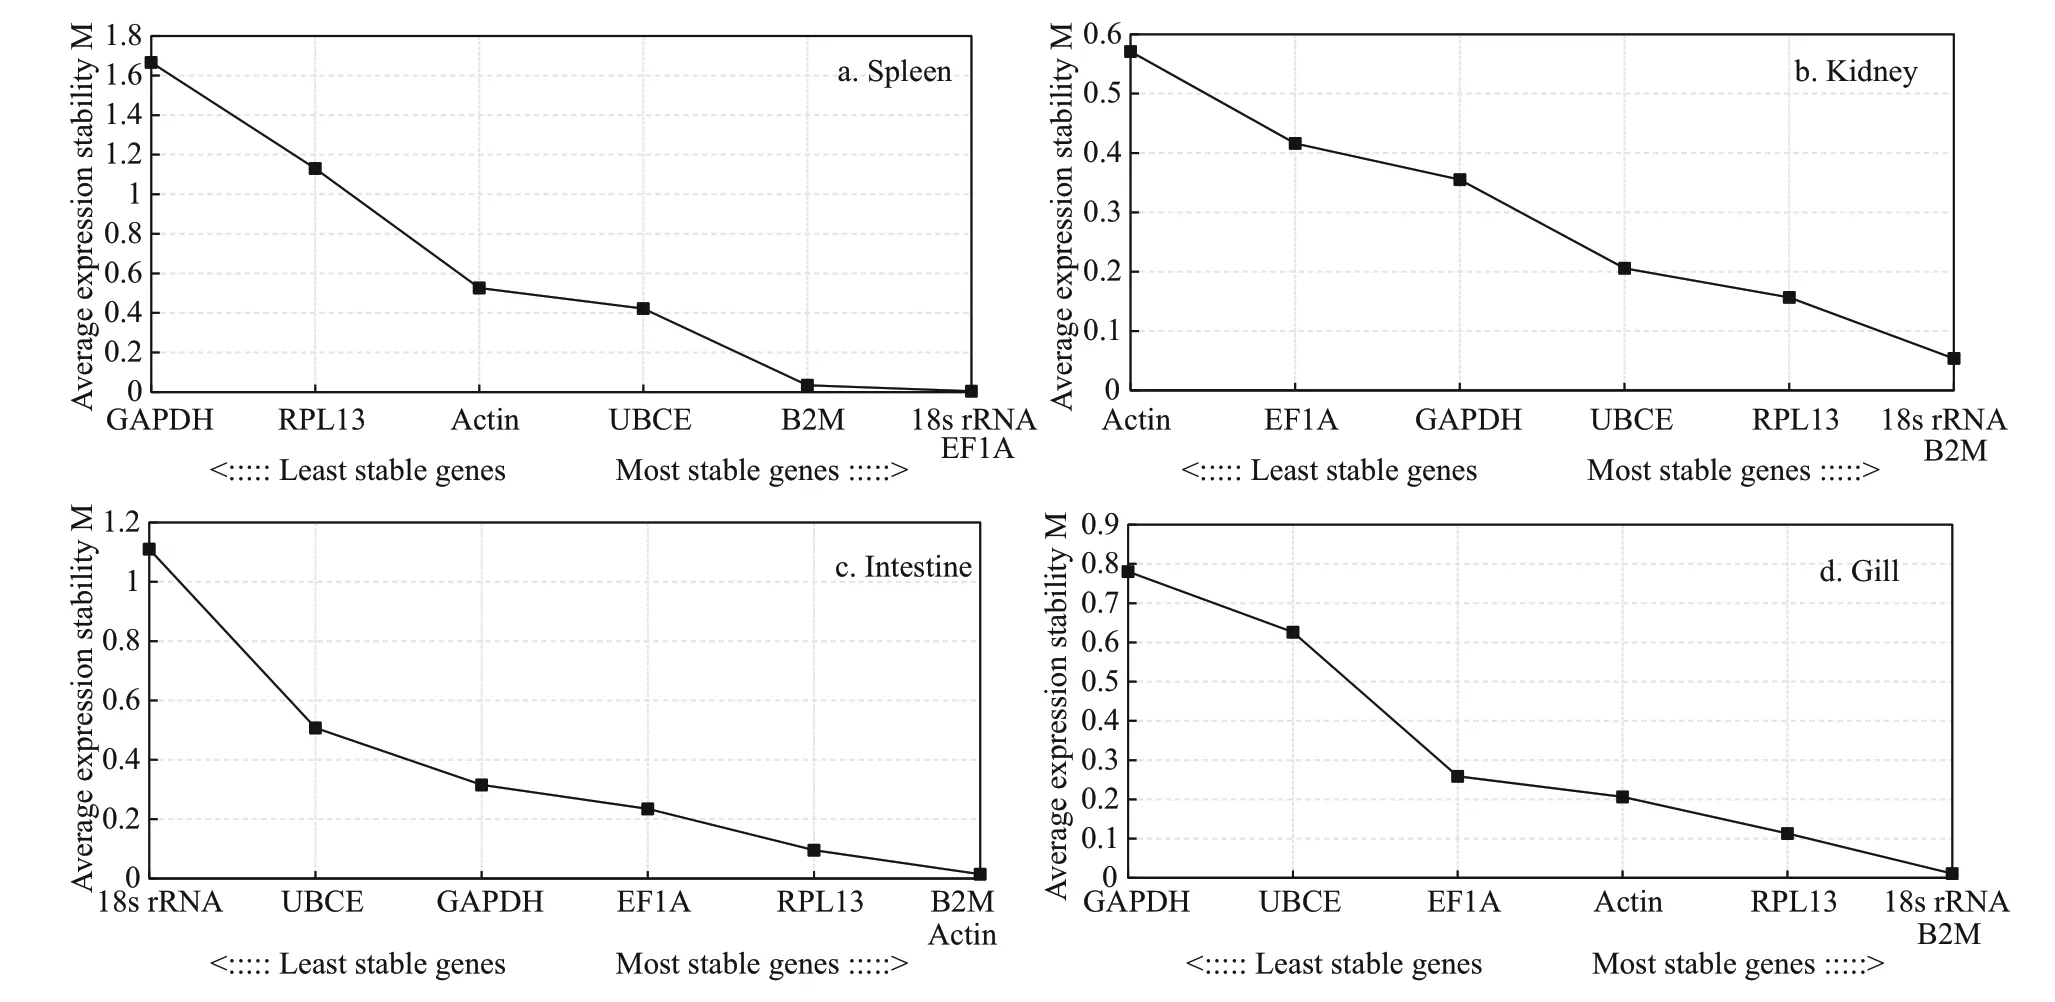
Fig.3 Expression stability of the housekeeping genes conf irmed by geNorm at 48 h post-infection by S. agalactiae in T. blochii tissues

Fig.4 Determination of the optimal number of reference genes by NormFinder for normalization after V. harveyi infection
3.3.2 NormFinder

Fig.5 Determination of the optimal number of reference genes by NormFinder for normalization after E. tarda infection

Fig.6 Determination of the optimal number of reference genes by NormFinder for normalization after S. agalactiae infection
The ranking orders produced by NormFinder for the expressions in spleen, kidney, intestine, and gill were mostly similar to those obtained by geNorm.NormFinder ranked the candidate reference genes by scores. Following stimulation withV.harveyi, the 18S rRNA/Actin (0.002) was identif ied as the most stable genes in spleen by NormFinder analysis,followed in order of decreasing stability by UBCE(0.041), B2M (0.232), EF1A (0.872), RPL13 (1.110),and GAPDH (1.574) (Table 4). The most stable genes in kidney, intestine, and gill afterV.harveyistimulated,ranked by NormFinder were 18S rRNA/B2M, UBCE/B2M, and 18S rRNA respectively. FollowingE.tardastimulation, the most stable genes in spleen, kidney,intestine, and gill were 18S rRNA/B2M, 18S rRNA/B2M, B2M/RPL13, and 18S rRNA respectively(Table 5). In response to stimulation withS.agalactie,the most stable genes in spleen, kidney, intestine, and gill were 18S rRNA, B2M, B2M/Actin, and 18S rRNA/B2M, respectively (Table 6).

Table 4 Ranking of the candidate reference genes generated by NormFinder for analyzing expression at 48-h V. harveyi infection

Table 5 Ranking of the candidate reference genes generated by NormFinder for analyzing expression at 48-h E. tarda infection

Table 6 Ranking of the candidate reference genes generated by NormFinder for analyzing expression at 48-h S. agalactiae infection
3.4 Data analysis summary
To normalize the most suitable housekeeping genes following challenged with diff erent bacteria, the geNorm and NormFinder algorithms were both applied. In summary, the results showed that the 18S rRNA was the best reference genes in spleen and gill following diff erent bacterial stimulation; while the B2M was the best reference genes in kidney and intestine (Table 7).
4 DISCUSSION
In other previous studies, NormFinder, bestKeeper and geNorm (Vandesompele et al., 2002; Andersen et al., 2004; Pfaffl et al., 2004) have been used in conjunction with qRT-PCR to determine the optimal genes to use as internal references when examining gene expression in cells and tissues of various taxon.A normalization factor generated by geNorm based on multiple internal controls can be used in the future qRT-PCR analysis, whereas NormFinder can be applied to select the optimal reference gene referring to the expression stability of the candidate genes(Andersen et al., 2004).
In this study, we selected seven commonly used reference genes, which have also been used in many other species as internal controls for qRT-PCR,including Actin, 18S rRNA, B2M, GAPDH, UBCE,RPL13, and EF1A (Zhong et al., 2008; Bower andJohnston, 2009; Dang and Sun, 2011; Sun and Hu 2015; Li et al., 2016). To normalize the most stable reference genes following challenged with diff erent bacteria inT.blochii, geNorm and NormFinder were utilized to analyze the data. In some previous studies,housekeeping genes were observed to follow a tissue-specif ic expression trend in red drum(Sciaenopsocellatus) and zebraf ish (Daniorerio)(McCurley and Callard, 2008; Sun and Hu, 2015).The other studies have reported that the most stable housekeeping gene varies with experimental conditions. For example, in diff erent tissues or at diff erent growth stages, the suitable internal reference genes do not remain the same (Filby and Tyler, 2007; Infante et al., 2008; Fernandes et al.,2008; Zhong et al., 2008; Bower and Johnston, 2009;Li et al., 2010; Øvergård et al., 2010; Løvoll et al.,2011; Dang and Sun, 2011; Zheng and Sun, 2011).For instance, in red drum during bacterial infection,RPS35, ACTB, EF1A, ND1, TUBB, EF1A, ACTB,and ACTB were analyzed and determined to be the ideal internal references in brain, gill, heart, intestine,kidney, liver, muscle, and spleen, respectively (Sun and Hu, 2015). geNorm identif ied the most suitable internal reference genes from diff erent genes. The most suitable internal reference genes were also analyzed by NormFinder.
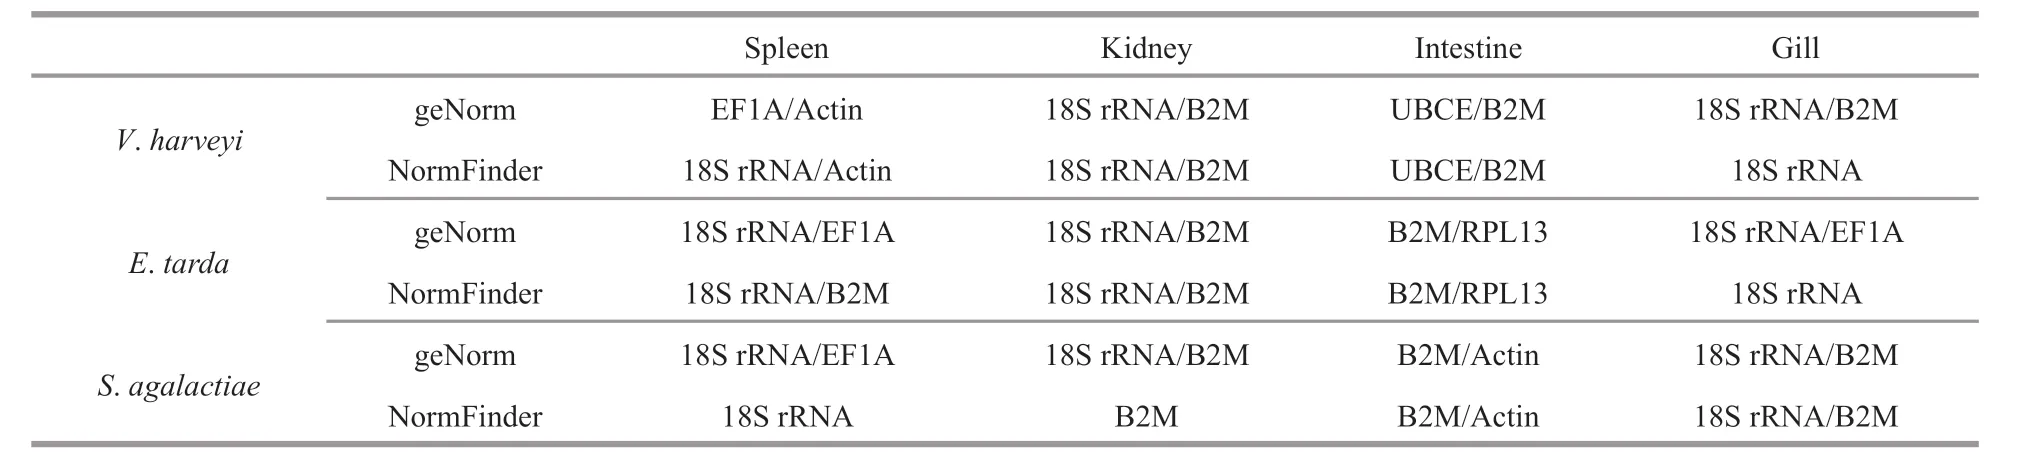
Table 7 Expression stability of the housekeeping genes in T. blochii tissues as determined by geNorm and NormFinder
5 CONCLUSION
To improve the accuracy of evaluation in this study,we normalized the optimal reference genes ofT.blochiiat 48 hpi with diff erent bacteria using geNorm and NormFinder. When studyingT.blochiigene expression after being stimulated by diff erent bacteria, the most stable internal controls should be selected for each tissue being tested. Following bacterial challenge, the most stable genes identif ied by geNorm and NormFinder were 18S rRNA, B2M,B2M, and 18S rRNA, for reference in spleen, kidney,intestine, and gill ofT.blochii, respectively.
6 DATA AVAILABILITY STATEMENT
The authors declare that all data supporting the f indings of this study are available within the article.
 Journal of Oceanology and Limnology2020年2期
- Journal of Oceanology and Limnology的其它文章
- Contribution of surface wave-induced vertical mixing to heat content in global upper ocean*
- Upper ocean response to typhoon Kujira (2015) in the South China Sea by multiple means of observation*
- Inf luence of simulating deep-sea environmental factors on cathodic performance of seawater battery*
- Adsorption characteristics of chitooligosaccharides onto activated charcoal in aqueous solutions*
- Eff ects of hypoxia on survival, behavior, and metabolism of Zhikong scallop Chlamys farreri Jones et Preston 1904*
- Distinct inf luence of trimethylamine N-oxide and high hydrostatic pressure on community structure and culturable deep-sea bacteria*