
Glacier changes in the Qaidam Basin from 1977 to 2018
2020-03-29 08:06SuGangZhouXiaoJunYaoYuanZhangDaHongZhangJuanLiuHongYuDuan
SuGang Zhou,XiaoJun Yao,Yuan Zhang,DaHong Zhang,Juan Liu,HongYu Duan
College of Geography and Environmental Science,Northwest Normal University,Lanzhou,Gansu 730070,China
ABSTRACT Based on Landsat MSS/TM/OLI remote sensing images, glaciers vector data in the Qaidam Basin were extracted for 1977, 2002, and 2018, and their spatial-temporal variations were analyzed. Results show that there were 2,050 glaciers covering an area of 1,693.54±40.96 km2 and having an ice volume of 108.65±2.43 km3 in the Qaidam Basin in 2018.Gla‐ciers with areas <1.0 km2 accounted for the largest number, while glaciers with areas of 1.0−5.0 km2 accounted for the most glacierized area. In the past 50 years, the number of glaciers decreased by 177, and the glacier area and volume re‐duced by 338.08 km2 (−8.12 km2/a) and 19.92 km3 (−0.48 km3/a), respectively. Retreat altitudes of glaciers were concen‐trated at 4,900−5,600 m, 4,700−5,200 m, and 5,000−5,600 m and reduced areas accounted for 95.53%, 77.80%, and 69.19% in the Kunlun, Qilian, and Altun mountains, respectively. The area of north-oriented glaciers decreased the most(−125.43 km2), but the west- and east-oriented glaciers retreated at the fastest rate (i.e., −27.11% and −27.10%).All gla‐ciers showed a decreasing trend in sub-regions of the Qaidam Basin from 1977 to 2018.The decreasing trend was acceler‐ated gradually from northwest to southeast in the northern part of the basin, while glacier change was the smallest in the middle section and gradually accelerated towards both ends of the basin's southern part.The temperature had continued to rise, and the precipitation had increased slowly in the Qaidam Basin during the past 50 years. The continuous rise in air temperature was the main reason for the retreat of glaciers.
Keywords:glacier change;climate change;Landsat;Qaidam Basin
1 Introduction
Glaciers are an important component of the cryo‐sphere and a solid reservoir of freshwater resources(Shi and Liu, 2000; Immerzeelet al., 2010). Glacier change is closely related to regional climate and is re‐garded as a natural indicator of climate change (Shi and Liu, 2000; Liuet al., 2015). Since the 1980s, gla‐ciers in China had been generally in a mass deficit state, showing a trend of shrinking and thinning (Yao,2010).According to the First and Second Chinese Gla‐cier Inventory, the glacier area decreased by 17.7%,and the ice volume loss was about 20% (Liuet al.,2015).Under global warming,the shrinking of glaciers not only has a major impact on global and regional cli‐mate, ecosystems, water resources changes, sea level rise,and human production and life(Qiu,2008;Piaoet al., 2010), but also exacerbates the frequency and im‐pact range of disasters such as glacier avalanches, gla‐cial lake outburst floods, or debris flows (Yaoet al.,2014; Yaoet al., 2019). Therefore, understanding the interrelationships among glacier and climate change,water resources, and human activities, and clarifying glacial change trends has vital scientific value and prac‐tical significance for studying global change and sus‐tainable development(Yaoet al.,2019).
At present, the studies of China's glacier changes are mainly concentrated in the Himalayas (Liet al.,2011), Tienshan Mountains (Sunet al., 2012), Qilian Mountains (Sunet al., 2018), Nyainqentanglha Range(Shangguanet al., 2008), Tanggula Mountain (Duanet al., 2019), Karakoram Mountains (Kääbet al., 2015),and Gangdisê Mountains (Liuet al., 2020). As the third pole of the world,the Tibetan Plateau has the larg‐est distribution of modern glaciers and Quaternary gla‐ciers in low and middle latitudes in terms of area(Puet al., 2004). Existing studies have shown that the gla‐ciers present a rapid retreat trend in the Tibetan Plateau and other surrounding areas (Puet al., 2004; Qiu,2008; Yaoet al., 2019), except for the Karakoram Range (Gardelleet al., 2013). The regional differences of glacier retreat are large. The glaciers developed in the inner areas such as the Qiangtang Plateau had the smallest extent of retreat, whereas the glaciers devel‐oped in the marginal areas such as southeastern Tibet and the Himalayas had the largest size of glacier re‐treat. The extent of retreat gradually decreased from the edge of the plateau to the inner area,indicating that the glaciers in the plateau marginal area are more sensi‐tive to climate change than those inside (Yao, 2010;Yaoet al.,2012;Ye,2016;Ye,2017).
The Qaidam Basin is located in the northeastern Tibetan Plateau and northwestern arid regions, where glaciers and their melting water are essential resourc‐es having a vital impact on the fragile ecological envi‐ronment and sustainable development of society and economy (Zhanget al., 2012). Few studies exist on glaciers in the Qaidam Basin and mainly focus on to‐pography conditions, spatial distribution, changes and water resources of glaciers. For example, Guan(1960) firstly studied the development and distribu‐tion of glacial topography, glacial-related sediment,and modern glaciers of various mountain systems around the Qaidam Basin.Yanget al.(1980)analyzed the contemporary glaciers' distribution based on Gla‐cier Inventory data in the Qaidam Basin. Su (1995)studied the glacier water resources in this basin and suggested rational use of glacier water resources. Lu(2015) adopted moderate-resolution imaging spectro‐radiometer (MODIS) data products to analyze the changes of glaciers in the Qaidam Basin from 2001 to 2012, and the results revealed an increasing trend in the area of glaciers. Other scholars have conducted studies on some glaciers in the Qilian Mountains (Sunet al., 2018),Altun Mountains (Zhuet al., 2013), and Kunlun Mountains (Jianget al., 2019). However, the Qaidam Basin is an intergal natural unit, studies on parts of the entire region do not reflect the overall characteristics of glacier change in the entire basin.Due to the differences in the data sources and meth‐ods adopted, the results mentioned above varied con‐siderably and sometimes are even contradictory.Therefore, cognition on the latest glacier changes in the whole basin is much needed. Additionally, study‐ing glaciers' changes in the Qaidam Basin is of great significance for building ecological security barrier,regional economic development, and ensuring water resources security. This study uses the Landsat MSS/TM/OLI remote sensing images from 1977 to 2018 to analyze the spatial distribution and characteristics of glacier change in the Qaidam Basin for the past 50 years. The results provide a scientific basis for a comprehensive understanding of glaciers change and rational utilization of regional water resources under the background of climate warming.
2 Study area
The Qaidam Basin (34°41′N−39°20′N, 87°49′E−101°11′E), a closed inland basin located in the north‐eastern Tibetan Plateau and surrounded by the Qilian Mountains,Altun Mountains, and Kunlun Mountains,covers part of Qinghai Province, Gansu Province, and Xinjiang Uygur Autonomous Region (Figure 1). The basin stretches approximately 1,000 km from east to west, 400 km from north to south, with an area of about 32.95×10⁴km2, and an elevation of between 2,391 m and 6,826 m, or an average of 4,165 m. The highest peak is the Bukatage Peak (also known as Xinqing Peak or Monomaha Peak,6,860 m).The Qa‐idam Basin is situated at the junction of the mid-lati‐tude westerly belt and the East Asian monsoon. It has a typical plateau continental climate,with an aver‐age annual temperature of 3.5 °C, sufficient sunlight,strong evaporation,and an annual precipitation of 15−200 mm decreasing from east to west.The ground sur‐face is characterized by alpine meadowsl, desert mead‐ows, gray brown and brown calcium soils.The vegeta‐tion is predominantly composed of shrubs,semi-shrubs and herbs with drought resistance, with obvious verti‐cal differentiation.The Qaidam Basin is recognized as a "treasure bowl" for possessing abundant salt lakes,oil and gas,coal,and various metal resources.
In the Chinese Glacier Inventory (Shi, 2005), the Qaidam Inland Basins (5Y5) is a sub-area of the East Asian Inland Basins (5Y).According to the main lake groups and the river systems,this basin is divided into nine sub-basins: Qinghai Lake Basin (5Y51), Qaidam River Basin(5Y52),Golmud River Basin(5Y53),Tai‐jnar River Basin (5Y54), Gaskul Lake Basin (5Y55),Hartang River Basin (5Y56), Har Lake Basin (5Y57),Yuka-Tatalin Gol Basin (5Y58), and Bayan Gol River Basin(5Y59).
3 Methods and data
3.1 Data sources
The remote sensing images used in this study are Landsat MSS/TM/OLI data, which were downloaded from the USGS website (https://earthexplorer. usgs.gov).The data had been corrected by radiation and ge‐ometry correction processing, and terrain correction based on a digital elevation model (DEM) data (L1T).The spatial resolution of OLI images was improved from 30 m to 15 m with a panchromatic band (15 m).To reduce the error of glacier changes in different pe‐riods and the impact of snow and clouds on the extrac‐tion of the glacier boundary, the best-quality images from June to September were chosen whenever possi‐ble in the study area. And images in three periods of 1972−1978,1996−2002,and 2015−2019 were select‐ed. In total, there are 19 Landsat MSS images in 1972 −1978, 37 Landsat TM images in 1996 −2002,and 26 Landsat OLI images in 2015 −2019, respec‐tively (Table 1). The years with the largest glacier ar‐eas,i.e., 1977, 2002 and 2018, were selected as the representative years of the three periods. The image quality of some regions from June to September in 1977 was poor, so images with good quality in other months were selected to extract the glacier boundary.
The DEM data (ASTER GDEM) obtained from the Geospatial Data Cloud Platform (http://www.gs‐cloud.cn) of the Computer Network Information Cen‐ter of the Chinese Academy of Sciences was used to extract glacier elevation information. The temperature and precipitation data on 0.5°×0.5° gridded dataset(V2.0) were downloaded from the National Meteoro‐logical Science Data Center(http://data.cma.cn).
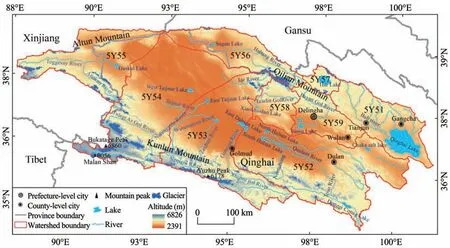
Figure 1 The distribution of glaciers in the Qaidam Basin
3.2 Methods
At present, there are many methods for glacier boundary extraction, including supervised/unsuper‐vised classification, ratio threshold method, normal‐ized snow cover index method and ratio threshold method combined with visual interpretation, and so on (Zhang and Liu, 2001; Yaoet al., 2012; He and Yang, 2014). To ensure the high-quality, the glacier extraction method adopted by the Second Chinese Glacier Inventory was used to delineate the glacier boundaries in this study.First,the band ratio was used to distinguish ice and snow from other features to quickly extract the glacier boundaries of the bare ice area. Then, the glacier boundaries were manually re‐vised in referrence to the Google Earth software with three-dimensional rendering and high-resolution imag‐es. The boundaries of debris-covered glaciers can be extracted manually based on image color and texture features, distribution of supraglacial lakes, hydrologi‐cal features of the glacier ends, and topographic and hydrological features of the glacier sides.A single gla‐cier boundary was obtained using the ridge line (wa‐tershed) of the glacier area, which was extracted by the hydrological analysis tool of GIS software(Guoet al.,2015).The sources of glacier delineation errors in‐clude those from the remote sensing sensors, image registration process (Huggelet al., 2003), and pixel shift errors of visual judgment in manual interpreta‐tion (Yao, 2010; Sunet al., 2018). In this study, we only considered the error from the spatial resolution of the remote sensing images,which can be calculated by the following formula:

whereεis the area error(m2)caused by the image res‐olution,Nis the circumference of the glacier outline(m), andAis the side length of a single pixel (i.e.,60 m, 30 m, 15 m for Landsat MSS/TM/OLI images,respectively).
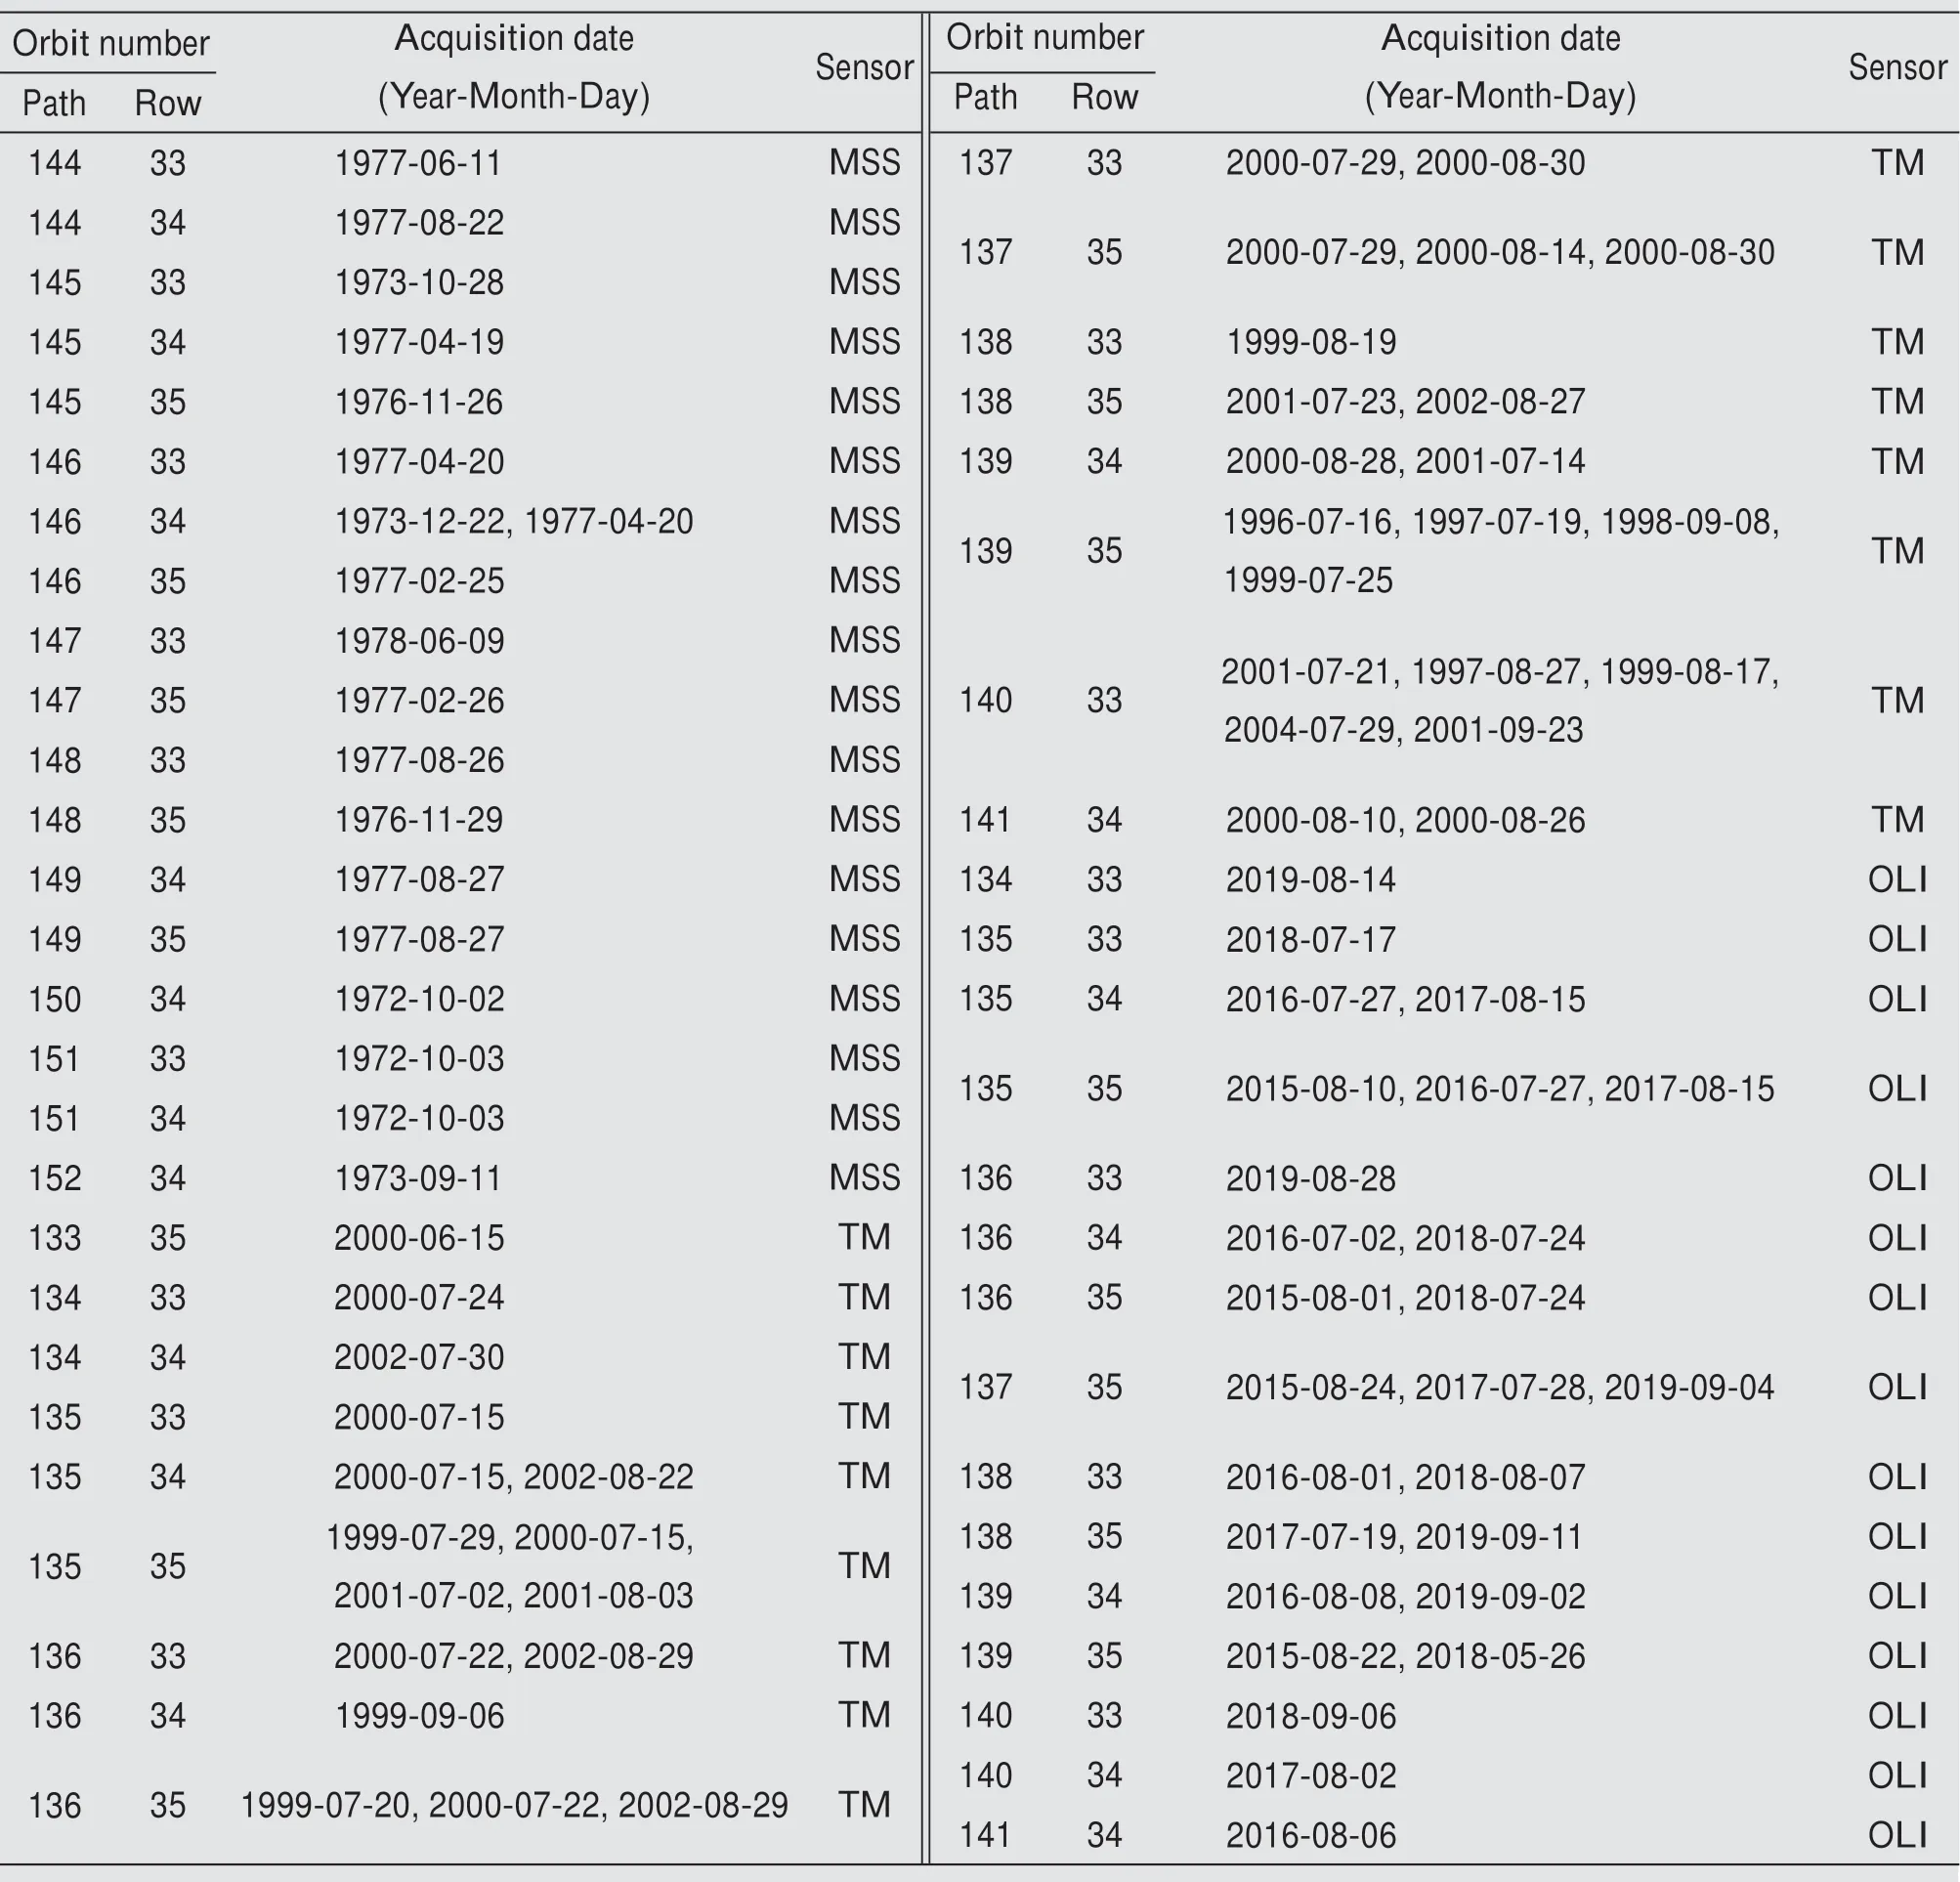
Table 1 Landsat images used for glacier interpretation of the Qaidam Basin from 1977 to 2018
The glacier area change is the difference between the glacier areas in two phases.Due to the time differ‐ence of the image data used in each phase, the change rate and relative change rate of the glacier area pro‐posed by Sunet al. (2018) were used to compare the glacier area changes.
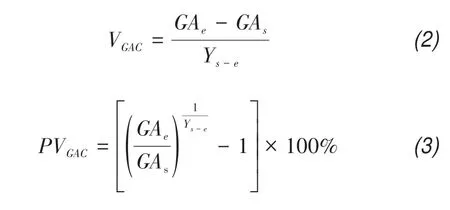
whereVGACis the rate of change in glacier area(km2/a),andPVGACis the relative rate of change of glaciers ar‐ea (%/a).Ys−eis the time interval (years) of the data sources;GAsandGAeare the glacier areas in the start and end phases(km2),respectively.AiandYiare the ar‐ea and year of theith glacier in the end phase in one basin, whileAjandYjare the area and year of thejth glacier in the start phase in the same basin.mandnare the total number of glaciers at the end and start phases,respectively.
Ice volume is an essential parameter for modelling hydrology, change and disasters of glaciers (Hallet al., 2003). Generally, the ice volume is calculated us‐ing the area-volume empirical formula (Gartner-Roeret al.,2014):
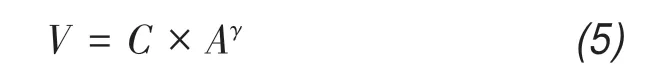
whereVis the glacier ice volume (km3);Ais the gla‐cier area (km2);Candγare the empirical coefficients.In this study, the values for empirical coefficientsCandγproposed by Radić and Hock (2010), Grinsted(2013) and Liuet al. (2003) were used to evaluate the glacier ice volumes in the Qaidam Basin. In this pa‐per, we first calculate the differences between the maximum, minimum, and mean of the results of the three methods,use the mean of the two differences ob‐tained as the ice volume error.
4 Results analysis
4.1 Contemporary status of glaciers in the Qaidam Basin
In 2015−2019, there were 2,050 glaciers with a to‐tal area of 1,693.54±40.96 km2and an ice volume of 108.65±2.43 km3in the Qaidam Basin. As shown in Figure 2, glaciers with areas <1.0 km2accounted for the largest number of glaciers, while glaciers with ar‐eas of 1.0−5.0 km2accounted for the most glacierized area. Specifically, 1,669 glaciers with areas <1.0 km2accounted for 81.4% of the total number of glaciers in the basin.The number of glaciers with increasing sizes rapidly decreased. There were only three glaciers with areas >20 km2,i.e., Monomaha Glacier (5Y542H0034,82.02 km2), Foot Glacier (5Y542H0023, 22.72 km2),and an unnamed glacier (5Y542H0030, 21.13 km2).Glaciers with areas between 2.0 km2and 5.0 km2ac‐counted for the largest area (386.97 km2), followed by glaciers between 1.0 km2and 2.0 km2(288.71 km2),and then those between 5.0 km2and 10.0 km2(278.37 km2).The area of glaciers in the three classes mentioned above accounted for 56.33% of the total glacierized area in the basin. Although there were numerous gla‐ciers with areas <0.1 km2, their total area was only 30.28 km2,or 1.79%of the total glacier area.
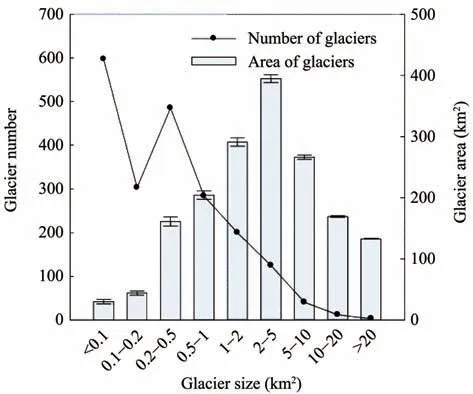
Figure 2 Number and area of glaciers of different sizes in the Qaidam Basin in 2018
Glaciers in the Qaidam Basin are distributed in the Eastern Kunlun Mountains, the northwestern Qil‐ian Mountains and the Altun Mountains (Table 2).The Kunlun Mountains have the highest concentra‐tion of glaciers, with the largest glacier number, area,and ice volume. The Qilian Mountains are a distant second, with their glacier number, area, and ice vol‐ume less than half of the Kunlun Mountains. The gla‐cier number, area, and ice volume in the Kunlun and Qilian Mountains account for 96.12%, 97.33%, and 98.00% of the corresponding total in the Qaidam Ba‐sin, respectively. The Altun Mountains have the least glaciers.

Table 2 Glacier resources of various mountain systems in the Qaidam Basin
As described in Section 2, the Qaidam Inland Ba‐sins (5Y5) belongs to the East Asian Inland Basins(5Y).According to the basin's watershed area, it is di‐vided into nine third-level and 31 fourth-level drain‐age basins (Table 3). Among these drainage basins,the Taijnar River Basin (5Y54) has the largest glacier area and ice volume, followed by the Golmud River Basin (5Y53) and Gaskul Lake Basin (5Y55). Note that the area and ice volume in the former are larger than the latter but the glacier number in the former is slightly less than that in the latter.The Bayan Gol Riv‐er Basin (5Y59) and the Qinghai Lake Basin (5Y51)have the fewest glaciers,and their glacier numbers,ar‐ea, and ice volume only account for 1.66%, 0.63%,and 0.35% of the corresponding total in the Qaidam Inland Basins.
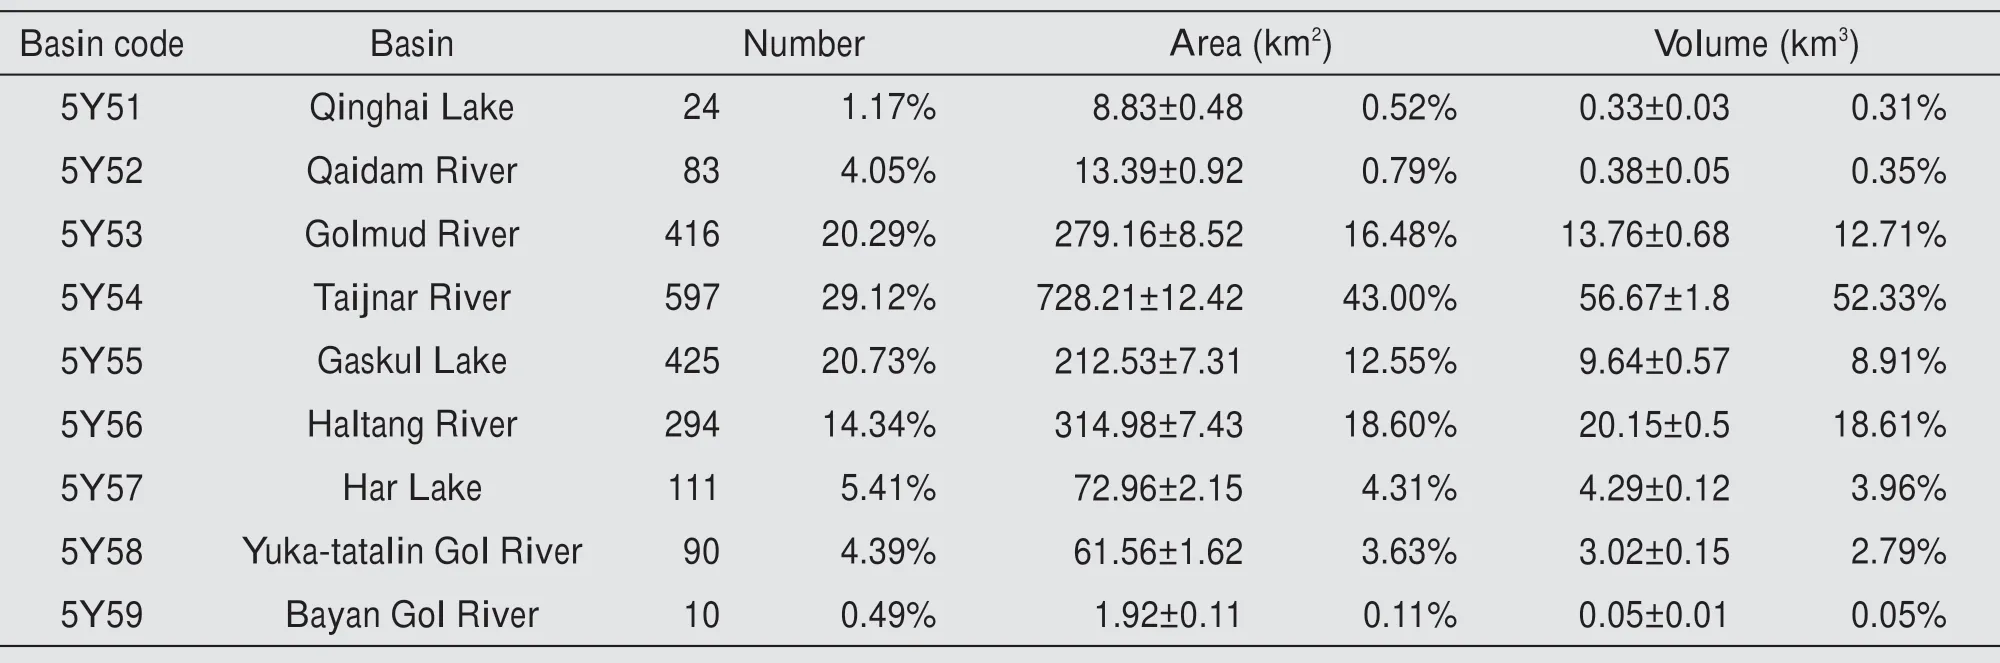
Table 3 Glacier statistics in different basins in the Qaidam Basin
In terms of administrative divisions, glaciers in the Qaidam Basin are located within Jiuquan City in Gansu Province, the autonomous prefectures of Haixi and Yushu in Qinghai Province, and Bayan Gol Au‐tonomous Prefecture in Xinjiang Uygur Autonomous Region (Table 4). About two-thirds of glaciers in the Qaidam Basin are located in Qinghai Province, with a total number of 1,406. The glacier area and ice vol‐ume are 1,267.48±28.11 km2and 85.52±3.64 km3, ac‐counting for 74.84% and 78.97% of the correspond‐ing total, respectively, in the Qaidam Basin. Gansu Province has the least glaciers. In terms of municipal administrative regions, the number, area, and ice vol‐ume of glaciers in Haixi are the largest. Although Yushu has the fewest glaciers, its glacier area and ice volume are second only to Haixi. Jiuquan has fewer glaciers than Bayan Gol Autonomous prefecture.However, its glacier area and ice volume are slightly higher than those of Bayan Gol Autonomous prefec‐ture.Bayan Gol Autonomous prefecture has the small‐est glacier area and ice volume, even though it has more glaciers than Jiuquan and Yushu.
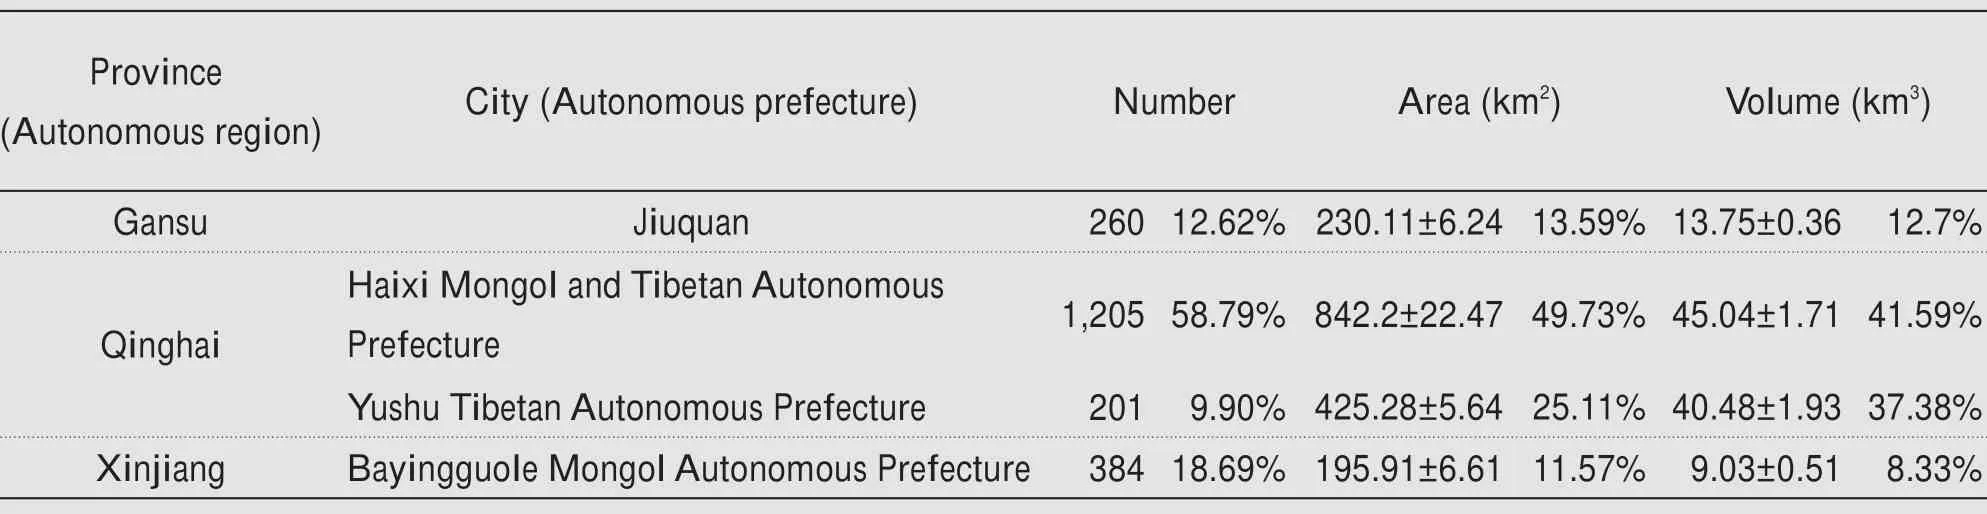
Table 4 Glacier statistics in administrative divisions in the Qaidam Basin
4.2 Glacier changes in the Qaidam Basin from 1977 to 2018
4.2.1 Changes in glacier area, number, and ice volume
In 1977, there were 2,148 glaciers in the Qaidam Basin, with an area of 2,031.62±163.47 km2and an ice volume of approximately 128.58±2.96 km3. In 2002, the glacier numbe decreased to 2,094, the area to 1,862.68±86.07 km2,and the ice volume to approxi‐mately 117.97±2.73 km3.From 1977 to 2018,177 gla‐ciers with a total area of 21.25 km2disappeared, and 68 glaciers split into 146 smaller ones with the total area decreased from 122.76 km2to 99.80 km2. In the past 50 years, the area of glaciers in the Qaidam Ba‐sin has decreased by 338.08 km2(−8.12 km2/a, or−0.44%/a) and the ice volume loss was 19.92 km3(−0.48 km3/a).From 1977 to 2002,105 glaciers disap‐peared, and 45 glaciers split into 96, bring a decrease of 168.94 km2in the area (−8.32%, or −0.36%/a) and a loss of 10.60 km3in the ice volume (0.44 km3/a). In comparison,a total of 82 glaciers disappeared,35 gla‐ciers split into 73 from 2002 to 2018, resulting in 169.14 km2in the area reduction(−9.08%/a,or −0.54%/a)and 9.32 km3in the ice volume loss(0.53 km3/a).Obvi‐ously,in 1977−2002 and 2002−2018,the glacier num‐ber, area and ice volume all showed a decreasing trend,and the rates of glacier area and ice volume loss in 2002−2018 are higher than those of 1977−2002.
From 1977 to 2018, the number of glaciers with areas<0.10 km2increased in the Qaidam Basin where‐as the number and area of glaciers of other sizes de‐creased, as shown in Figure 3. The number of gla‐ciers with areas of 0.2−0.5 km2and 0.5−1 km2de‐creased the most (−115 and −100, respectively), and the total area of glaciers of 2−5 km2decreased the most(−102.52 km2), followed by glaciers of 0.5 −1 km2(−61.79 km2). The number and area of glaciers with areas of 10−20 km2changed the least. Based on the relative rate of area loss, glaciers <0.10 km2retreat‐ed the fastest (−2.47%), followed by glaciers of 0.10 −0.20 km2and 0.20 −0.50 km2(−1.85%/a and−1.14%/a), though glaciers <0.10 km2had the small‐est combined area. Glaciers with areas of >20 km2re‐treated the slowest(−0.099%/a).Therefore,the retreat of glaciers in the Qaidam Basin is dominated by small glaciers with an area<0.50 km2.
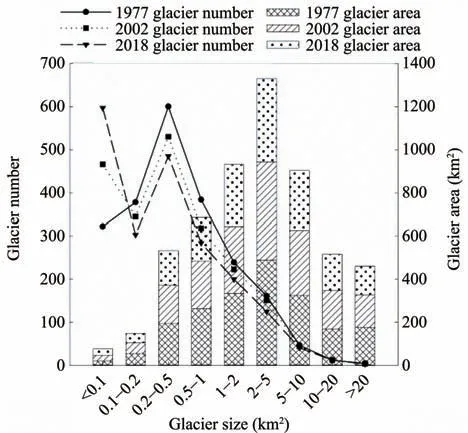
Figure 3 The changes in the number and area of glaciers in different sizes in the Qaidam Basin from 1977 to 2018
4.2.2 Glacier changes in elevation
The main terrain factors that influence the number and size of glaciers are the absolute elevation of the host mountain and relative elevation above the equi‐librium line (Gartner-Roeret al., 2014). Surrounded by high mountains, the Qaidam Basin has a complex climate and an obvious distribution and change char‐acteristics of glaciers in its different mountain sys‐tems. Variations of glacier sizes with the altitude in each mountain resembled normal distributions (Figure 4), though the distribution and changes of glaciers in each mountain are different. Glaciers with the largest number and area developed at 4,490−6,826 m in the Kunlun Mountains, at 4,468 −5,813 m in the Qilian Mountains, and at 4,603−6,043 m in the Altun Moun‐tains.Among the three mountains, the Kunlun Moun‐tains had the largest glacier number and area, and the Altun Mountains the least. From 1977 to 2018, the lowest elevations of glacier occurrence in the Kunlun,Altun, and Qilian Mountains climbed by 45 m, 53 m,and 49 m, respectively. In the Kunlun Mountains,glaciers were mainly distributed at 5,000−5,700 m,with an area of 1,173.5 km2(87.9% of the total) in 1977. In 2002 and 2018, the majority were distribut‐ed at 5,100−5,700 m, with an area of 1,029.23 km2(82.09%) and 943.43 km2(82.32%), respectively.From 1977 to 2018, the glacier retreat mainly con‐centrated at 4,900 −5,600 m with an area loss of 221.46 km2(95.53%). The area of glaciers above 5,900 m remained almost unchanged, and the maxi‐mum decrease in glacier area occurred near 5,250 m.
Comparatively, glaciers in the Qilian Mountains were mainly distributed at 4,800−5,300 m in 1977−2002,with an area of 487.89 km2(80%) and 453.03 km2(80.78%). In 2018, glaciers were mainly distributed at 4,900−5,300 m,with an area of 367.23 km2(73.12%).From 1977 to 2018, the glacier retreat mainly concen‐trated at 4,700 −5,200 m, with an area reduction of 83.87 km2(77.8%).The area of glaciers above 5,600 m remained almost unchanged,and the maximum reduc‐tion in glacier area occurred near 5,050 m. Meanwhile,glaciers in the Altun Mountains were mainly distributed at 5,100 −5,700 m in 1977 −2002, with an area of 39.03 km2(72.41%) and 36.98 km2(72.75%). In 2018,glaciers were mainly distributed at 5,200−5,600 m,with an area of 23.53 km2(52.04%). From 1977 to 2018, the glacier retreat mainly concentrated at 5,000−5,600 m,with an area reduction of 6.02 km2, accounting for 69.19% of the total reduction. The area of glaciers above 5,900 m remained almost unchanged, and the maximum decline in the glacier area occurred near 5,250 m.
The median altitude in glacier area distribution of the Kunlun Mountains is the highest, and that of the Qilian Mountains is the lowest. From 1977 to 2018,the median altitude rose from 5,368.31 m to 5,394.79 m for the Kunlun Mountains, from 5, 356.95 m to 5, 373.94 m for the Altun Mountains, and from 5,082.22 m to 5,101.98 m for the Qilian Mountains,or by 26.48 m, 16.99 m, and 19.76 m, respectively.The area shrinking rate of the Kunlun Mountains was the fastest (−5.47 km2/a), whereas that of the Altun Mountains was the slowest (−0.2 km2/a). While the relative area shrinking rates were small for all moun‐tains, the Qilian Mountains at −0.44%/a, was slightly faster than the Kunlun Mountains (−0.43%/a),and the Altun Mountains(−0.4%/a).
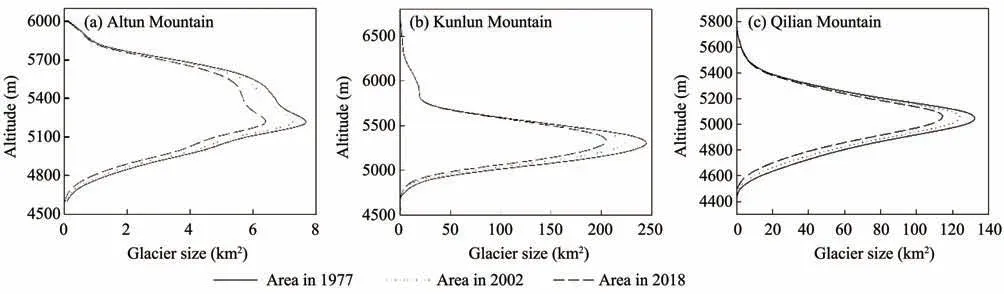
Figure 4 Glacier area variations with the altitudinal range in the Qaidam Basin from 1977 to 2018
4.2.3 Orientation characteristics of glacier changes
Glacier orientation refers to the direction that the glacier faces and can be classified as eight directions,including the north (N), northeast (NE), east (E),southeast (SE), south (S), southwest (SW), west (W),and northwest (NW).As shown in Figure 5, the larg‐est glacier number and area were north-oriented in the Qaidam Basin, followed by northeast-oriented and northwest-oriented. The numbers of south-orient‐ed and southwest-oriented glaciers were about equal but much less.From 1977 to 2018,the number and ar‐ea of glaciers of all orientations decreased, except for glaciers of northwest- and southwest-orienta‐tions. The area of north-oriented glaciers decreased the most(−125.43 km2),followed by northeast-orient‐ed (−80.90 km2), while that of the southeast-oriented glaciers exhibited the smallest decrease (−10.66 km2).The west- and east-oriented glaciers decreased the most in relative size,i.e., −27.11% and −27.10%, re‐spectively, followed by the north-, northeast-, and south-oriented glaciers with a shrinkage ratio varying from −19.34%to −13.45%.The southwest-and south‐east-oriented glaciers had smallest relative area loss,i.e.,−9.47%and −9.74%,respectively.
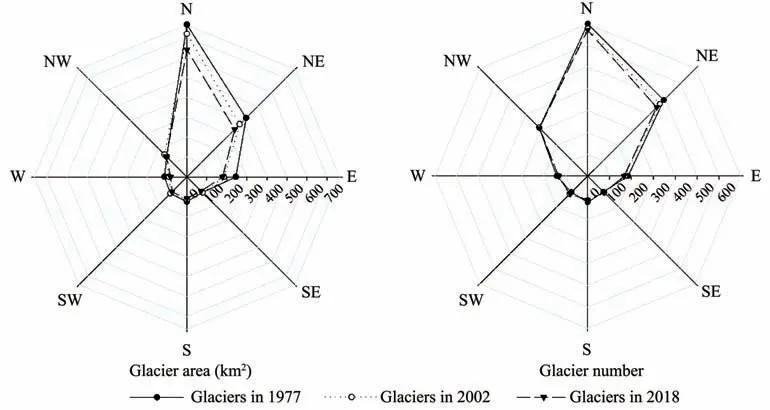
Figure 5 Orientational characteristics of glacier changes in the Qaidam Basin from 1977 to 2018
4.2.4 Regional differences in glacier change
Glaciers in the Qaidam Basin have different for‐mation and development conditions.As shown in Fig‐ure 6,the glacier change in the Altun and Qilian Moun‐tains were dominated by small ones, but the same is not necessarily true for the glaciers in the Kunlun Mountains. To further clarify the regional differences in glacier change, the glacier data in the Qaidam Ba‐sin were clustered with radii of 0.5° and 0.3° using the Density-Based Spatial Clustering of Applications with Noise(DBSCAN)algorithm.Glaciers in an inde‐pendent group with a small number were merged into a neighboring one with a large number. There were a total of seven categories, and the glacier area change and the relative rate of change were then calculated for each category from 1977 to 2018.The glacier cate‐gories were named with their adjacent rivers,i.e., the Toso River,Neqigol River,Tulagt Ar Gol River,Atat‐kan River,Toggesay River, Haltang, and Shule River(Figure 7). The results showed that the glacier area in all categories presented a declining tendency. The Tulagt Ar Gol River category had the most retreat(−89.13 km2), followed by the Hartang River category(−83.57 km2). And the Tosuo River category had the least area reduction (−8.66 km2). In terms of the rela‐tive rate of area loss, the Tosuo River category retreat‐ed the fastest (−1.49%/a), followed by the Neqigol River category(−0.68%/a)and then the Atatkan River category(−0.67%/a).The Tulagt Ar Gol River catego‐ry had the slowest retreat (−0.29%/a). Therefore, gla‐ciers in the northern basin dominated by the eastern end of the Altun Mountains-Qilian Mountains were re‐treating faster than the southern regions controlled by the western end of the Altun Mountains-Kunlun Moun‐tains.The Tulagt Ar Gol River category,which is influ‐enced by the Bokarektag Mountains,had the lowest re‐treat rate and accelerated towards both ends.
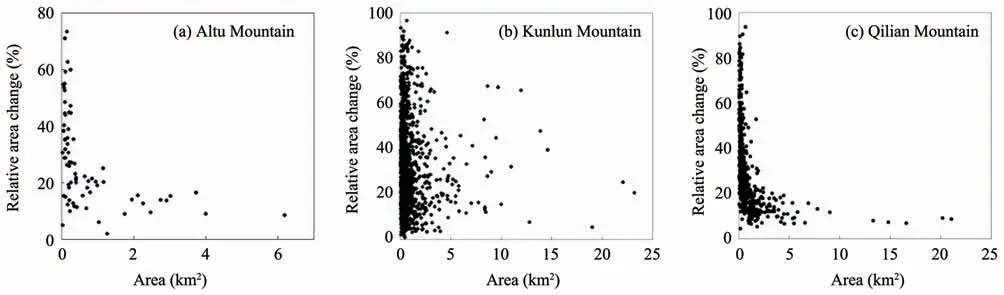
Figure 6 Glacier changes in different mountains in the Qaidam Basin
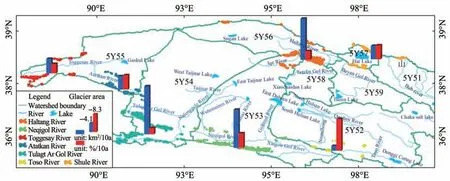
Figure 7 Glacier area changes of different sub-basins in the Qaidam Basin from 1977 to 2018
5 Discussions
5.1 Response of glaciers to climate change
Temperature and precipitation are the main climat‐ic factors affecting the change of glaciers. Tempera‐ture determines the melting of glaciers, precipitation defines the accumulation of glaciers,and their interac‐tion decides the nature, development and evolution of glaciers (Xie and Liu, 2010). The temperature has an essential effect on glaciers in a long term and broad spatial range. However, glaciers in a short time scale and a narrower space are more significantly affected by precipitation (Gao, 2000). Researches revealed that the temperature has shown a significant warming trend in the past 50 years, with a rate of 0.53 °C/10a in the Qaidam Basin(Wanget al.,2014),much higher than the Tibetan Plateau (0.37 °C/10a) (Liet al., 2010)and the whole China (0.25 °C/10a) (Renet al., 2005).The annual precipitation showed a slowly increasing trend with an rate of 5.3 mm/10a (Xinget al., 2018),and the precipitation mainly concentrated in summer.Since the late 1980s, the basin climate has transi‐tioned from warm and dry to warm and wet, and such a trend has been more evident in recent years (Daiet al., 2013). The data of the above study was mainly from the various meteorological stations in the ba‐sin.To further explore the response of glacier chang‐es to climate warming in the Qaidam Basin, the 0.5°×0.5° gridded dataset of monthly temperature and precipitation of China (V2) were used in this pa‐per. The interannual changes in temperature and pre‐cipitation during the study period were analyzed.The results showed that the temperature in the gla‐cial ablation period has continued to rise in the Qaid‐am Basin in the past 50 years (Figure 8) at rates in the range of 0.3−0.6 °C/10a.The largest temperature increase was in the northwest of the Gaskul Lake Ba‐sin (5Y55). The annual precipitation in the moun‐tainous areas around the basin increased significant‐ly, but less so in the internal increase. Except for the decrease of precipitation in some areas of the Taijin‐er River Basin (5Y54), the increase rate of precipita‐tion in other areas was between 6−10 mm/10a.Typi‐cally,precipitation must increase by 25% to compen‐sate for the mass loss of glaciers caused by uniform warming of 1 °C (Oerlemans, 2005). Simultaneously,rising temperatures can increase the proportion of rain and snow in precipitation and enhance the melt‐ing process on the glacial surfaces(Yao,2010).There‐fore, comparing the temperature and precipitation changes in the Qaidam Basin, the increase in precipi‐tation was far less than the impact of rising tempera‐tures on the mass balance of glaciers. The increase in temperature was the main reason for the retreat of glaciers.
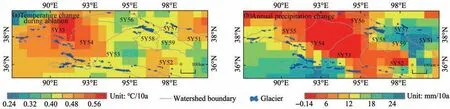
Figure 8 The change of temperature in ablation and annual precipitation in the Qaidam Basin from 1977 to 2018
5.2 Comparative analysis of different glacier data
The First Chinese Glacier Inventory data of the Qaidam Basin used a large number of aerial photo‐graphs and some re-compiled 1:100,000 topographic maps as the primary data source.During revision,top‐ographic maps were calibrated by an aerial interpreter and an aerograph Stereograph (Yanget al., 1980).However, some topographic maps have not been proofread or had poor proofreading results, and omis‐sions and mistakes existed (Liuet al., 2005). In this paper, glaciers in the Qaidam Basin were re-extracted based on Landsat MSS images from 1972 to 1978.Comparing the First Chinese Glacier Inventory in 1977, it was found that there were 270 missing gla‐ciers, with an area of 38.76 km2, accounting for 1.97% of the total. The missing glaciers are mainly dominated by ones <0.50 km2; the total area of gla‐ciers differs by 64.06 km2, or 3.26% of the total. Oth‐er scholars used MODIS data to study the changes of glaciers in the Qaidam Basin (Lu, 2015). The results showed that the glacier area fluctuated year by year,due to the data's low resolution, there was a large er‐ror in identifying the ice surface features in the ice tongue area and the peripheral boundaries of the gla‐ciers.Therefore,compared with the First Chinese Gla‐cier Inventory and the extracted glacier boundary based on the MODIS data,the data based on the Land‐sat series of images in this study has higher accuracy.
6 Conclusions
(1)In 1977,there were 2,148 glaciers in the Qaid‐am Basin, with an area of 2,031.62±163.47 km2and an ice volume of about 128.58±2.96 km3. In 2002,there were 2,094 glaciers, with an area of 1,862.68±86.07 km2and an ice volume of 117.97±2.73 km3. In 2018, there were 2,050 glaciers in the Qaidam Basin,with an area of 1,693.54±40.96 km2and an ice vol‐ume of about 108.65±2.43 km3; glaciers with ar‐eas <1.0 km2accounted for the largest number, while glaciers with areas of 1.0−5.0 km2accounted for the most glacierized area. Among the nine sub-basins of the Qaidam Inland Basins, the Taijinaier River Basin(5Y54) has the largest glacier number, area, and ice volume,whereas the Bayingguole River Basin (5Y59)has the least.
(2) From 1977 to 2018, the glacier number in the Qaidam Basin decreased by 177, the area shrank by 338.08 km2(−8.12 km2/a), and the ice volume was re‐duced by 19.92 km3(−0.48 km3/a). Glaciers retreat at different altitudes in various mountain systems. The Kunlun Mountains glacier retreat was concentrated at elevations of 4,900−5,600 m, with the area reduc‐tion accounting for 95.53% of the total; the Qilian Mountains glacier retreat was centered at altitudes of 4,700−5,200 m, accounting for 77.8% of the total reduction; and the Altun Mountains glacier retreat was concentrated at elevations of 5,000−5,600 m, ac‐counting for 69.19% of the total reduction. The northoriented glaciers had the largest area loss(−125.43 km2),while the west- and east-oriented glaciers retreated the fastest in terms of relative area loss, by −27.11%and −27.10%, respectively, and the southwest- and southeast-oriented retreated the slowest, by −9.47%and −9.74%,respectively.
(3) From 1977 to 2018, the area of glaciers in each sub-regions of the Qaidam Basin showed a de‐creasing trend. The rate of retreat in the north of the basin was faster than that in the south, and the glacier retreat in the north gradually accelerated from north‐west to southeast. The glacier temperature has contin‐ued to rise, and the amount of precipitation has in‐creased slowly in the Qaidam Basin during the last 50 years.The increase in precipitation had far less im‐pact on the changes of glacier than the rising tempera‐ture. Therefore, the continuous rise in temperature is concluded as the main reason for glacier retreat in the Qaidam Basin.
 Sciences in Cold and Arid Regions2020年6期
- Sciences in Cold and Arid Regions的其它文章
- Zhangmu and Gyirong ports under the threat of glacial lake outburst flood
- A note on the lake level variations of Nam Co,south-central Tibetan Plateau from 2005 to 2019
- Manifestations and mechanisms of mountain glacier-related hazards
- Spatial distribution of supraglacial debris thickness on glaciers of the China-Pakistan Economic Corridor and surroundings
- Characteristics and changes of permafrost along the engineering corridor of National Highway 214 in the eastern Qinghai-Tibet Plateau
- Guidelines to Authors