
Genome-wide association study of vitamin E in sweet corn kernels
2020-04-21 13:46YingniXioYongtoYuGokeLiLihuXieXinoGuoJinshengLiYulingLiJingungHu
The Crop Journal 2020年2期
Yingni Xio, Yongto Yu, Goke Li,Lihu Xie, Xino Guo, Jinsheng Li,Yuling Li, Jingung Hu,*
aCrop Research Institute, Guangdong Academy of Agricultural Sciences, Key Laboratory of Crops Genetics and Improvement of Guangdong Province,Guangzhou 510640,Guangdong, China
bSchool of Food Science and Engineering,South China University of Technology, Guangzhou 510641,Guangdong, China
cNational Maize Improvement Center of China, Beijing Key Laboratory of Crop Genetic Improvement, China Agricultural University, Beijing 100193,China
A B S T R A C T
Keywords:Sweet corn GBS Genome-wide association study Vitamin E Marker-assisted selection Vitamin E, consisting of tocopherols and tocotrienols, serves as a lipid-soluble antioxidant in sweet corn kernels, providing nutrients to both plants and humans. Though the key genes involved in the vitamin E biosynthesis pathway have been identified in plants, the genetic architecture of vitamin E content in sweet corn kernels remains largely unclear. In the present study, an association panel of 204 inbred lines of sweet corn was constructed.Seven compounds of vitamin E were quantified in sweet corn kernels at 28 days after pollination. A total of 119 loci for vitamin E were identified using a genome-wide association study based on genotyping by sequencing, and a genetic network of vitamin E was constructed. Candidate genes identified were involved mainly in RNA regulation and protein metabolism. The known gene ZmVTE4, encoding γ-tocopherol methyltransferase,was significantly associated with four traits(α-tocopherol,α-tocotrienol,the α/γ-tocopherol ratio, and the α/γ-tocotrienol ratio). The effects of two causative markers on ZmVTE4 were validated by haplotype analysis.Finally,two elite cultivars(Yuetian 9 and Yuetian 22)with a 4.5-fold increase in the sum of α- and γ-tocopherols were developed by marker-assisted selection,demonstrating the successful biofortification of sweet corn.Three genes(DAHPS,ADT2, and cmu2) involved in chorismate and tyrosine synthesis were significantly associated with the α/γ-tocotrienol ratio. These results shed light on the genetic architecture of vitamin E and may accelerate the nutritional improvement of sweet corn.
1. Introduction
Vitamin E, synthesized by all plant tissues and some cyanobacteria, serves as a lipid-soluble antioxidant and is an essential nutrient in humans [1]. The recommended daily allowance of vitamin E is 15 mg day-1for adults[2].Deficiency of vitamin E increases the risk of diseases such as cardiovascular disease and cancers and also results in decreased immune function [3]. Vitamin E can be classified into two groups, tocopherols (T) and tocotrienols (T3), both of which consist of four different forms:α,β,γ,and δ,according to the degree and position of methyl substituents on the aromatic ring [4]. Tocopherols have higher vitamin E activity than the corresponding tocotrienols,and this activity can be ranked in descending order as follows: α >β >>γ >δ. Generally, αtocopherol shows the highest vitamin E activity among the eight forms in food[5].
Vitamin E biosynthesis has been fully elucidated using mutants in Arabidopsis thaliana, and the key genes are highly conserved among plant species [4,6] (Fig. 1). The first step in the vitamin E biosynthesis pathway involves the production of homogentisic acid (HGA), from p-hydroxyphenylpyruvate(HPP) in the catalysis of p-hydroxyphenylpyruvic acid dioxygenase (HPPD) encoded by hppd1 [7]. Subsequently,together with two substrates, phytyl diphosphate (phytyl-DP)and geranylgeranyl diphosphate (GGDP), HGA yields 2-methyl-6-phytyl-1,4-benzoquinol (MPBQ) and 2-methyl-6-geranylgeranyl-1,4-benzoquinol (MGGBQ) in a reaction catalyzed by the enzymes homogentisate prenyltransferase (the product of vte2)and homogentisate geranylgeranyltransferase(the product of hggt1)[8].In the catalysis of tocopherol cyclase(the product of vte3) and MPBQ/MGGBQ methyltransferase(the product of vte1), γ and δ forms of tocopherols and tocotrienols are formed [9]. Finally, γ- tocopherol methyltransferase (the product of vte4)adds a methyl group to the γ and δ isoforms and produces the α and β forms of tocopherols and tocotrienols, respectively [10]. Phytol kinase (the product of vte5)and phytyl-phosphate kinase(the product of vte6)are involved in the phytol phosphorylation pathway and also play important roles at the beginning of the tocopherol biosynthesis pathway[11,12].
In recent years, genome-wide association studies (GWAS)have become a robust strategy for dissecting the genetic architecture of complex quantitative traits in field corn (Zea mays) owing to its rapid linkage disequilibrium (LD) decay[13-15]. Thousands of genes associated with vitamin E have been identified by GWAS in field corn kernels [16-19]. Sweet corn (Zea mays) is distinguished from field corn in certain genes and consumed largely in the immature stage [20]. The content of vitamin E in sweet corn increased during kernel development [21], indicating genetic architectures differing between sweet corn and field corn. Recently, a sweet corn association panel of temperate U.S. lines was constructed to elucidate the genetic basis of tocochromanol content in fresh kernels[22].However,as yet,much remains unclear about the genetic architecture of vitamin E and the application of GWAS in sweet corn.
We constructed a sweet corn association population consisting of 204 inbred lines.We performed GWAS to dissect the genetic architecture of vitamin E and identify candidate genes that might enhance vitamin E content in sweet corn.

Fig.1- Vitamin E biosynthesis pathway in maize kernels.Seven compounds detected in this study are shown in black text.Genes involved in the pathway are shown in orange boxes with italic text.Four genes identified in this study are shown in red text.GGDP,geranylgeranyl diphosphate;HPP,p-hydroxyphenylpyruvate;HGA,homogentisic acid;Phytyl-DP,phytyl diphosphate;DMGGBQ,2,3-dimethyl-5-geranylgeranyl-1,4-benzoquinol;MGGBQ,2-methyl-6-geranylgeranyl-1,4-benzoquinol; MPBQ,2-methyl-6-phytyl-1,4-benzoquinol;DMPBQ,2,3-dimethyl-6-phytyl-1,4-benzoquinol.
2. Material and methods
2.1. Plant material and phenotyping
Two hundred and four inbred lines of sweet corn from tropical and temperate backgrounds were collected. They were planted in a randomized complete block design with two and three replications at Guangzhou in 2015 and 2016,respectively. Each row contained 11 plants from each line,with 25 cm between plants and 70 cm between rows. More than five lines in each row were self-pollinated and harvested for phenotyping. Ten agronomic traits were measured,including four morphological traits: plant height (PH), ear height (EH), tassel length (TL), and tassel branch number(TBN),and six yield-related traits:ear length(EL),ear diameter(ED),number of kernel rows(KRN),ear dry weight(EW),kernel weight(KW)and hundred-kernel weight(HKW).For each line,the best linear unbiased predictor(BLUP)was calculated using the lme4 package of R [23]. The broad-sense heritabilities (H2)of the agronomic traits were estimated as H2= σ2g/+ σ2ge/r + σ2ε/er), where σg2represents the genetic variance, σ2gerepresents the interaction of genotype with environment,and σ2εrepresents the residual error, and e and r are the numbers of environments and replications per environment,respectively [24]. Pearson correlation coefficients between traits were calculated with R.
For measurement of vitamin E content, all 204 lines were planted in 2016 at Guangzhou, with three replications. Intact immature kernels were separated from the ears at 28 days after pollination and frozen in liquid nitrogen for vitamin E extraction. Extraction and determination of vitamin E were performed using normal-phase high-performance liquid chromatography (NP-HPLC) following a previous study [21].Seven compounds, α-tocopherol (AT), γ-tocopherol (GT), δtocopherol (DT), β-tocopherol (BT), α-tocotrienol (AT3), γtocotrienol (GT3), and δ-tocotrienol (DT3) were determined,after which the BLUPs of three replications were calculated with the lme4 package and used for further analysis. Five secondary traits, including total tocopherol (TT), total tocotrienol (TT3), total vitamin E (TTT), the α/γ-tocopherol ratio (RT) and the α/γ-tocotrienol ratio (RT3), were calculated from the BLUP values of the first traits before association analysis.
2.2. GBS of sweet corn
Leaf samples of the 204 inbred lines were obtained from bulks of five plants in each line.DNA was extracted using the CTAB protocol [25]. Single-nucleotide polymorphisms (SNPs)data were produced using GBS as previously described (Table S1)[26].Read mapping and SNP calling were performed based on the B73 reference genome (AGPv3) following the pipeline(Table S1) [27]. First, SNPs with minimum allele frequencies(MAF) <0.05 and missing data >80% were excluded from the raw data. Then for the missing SNPs, Beagle v.4.1 [28] was used for the imputation of SNPs to obtain a comprehensive genotype.After removal of SNPs with MAF <0.05 and missing data >20%,150,124 SNPs were retained(Fig.S1,Fig.S2).Finally,the SNPs were annotated based on AGPv3 using SnpEff v4.1[29] and were divided into eight categories (Table S2). The genetic codes in which exonic SNPs were located were extracted to classify them as synonymous or nonsynonymous.
2.3. LD decay, kinship analysis, principal component analysis(PCA), and GWAS
LD (r2) was calculated for all pairs of SNPs within 2 Mb using PLINK 1.9[30].The parameters were set as follows:-maf 0.05-geno 0.2 -r2 -ld-window-kb 2000 -ld-window 9999 -ldwindow-r2 0. The average r2within a 100-bp sliding window with step length of 100-bp was calculated. LD decay profiles were then plotted with an R script. Overall LD decay reached 500 kb(r2= 0.2)in our panel(Fig.S3).
Kinship was studied according to Endelman and Jannink[31] using Centered-Identity by State (Centered-IBS) matrix values in TASSEL 5 [32]. PCA was performed with GCTA software [33]. The first two PCs (PC1 and PC2) were added to control the principal component. A GWAS was performed for vitamin E traits, and a mixed linear model by control both of PC and relative kinship with ‘no compression' and ‘P3D algorithms' was implemented in TASSEL 5 [34]. The Bonferroni-adjusted significance threshold (P <1/n =6.66 × 10⁻⁶) was used to identify significant associations.Considering that the mean LD decay in the panel was 500 kb, all genes within 500 kb up- and downstream of the lead SNP were considered as acceptable associated genes,and genes annotated as being involved in vitamin E biosynthesis or the closest gene near each peak were proposed to be the most likely candidate gene. For each trait, the phenotypic variation of the population explained by all significant leading SNPs was estimated by stepwise regression, using the lm function in R, as previously described [13]. The genetic networks were constructed using the software Cytoscape[35] (Version: 3.6.1), with traits and their corresponding significantly associated SNPs.
3. Results
3.1. Characterization of the GWAS panel
Large variation was observed in all agronomic traits(Table 1).TBN ranged from 4.47 to 21.67,showing the highest change of 4.8-fold,while ED varied from 2.81 cm to 4.42 cm,showing the lowest change of 1.6-fold. All traits showed high heritability(≥0.73), indicating that a steady panel was constructed (Table 1). Several trait pairs displayed significant positive correlations,such as the strong positive correlation between EW and KW (r = 0.96, P = 2.2 × 10⁻¹⁶), and the weak positive correlation between TBN and KRN(r = 0.16,P = 0.02)(Table 1).
A total of 210 million reads were generated from GBS libraries for the 204 sweet corn lines. Of these, 79.6% were properly mapped to the AGPv3 reference genome(Table S1).A total of 150,124 SNPs were identified after SNP calling,filtering, and imputation (Fig. S1). Of these, 75,280 or 50.1%were mapped to the gene regions of 18,703 genes (Table S2),for an average of 4.03 SNPs per gene over the genome. In general, the SNPs were evenly distributed over the 10 chromosomes (Fig. S2). Of all the SNPs in gene regions, 3170 were assigned as large-effect variations, including 2679 predicted to cause nonsense mutations, 9 predicted to cause start codon loss,180 predicted to cause stop codon disruption,and 302 predicted to affect splicing(Table S2).

Table 1-Phenotypic variation for agronomic traits in the sweet corn panel.

Fig.2-Phenotypic analysis of vitamin E content traits in a sweet corn panel.The histograms on the main diagonal show the phenotypic distribution of each trait.The plots below the diagonal are scatterplots of the two traits,and the corresponding values above the diagonal are the correlation coefficients between them.AT,α-tocopherol;GT,γ-tocopherol;DT,δ-tocopherol;BT,β-tocopherol; AT3,α-tocotrienol;GT3,γ-tocotrienol;DT3,δ-tocotrienol;TT,total tocopherol; TT3,total tocotrienol; TTT,total vitamin E;RT, the α/γ-tocopherol ratio; RT3,the α/γ-tocotrienol ratio.
3.2. Phenotypic variation of vitamin E in sweet corn kernels
Wide variation was observed in 12 vitamin E-related traits in the association panel of 204 inbred lines of sweet corn.Seven compounds: AT, GT, DT, BT, AT3, GT3, and DT3, were quantified by NP-HPLC. Among the seven compounds, GT3 was the most abundant and BT the least abundant (Fig. 2,Table 2). The content of tocotrienols was higher than that of tocopherols. Among the 12 traits, RT varied from 0.17 to 3.16,showing the largest variation of 18.6-fold,whereas TTT varied from 8.74 to 24.47, showed the lowest variation of 2.9-fold(Table 2). The 12 vitamin E traits were grouped into two clusters based on their pairwise correlations (Fig. S4). Seven compounds were assigned to clusters according to their positions in the vitamin E biosynthesis pathway. AT and BT showed strong positive correlations (r = 0.794), while GT and DT were also strongly correlated(r = 0.533)(Fig.2,Fig.S4).The same strong correlation was detected between GT3 and DT3(r = 0.624) (Fig. 2, Fig. S4). Most of the traits followed normal distributions, including AT, GT, DT, AT3, GT3, TT, TT3, and TTT (Fig. 2). However, BT, DT3, RT, and RT3 showed skewed distributions (Fig. 2). These results suggested that the abundant phenotypic diversity in the panel could provide a basis for dissection of genetic architecture.
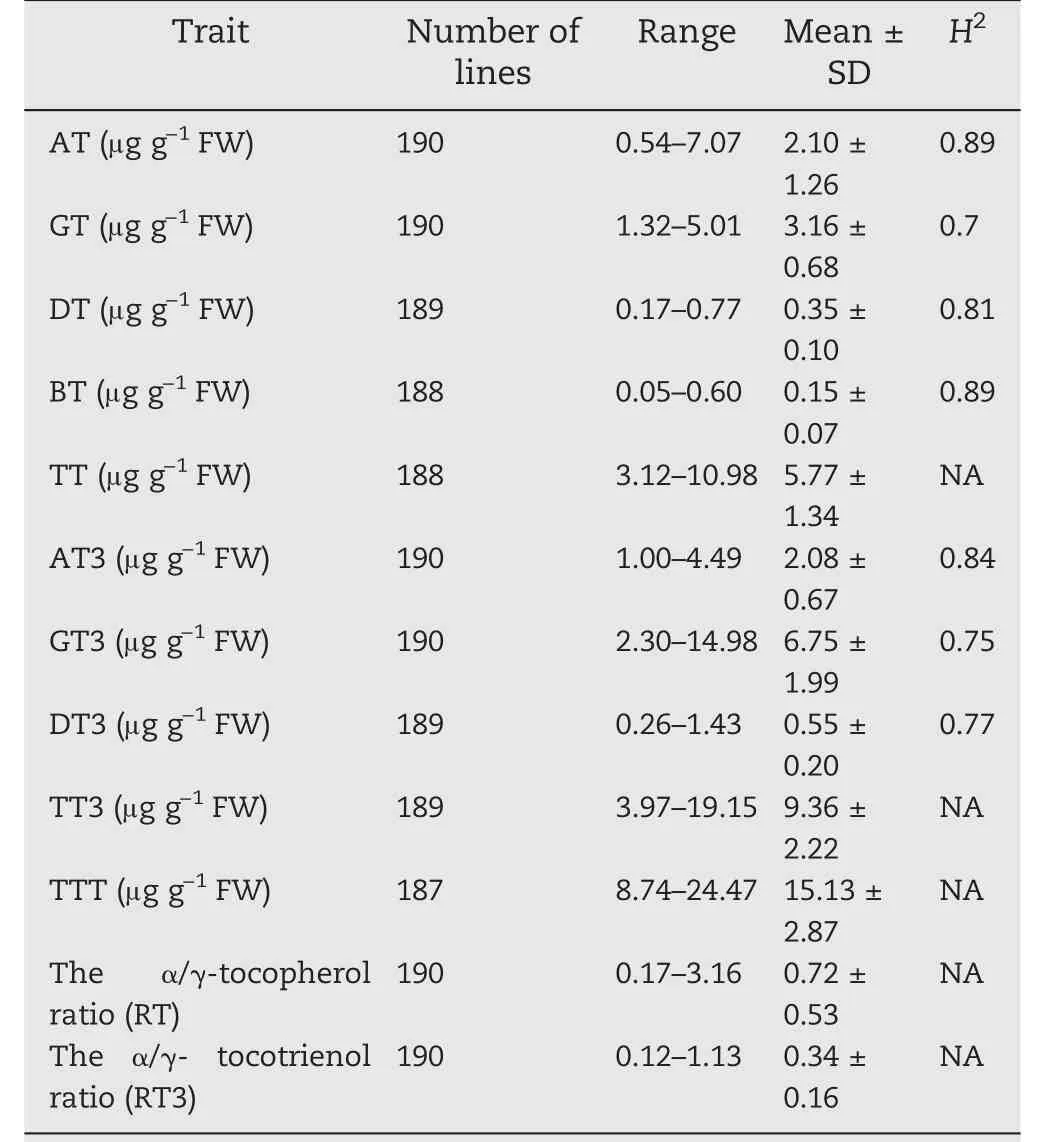
Table 2-Phenotypic variation for tocochromanol traits in the sweet corn panel.
3.3. GWAS of vitamin E in sweet corn kernels
Using 150,124 SNPs genotyped from 204 lines, we performed GWAS to identify the genetic architecture of vitamin E-related traits in sweet corn. A total of 119 sites were significantly associated with eight vitamin E-content traits at the threshold of P <6.66 × 10⁻⁶(Table 3,Table S3,Fig.S5).For the eight traits, the phenotypic variation explained by each SNP ranged from 13.21% to 32.15%, with the highest phenotypic variation detected in AT. Thirty-two SNPs were associated with BT, explaining the greatest phenotypic variation(81.42%). In contrast, one SNP was associated with TT3,explaining the least phenotypic variation(14.86%).Among all the SNPs, nine were significantly associated with more than one trait, exhibiting pleiotropic effects. To dissect the genetic architecture of the correlations across different traits, a network of traits and significant sites was constructed. The traits were connected by several significant sites, with the exception of two traits(TT3 and DT)(Fig.3).As the component with highest vitamin E activity,AT is the trait most valuable to sweet corn kernels. In the network, BT, RT, TT, and AT3 shared several significant sites with AT (Fig. 3), in agreement with their high phenotypic correlations (Fig. 2). In contrast,RT3 shared only one significant site with AT (Fig. 3). Thus traits shared similar genetic architecture when they exhibited strong phenotypic correlation.
Most of the candidate genes identified were involved in RNA regulation and protein metabolism(Table S3).A series of strong signal sites on chromosome 5 were associated with four traits (AT, AT3, RT, and RT3) (Fig. S5), in agreement with previous results [16-18,22]. The most significant site(chr5_200376352) was located 43 kb from ZmVTE4(GRMZM2G035213), which encodes a γ-tocopherol methyltransferase. Of the 9 significant sites associated with AT,four were located at the distal end of long arm in chromosome 5,forming a cluster spanning 1.2 Mb(Table S3,Fig.S5).DAHPS(GRMZM2G359822), encoding a 3-deoxy-d-arabinoheptulosonate 7-phosphate synthase, was significantly associated with RT3 (Table S3, Fig. S5). ADT2 (GRMZM2G145451),encoding an arogenate and prephenate dehydratase, was significantly associated with RT3 (Table S3, Fig. S5). Cmu2(GRMZM2G179454), encoding chorismate mutase 2, was significantly associated with RT3 (Table S3, Fig. S5). All three genes are involved in the chorismate and tyrosine synthesis pathways, which are located upstream of the vitamin E biosynthesis pathway (Fig. 1). Several SNPs were associated with more than one vitamin E-content,suggesting pleiotropic effects. For example, on chromosome 1, GRMZM2G089291,which encodes a respiratory burst oxidase protein, was associated with three tocopherol traits (AT, BT, and RT)(Table S3). On chromosome 6, GRMZM2G111579 (GSH1),which encodes gamma-glutamylcysteine synthetase, was identified as a candidate gene for three traits (AT, BT and TT)(Table S3).
3.4. Haplotype analysis and biofortification of ZmVTE4 in sweet corn kernels

Fig.3- A network of vitamin E traits in sweet corn.Colored nodes represent traits,and gray dots represent the responsible significantly associated sites.Node size corresponds to the phenotypic variation explained by all associated sites.Four genes involved in the vitamin E biosynthesis pathway are highlighted with pink text.
Two independent insertion/deletion (InDel) markers, InDel7 and InDel118 which are located in the 5′UTR and promoter regions of ZmVTE4, are two causative markers for AT in field corn [17]. To estimate the contributions of these InDels,haplotype analysis was performed in the sweet corn panel.The inbred lines were classified into four haplotype groups.Haplotype 3 (Hap3, 7/118) was the largest group (n = 74),whereas there was only one inbred in haplotype 4(Hap4,7/0)which is not shown in the haplotype analysis. Statistically,Hap1 (0/0) had the highest contents of AT, AT3, RT, and RT3,corresponding to the lowest contents of GT and GT3 (Fig. 4).This result suggested that Hap 1 is a favorable haplotype in sweet corn. Forty-one lines showed favorable haplotypes,suggesting the potential of biofortification of ZmVTE4 in sweet corn. Accordingly, the two markers were used for markerassisted selection (MAS) in high-vitamin E sweet corn breeding. Among the 41 lines, five (1132, 1022, 794, XIANM-1,and TIANZ-1) carrying the favorable haplotype were selected to develop elite hybrids. Considering the importance of tocopherols in the human diet, two cultivars (Yuetian 9 and Yuetian 22) were successfully developed, showing 4.5-foldincrease of the sum of AT and GT compared with Yuetian 28,the major cultivar in Guangdong province(Fig.5).
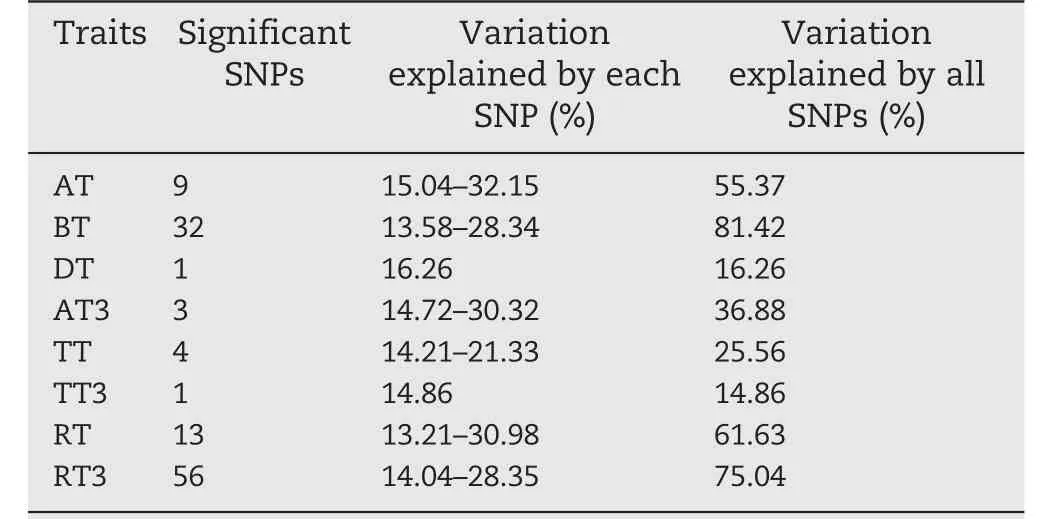
Table 3-Summary of significant SNPs identified for vitamin E content traits in sweet corn.
4. Discussion
4.1. Phenotypic variation and correlation
In the present study, a panel consisting of 204 sweet corn inbred lines was constructed. Vitamin E content was measured in a large natural population of sweet corn.GT3 was the most abundant compound in sweet corn, followed by GT,whereas GT was the most abundant compound in field corn,followed by GT3 [16,18]. Vitamin E contents exhibited a significant upward increase during the kernel development stage in sweet corn [21], implying that the composition of vitamin E in sweet corn was different from that in field corn.Tocotrienols were the main components in sweet corn,whereas tocopherols were the main components in field corn. Seven compounds were grouped into two clusters according to their phenotypic correlations (Fig. S4). Three compounds(BT,AT,and AT3)were placed in a cluster because they are all located in the final step of the vitamin E biosynthesis pathway. Similarly, four compounds (GT3, DT3,GT, and DT) were placed in another cluster because they are located at the second end of the pathway.These results were consistent with previous results[16,18],suggesting the fidelity of the sweet corn phenotypic measurements.
4.2. Genetic architecture and potential candidate genes of vitamin E in sweet corn kernels
As the compound with highest vitamin E activity, AT is controlled by a few major quantitative trait loci (QTL) and numbers of minor QTL in maize[16-19].In the present study,four candidate genes located in a 1.2-Mb region on chromosome 5 contributed to the large phenotypic variation in AT(Table S3,Fig.S5),in agreement with field corn findings.As the key enzyme in the last step of the tocopherol biosynthesis pathway, ZmVTE4 was the strongest candidate gene for AT in sweet corn. Subsequent haplotype analysis supported the function of ZmVTE4. Thus, sweet corn may share a similar genetic architecture of AT with field corn. BT content was too low to detect in field corn.We first quantified the content of BT and dissected its genetic architecture in an association panel in maize. A total of 32 SNPs explaining 81.42% of phenotypic variation were significantly associated with BT, indicating the additive effect in sweet corn kernels.The most significant SNP (chr5_199221258), located in GRMZM2G141975, accounted for 28.34% of phenotypic variation. The gene (GRMZM2G141975), which encodes an oligopeptide transporter, was also found to be significantly associated with AT and RT. The oligopeptide transporter is essential for embryonic development and expressed in both developing embryos and maternal seeds [36]. However,oligopeptide transporters are a large family of genes playing distinct functional roles [37]. The link between oligopeptide transporter and vitamin E remains unknown. Arogenate dehydratase and prephenate dehydratase (ADT2), which synthesize L-phenylalanine from L-arogenate in the tyrosine metabolism pathway, were identified in RT3. The intermediate in the tyrosine synthesis pathway,HGA,is the substrate of the vitamin E biosynthesis pathway [38]. This result suggests that ADT2 regulates tocotrienol content in sweet corn kernels,in agreement with a previous study [16]. 3-deoxy-D-arabinoheptulosonate 7-phosphate synthase (DAHPS) which catalyzes the first committed step in chorismate biosynthesis,was also identified in RT3. Chorismate mutase 2, which catalyzes the first committed step in Phe and Tyr biosynthesis, was associated with RT3. Chorismate mutase 2 which located in the cytosol converted chorismate to prephenate[39]. Both DAHPS and chorismate mutase 2, involved in Tyr biosynthesis, regulate vitamin E biosynthesis [40]. The three genes explained little phenotypic variation compared with ZmVTE4, owing to the indirect effect on tocochromanols in sweet corn kernels (Fig. 1). Gamma-glutamylcysteine synthetase (GSH1) which synthesizes glutathione from L-cysteine and L-glutamate, was identified in three tocopherols (AT, BT,and TT).Glutathione,as a hydrophilic metabolite,is one of the most crucial antioxidants in plants [41]. It is interesting that overexpressing gamma-glutamylcysteine synthetase gene has been reported to improve rice yield at tolerance environment [42]. Thus, GSH1 not only was significantly associated with tocopherols,but also might have potential for improving sweet corn yield.

Fig.4-Haplotype effects of two markers(InDel7 and InDel118)from ZmVTE4.Hap1,Hap2,and Hap3 represent genotypes of 0/0,0/118,and 7/118,respectively.Numbers in brackets are the numbers of genotypes belonging to each haplotype group.P-values were estimated based on Student’s t-test.
4.3. Potential applications of this sweet corn panel
GWAS is a powerful tool for dissecting genetic architecture and identify candidate genes in plants. Aranzana et al. [43]identified flowering-time and pathogen-resistance genes using a GWAS approach in Arabidopsis in 2005. To date,dozens of association panels have been constructed from hundreds of inbred lines and have been used to dissect genetic architecture or clone new genes of complex traits,including yield traits [44,45], nutritional traits [46,47], leaf architecture [48,49], and disease resistance [50,51]. We constructed an association panel in sweet corn that showed wide phenotypic variation in both agronomic and vitamin E traits.We detected ZmVTE4, confirming the genetic diversity in this panel. In the last decade, key genes controlling relatively simple traits have been successfully introduced into crops,leading to greatly improved nutritional value [52,53]. Using functional markers of β-carotene biosynthesis pathway identified from candidate gene association, high provitamin A lines have been obtained via MAS in field corn and sweet corn[54,55]. In the present study, we introduced two functional markers of the vitamin E biosynthesis pathway into two sweet corn cultivars showing increased tocopherols. Thus, the natural variation in quantitative traits in the sweet corn panel has great potential for improving traits of interest.Further nutritional traits of sweet corn will be investigated in the future.
Hundreds of significant sites detected in this study would provide insights into the genetic architecture of vitamin E in sweet corn.However,there were still some limitations in this panel. First, the sample size was relatively small (204 inbred lines) compared with the large populations of rice (950 worldwide rice accessions) [44] and field corn (5000 lines)[56]. Increasing the sample size would improve power [57].Second, the marker density was limited. GBS has been developed and applied in marker discovery and genotyping since next-generation sequencing technologies were developed [27]. However, GBS has a limitation in marker coverage due to library construction with restriction enzymes, especially in maize, which has a large genome. The SNPs density detected by GBS in this study was lower than that generated by whole-genome sequencing (WGS) and RNA-sequencingbased genotyping. A larger sweet corn panel should be constructed to investigate comprehensively the genetic architecture of vitamin E. Alternatively, the mapping resolution of the panel could be enhanced by deep sequencing, such as by WGS.
5. Conclusions
We performed GWAS with 150,124 SNPs to investigate the genetic architecture of vitamin E-content traits in sweet corn kernels. A total of 119 loci were found to be associated with eight vitamin E traits, including the known gene ZmVTE4 in the vitamin E biosynthesis pathway. After screening two functional markers in our panel, two sweet corn lines with high tocopherol content were developed. Dozens of genes were associated for the first time with vitamin E in sweet corn kernels. A network based on significant loci associated with vitamin E was constructed. This study improves our understanding of the genetic architecture of vitamin E and suggests the potential of biofortification in sweet corn kernels.
Supplementary data for this article can be found online at https://doi.org/10.1016/j.cj.2019.08.002.
AcknowledgmentsThis study was supported by the National Natural Science Foundation of China (31601309), Science and Technology Planning Project of Guangdong Province (2016B020233004,2015A020209063, 2017B090907023), Science and Technology Planning Project of Guangzhou (201804020081), Agricultural Development and Rural Work Special Project-Modern Seed Industry Enhancement Project of Guangdong (201788), the Excellent PhD Program of Guangdong Academy of Agricultural Sciences(2017).Declaration of competing interestOn behalf of all authors,the corresponding author states that there is no conflict of interest.

- The Crop Journal的其它文章
- ND-FISH-positive oligonucleotide probes for detecting specific segments of rye (Secale cereale L.)chromosomes and new tandem repeats in rye
- Genetic analysis of the seed dehydration process in maize based on a logistic model
- Quantifying the effects of short-term heat stress at booting stage on nonstructural carbohydrates remobilization in rice
- Association mapping for root system architecture traits under two nitrogen conditions in germplasm enhancement of maize doubled haploid lines
- Favorable haplotypes and associated genes for flowering time and photoperiod sensitivity identified by comparative selective signature analysis and GWAS in temperate and tropical maize
- Genome-wide association study in historical and contemporary U.S. winter wheats identifies heightreducing loci