
Measurements of plasma parameters in a hollow electrode AC glow discharge in helium
2020-04-24 05:49JingfengYAO姚静锋ChengxunYUAN袁承勋ZhiYU俞鸷ZhongxiangZHOU周忠祥andKUDRYAVTSEV
Plasma Science and Technology 2020年3期
Jingfeng YAO (姚静锋),Chengxun YUAN (袁承勋),Zhi YU (俞鸷),Zhongxiang ZHOU (周忠祥) and A KUDRYAVTSEV
Department of Physics,Harbin Institute of Technology,Harbin 150001,People’s Republic of China
1 Authors to whom any correspondence should be addressed.
Abstract
Keywords:hollow cathode discharge,AC glow discharge,plasma diagnostic
1.Introduction
In recent decades,the application of plasma technology has increased rapidly and an increasing number of plasma sources,including direct current discharge,radio frequency (RF)discharge,and alternating current (AC) discharge,have been used [1–6].Many researchers have shown an increasing interest in AC discharge and its applications in water treatment,the control of gaseous pollutants,and plasma-assisted combustion,among others [7–11].One important application of AC discharge,dielectric barrier discharge(DBD),has been utilized in many fields,e.g.the generation of ozone,surface treatments,the degradation of pollutant molecules,and aerodynamic control techniques[12,13].Among the different configurations of glow discharge,hollow cathode glow discharge is of considerable interest because of its extraordinary properties and broad applications [4,14–18].In our previous studies,hollow electrode glow discharge with an AC power supply was experimentally investigated,and the results demonstrated that the device presented a considerable advantage in terms of electromagnetic wave propagation in plasma [19–21].
Plasma diagnostic technologies have also been advanced with the rapid development of plasma sources,and have exhibited many improvements [22–24].There are three main types of plasma diagnostic methods,namely probe diagnostic,microwave diagnostic,and optical diagnostic methods.Optical diagnostic techniques include emission spectroscopy,absorption spectroscopy,and laser-induced fluorescence;these methods are particularly well-suited for plasma processing,and provide detailed information on the chemical and physical processes,as well as their interactions [25–29].Plasma frequency is often in the microwave range;therefore,microwave diagnostic methods,which primarily include cavity techniques and reflectometry,have also been used to measure plasma parameters,and are concerned with nonperturbing plasma measurements [2,22,30–32].Among these methods,Langmuir probe diagnostics are the most commonly used for low-pressure,weakly ionized plasma.
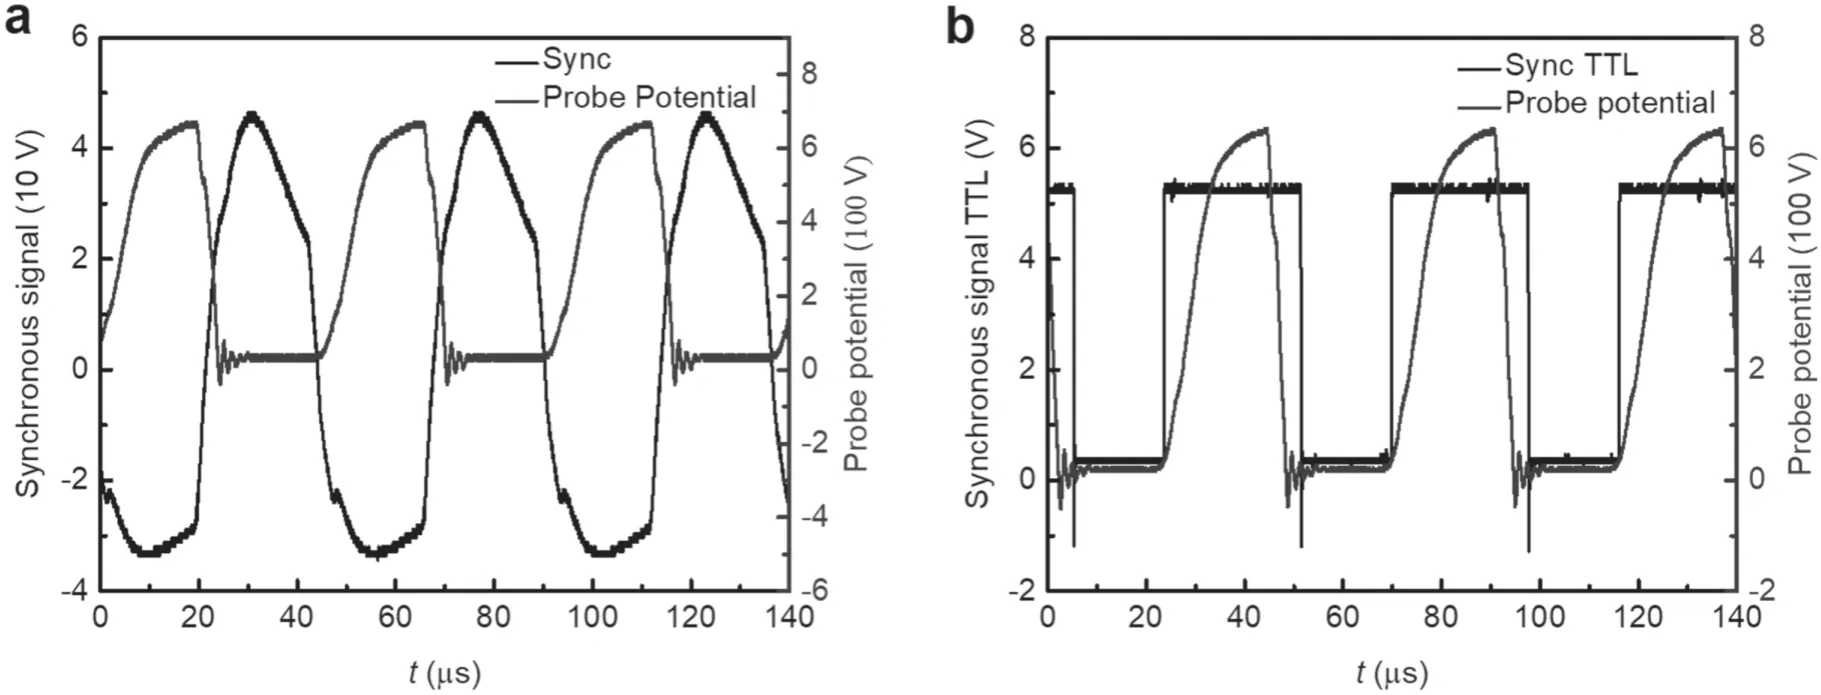
Figure 1.(a) The synchronous signal and the potential of the single probe over time.(b) The output synchronous signal (TTL) and the potential of the single probe over time.
Probe diagnostic methods have made rapid progress in recent decades,and,in addition to single probes,double probes and emissive probes have also been proven to be useful in various situations [2,22,25,33–36].A significant development in probe diagnostics was made by Druyvesteyn,who demonstrated that the second derivative of the single probe current provided the electron energy distribution function(EEDF)of the plasma[36,37].The probe diagnostic method has been used for measurements of EEDFs in many kinds of plasmas;specifically,Godyak et al successfully applied it to experimentally measure the characteristics of RF discharge,and made great progress in probe diagnostics[38–44].However,some problems occur when measuring the current–voltage characteristics because the floating potential of the probe usually fluctuates in various plasma sources.Many methods have been developed to extract data from probes in plasmas,examples of which include filtering methods and fast I–V scans [25].In the present study,an efficient method for measuring plasma parameters without the interference of a fluctuating electric field is proposed;it utilizes time-resolved measurements,a filter circuit,and a synchronization circuit.A hollow cathode glow discharge and an AC discharge are combined.The characteristics of the hollow cathode AC helium glow discharge are investigated in detail using the proposed design of the probe diagnostic method.
2.Experimental setup
Plasma is rarely quiet at all frequencies due to the abundant sources of free energy in the discharge.The potential of the single probe usually oscillates with the power supply,as shown in figure 1(a);the oscillation amplitude is very large,and changes for different discharge conditions.However,accurate probe measurements of the current–voltage characteristics require that the potential without bias voltage of the probe should be stable during probe diagnostics.In addition,some problems were encountered by the authors when trying to measure other kinds of discharges;for example,the frequency of the synchronization signal was sometimes unstable due to violent oscillation.Some frequency multiplications of the synchronization signal were detected,and this did not only occur at the main frequency;therefore,a filter was added at the start of the circuit.This had two effects:it filtered out the higher frequencies,and decreased the amplitude of the input synchronization signal,which protected the circuit from a very large current to some extent.Then,by adjusting the circuit,for example,by changing the resistance,the rising edge or the duty cycle of the signal could also be changed,which stabilized the signal and provided broader applicability.The original signal and the processed waveform are presented in figure 1(b),and it is evident that the circuit worked very well.The output synchronous signal(TTL)of the circuit was then connected to the impedance Langmuir probe system to obtain synchronized,time-resolved measurements.This allowed for the point at which the probe potential was stable to be chosen;a value close to zero was preferred in the experiments.Compared to the method of adding a filter component in the probe circuit,this method does not influence the current–voltage characteristics of the measurements,and a suitable point at which to measure the plasma potential can be determined prior to the experiments.
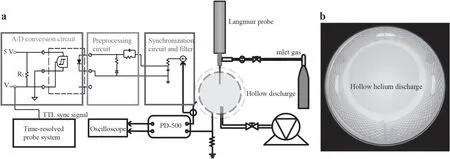
Figure 2.(a) The schematic of the experimental setup.(b) Coaxial gridded hollow electrode AC glow discharge in helium.
The probe measurements presented in this work were performed in a large-volume AC (20 kHz) glow discharge chamber with coaxial gridded hollow electrodes in helium.Additional detailed descriptions of the experimental setup are provided in our previous work[20,45].The schematic of the experimental setup is illustrated in figure 2(a),and has three main components:the synchronous signal processing circuit,the probe diagnostic system,and the vacuum system.The synchronous signal processing circuit includes the A/D conversion circuit,the preprocessing circuit,and the synchronization circuit with a filter.The main purpose of the synchronous signal processing circuit is to convert the synchronous voltage signal obtained by the Rogowski coil into a TTL signal that can be used for probe diagnostic measurement.First,the synchronous voltage signal is obtained by the synchronization circuit (Rogowski coil).Then,after the synchronous signal passes through the filter,double frequency waves and noise are filtered out.The preprocessing circuit is used to adjust the input power and the trigger potential for an A/D conversion circuit.Finally,a synchronous analog signal is converted to a standard synchronous TTL signal as the external trigger source for probe diagnostic measurement.Figure 2(b) shows the hollow electrode helium discharge of the device.The AC power supply was PD-500 and the power could be changed from 500 to 2000 W.The chamber was a hollow cylinder with a diameter of 400 mm and a length of 290 mm.The cylindrical gridded electrodes were fixed in the chamber and had diameters of 350 mm and 290 mm,respectively.The diameter of the single hole in the electrodes was 10 mm,and the distances between two adjacent holes in different directions were 10 mm and 17 mm,respectively.The probe tip was made of tungsten,and was 7 mm in length with a radius of 0.2 mm.The pressure of the helium was 80 Pa and the discharge power was 1200 W;the measurements were obtained at the center of the chamber.The current–voltage characteristics and the first and second derivatives of the current are presented in figure 3,from which it is evident that the results exhibited typical single probe characteristics.
Using the second derivate of probe currentIe″,the EEDF can be obtained as follows:
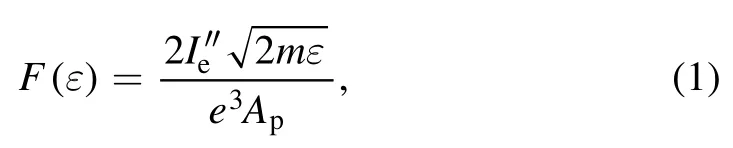
whereApis the collection area of the probe,ε=is the electron energy,and e and m are the electron charge and mass,respectively.The electron energy probability function(EEPF) is defined as:The EEPF and EEDF can be obtained directly from the measured value of the second derivativeIe″.The EEDF is normalized to the electron densityFor a Maxwellian distribution,the plasma density can also be obtained from the Langmuir formula:
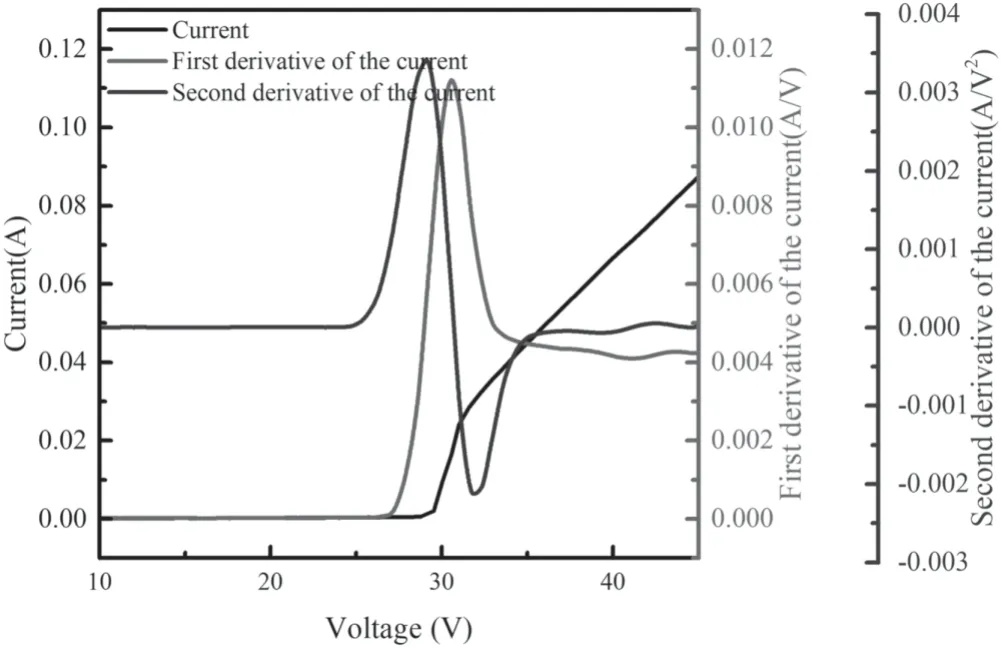
Figure 3.The current–voltage characteristics,first derivative,and second derivative of the probe.
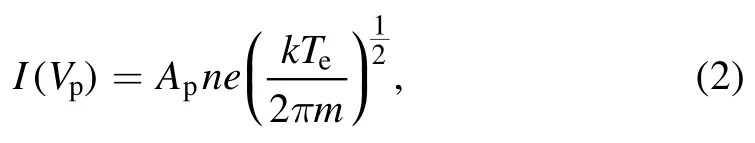
where ()I Vpis the electron saturation current,n is the electron density,k is Boltzmann’s constant,and Teis the electron temperature.The electron temperature can be obtained by using the following relationship:
From these theories,the electron density and electron temperature can be obtained.In this study,the characteristics of the discharge with the coaxial gridded hollow electrodes were investigated in detail.Specifically,the profile of the hollow electrode AC helium glow discharge plasma,the changes in the electron density at different input power values,and the changes in the electron density and electron temperature at different helium pressures were determined.The comprehensive and detailed diagnostics of the hollow electrode AC helium glow discharge plasma will be useful in applications that are based on this type of plasma source.
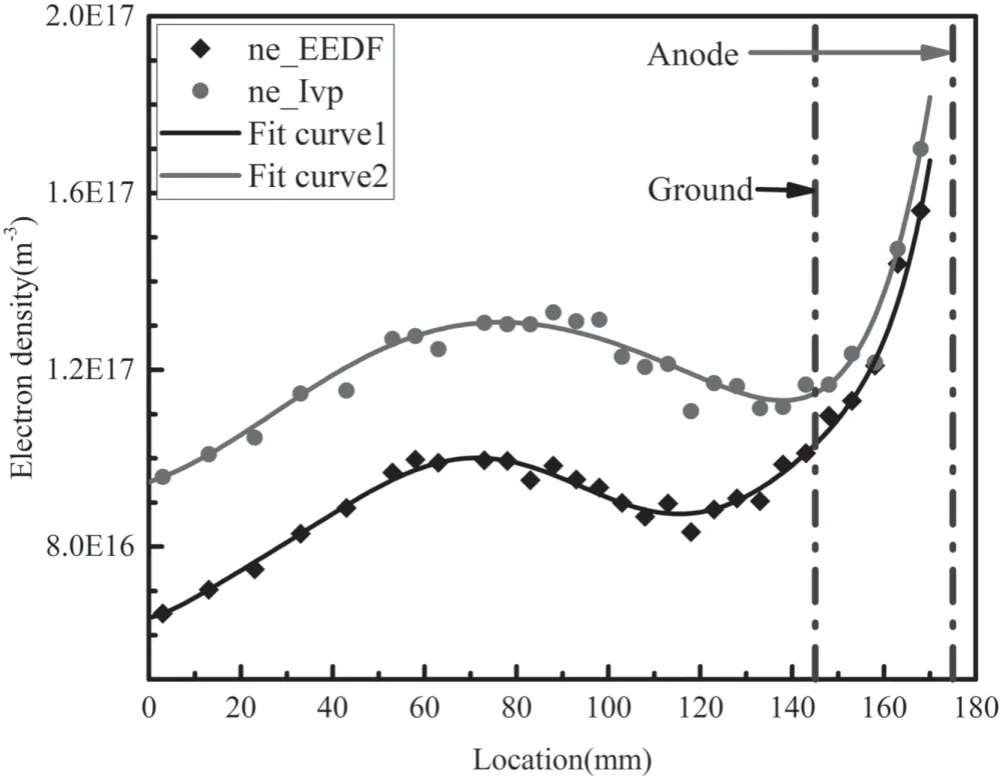
Figure 4.Spatial profile of the hollow electrode AC helium plasma.
3.Experimental results and discussion
3.1.Spatial profile of the coaxial gridded hollow electrode AC helium plasma
To study the characteristics of the plasma,it was necessary to determine its profile.Figure 4 presents the results of the plasma density in different locations,i.e.the spatial profile of the plasma in the cross-section at the center.The pressure of the helium was 80 Pa and the discharge power was 1400 W.The x-axis is the distance (mm)between the measured points from the center of the chamber,and the y-axis is the measured electron density (m−3).The black dots indicate the plasma density obtained by the EEDF method,the red dots are the plasma density obtained by the Langmuir formula,and the black line and red line are the corresponding fitted curves.On the right side of the figure,the two dotted lines indicate the position of the ground electrode (145 mm) and the anode(175 mm).The results show that the plasma density was almost uniform over the cross-section of the chamber,but the maximum value of the density slightly shifted from the center(x=0 mm) to x=50–100 mm.Additionally,from 0 to 50 mm,the electron density increased to its maximum in the form of a trigonometric function.The plasma in the hollow chamber was diffused from the electrodes,and the ambipolar diffusion equation is as follows:
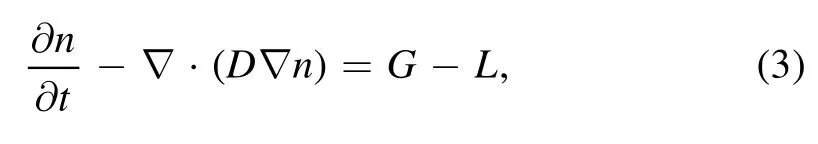
whereDis the ambipolar diffusion coefficient,and the created and lost particles are designated as G and L,respectively.It was assumed that the plasma was in a steady state during the time of measurement,there was a balance between the created and lost particles,and the plasma density at the center of the chamber and the position of the maximum plasma density were nearly unchanged.Based on these assumptions,the particle flux was zero at the center of the chamber.This met the exact symmetry requirement due to the axisymmetric cylindrical hollow chamber.An analytical trigonometric solutionn(x)=n0sin(βx),can be obtained by solving the ambipolar diffusion equation with a constant coefficient D and zero boundary condition for plasma density;this was confirmed via experiments,as presented in figure 4.The right parts of the curves,which correspond to the top position of the hollow chamber,indicate that the plasma density decreased.This was caused by the plasma sheath of the ground electrode.
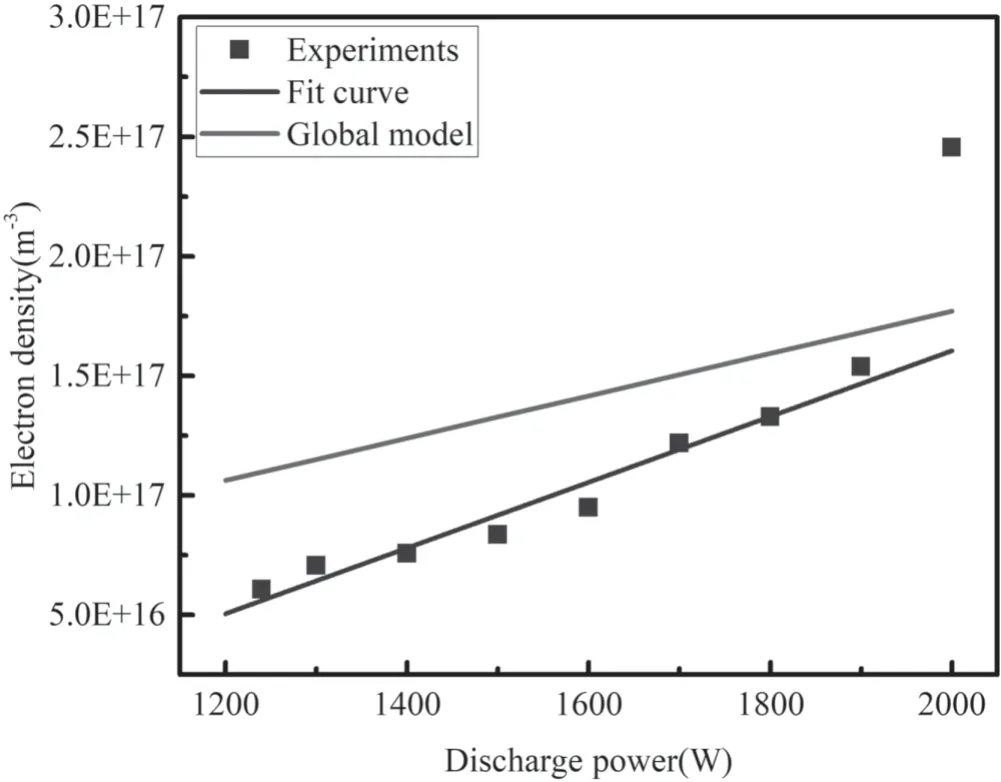
Figure 5.Plasma density versus input power.The blue dots are the experimental results,the blue line is the corresponding fitted curve,and the red line is the result calculated from the global model.
3.2.Changes in the plasma density for different input power values
At a helium pressure of 80 Pa,the plasma density increased as the AC power supply increased (figure 5).The blue dotted points indicate the experimental results of the electron density,the blue line is the fitted curve,and the red line is the electron density calculated by the global model [2,46–54]

wherePabsis the total absorbed power,uBis the Bohm velocity,Aeffis the effective area for particle loss,andεTis the total energy lost per electron–ion pair.The value ofεTused in this study was obtained from other experimental results[18,55].The results in figure 5 indicate that the plasma density increased as the input power increased,and the experimental results are consistent with the theoretical calculations.It is well known that the total current,which consists of electrons and ions,increases with the increase of power.The discrepancy between the global model and the experiment was visible for the maximum discharge power(2000 W).It is believed that this was due to two-step ionization at high plasma density,which is not considered in the global model.A more detailed description of two-step ionization is provided in the subsequent section.
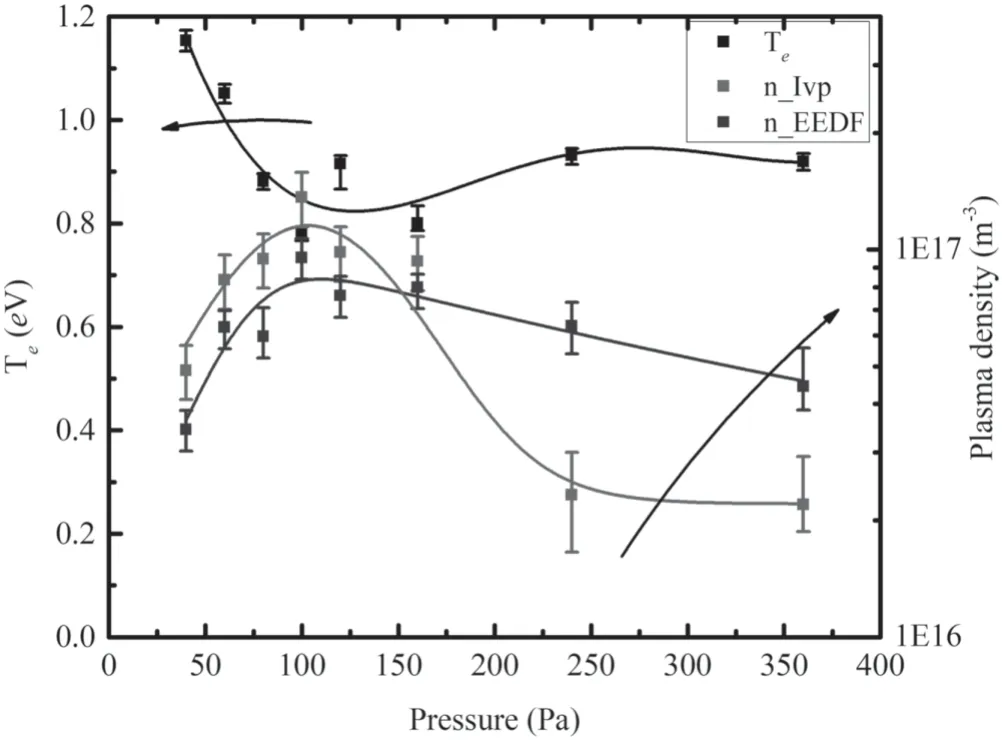
Figure 6.Changes in the plasma density and electron temperature at different helium pressures.The experimental results are denoted by symbols,the fitted curves are the solid lines,and the arrows on the curves indicate their corresponding axis.
3.3.Changes in the plasma parameters at different helium pressures
The characteristics of the plasma at different helium pressures are presented in figure 6.The probe was located at the center,and the helium was discharged at 1400 W.The x-axis represents the helium pressurep(Pa),the left y-axis represents the electron temperatureTe(eV),and the right y-axis represents the logarithmic electron (the arrows on the curves indicate their corresponding axis).The dark line is the electron temperature (electrons were assumed to have a Maxwellian distribution),and the red line and blue line are the electron densities obtained from the Langmuir formula and the EEDF,respectively.The results show that the electron density was the highest when the pressure was about 100 Pa;this is in good agreement with Paschen’s law.A negative correlation was observed between the electron temperature and the electron density;this is because the decrease in electron temperature with the increase of plasma density is typical for gas discharge at this input power and pressure.This is a result of two-step ionization,which requires a lower electron temperature at a higher electron density to provide the required ionization [51,55,56].
This trend is also reflected in the electron energy balance[57]:
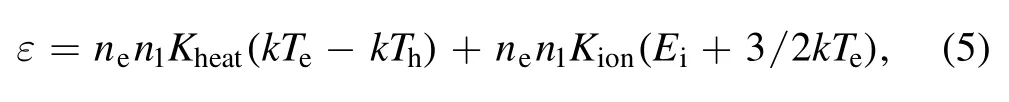
whereεis the power density,This the heavy particle temperature,Eiis the ionization energy,n1is the atom density at ground level,Kheatis the rate of heat transfer between the electrons and heavy particles,andKionis the rate of ionization(including stepwise ionization).ForkTh≪Te≪Ei,the equation can be simplified as follows:

At the same input power,the larger the electron energy loss,the lower the electron density.It should also be noted that in these experiments,the electron temperature was obtained from EEPF as the mean energy [44].
4.Conclusion
In this study,the plasma parameters and the characteristics of coaxial gridded hollow cathode AC helium plasma discharge were respectively measured and investigated in detail by using a probe diagnostic method based on improvements of existing diagnostic technology.The proposed probe diagnostic design or similar approaches can solve the significant problem of plasma potential fluctuations when measuring plasma parameters in experiments.This method has many advantages over other technologies,for example,artificial active control rather than passive adjustment can be achieved.The experimental results provide a clearer understanding of the electron density distribution in the chamber.The characteristics of the plasma parameters for different discharge power values and helium pressures were determined.The calculation results of the global model and the theoretical discharge results were compared with the experimental results,and it was found that they were in good agreement.The determination of the characteristics of the hollow cathode AC helium discharge is helpful for applications of the hollow discharge device,such as electromagnetic wave propagation in plasma,water treatment,and plasma metamaterials.
Acknowledgments
The research has been financially supported by National Natural Science Foundation of China (No.11775062).
ORCID iDs
 Plasma Science and Technology2020年3期
- Plasma Science and Technology的其它文章
- Three dimensional nonlinear shock waves in inhomogeneous plasmas with different size dust grains and external magnetized field
- Study of ionic wind based on dielectric barrier discharge of carbon fiber spiral electrode
- Theoretical research on the transport and ionization rate coefficients in glow discharge dusty plasma
- Study on plasma cleaning of the large-scale first mirror of the charge exchange recombination spectroscopy diagnostic on EAST
- Decomposition of dioxin-like components in a DBD reactor combined with Hg/Ar electrodeless ultraviolet
- Investigation of the self-induced magnetic field characteristics in a pulsed plasma thruster with flared electrodes