
The far-field plasma characterization in a 600W Hall thruster plume by laser-induced fluorescence
2020-06-14 08:45XingyueDUAN段兴跃XiongYANG杨雄MousenCHENG程谋森NingGUO郭宁XiaokangLI李小康MogeWANG王墨戈andDaweiGUO郭大伟
Plasma Science and Technology 2020年5期
Xingyue DUAN (段兴跃),Xiong YANG (杨雄),Mousen CHENG (程谋森),Ning GUO (郭宁),Xiaokang LI (李小康),Moge WANG (王墨戈) and Dawei GUO (郭大伟)
1 College of Aerospace Science and Engineering,National University of Defense Technology,Changsha 410000,People’s Republic of China
2 Science and Technology on Vacuum Technology and Physics Laboratory,Lanzhou Institute of Physics,Lanzhou 730000,People’s Republic of China
Abstract
Keywords:laser-induced fluorescence,Hall thruster,ion velocity distribution function,optical diagnostic
1.Introduction
Hall thruster is currently one of the main space electric propulsion technologies.Compared to traditional chemical propulsion,Hall thrusters are characterized by higher specific impulse and more simple system structure [1,2].Although the technology readiness level of Hall thruster has reached the highest level,some physics governing the generation and acceleration of plasma demands increased understanding,and therefore the comprehensive characterization of plasma both in the discharge channel and in the plume is critical to deeply understand and interpret the complex phenomena within the Hall thrusters.
In the past decades,several plasma diagnostic techniques have been developed by many researchers.These techniques can be divided into two categories:physical probe (such as Langmuir probe[3,4],emissive probe[5],retarding potential analyzer(RPA)[6],B-dot probe[7]and E × B probe)[8,9]and optical diagnostics(such as optical emission spectroscopy(OES)[10–12],laser induced fluorescence(LIF)[13–15],and cavity ring-down spectroscopy (CRDS) [16]).However,the physical probes are inevitably contact with the plasma during experiment,which is called intrusiveness.For example,the surface of the Langmuir probe will establish a sheath when inserting into the plasma,and the sheath is almost impossible to be quantified,which make the probing results questionable,but still qualitatively reliable.LIF diagnostic technique,based on the Doppler effect,by contrast,is attractive for its nonintrusiveness,which can guarantee the high fidelity of diagnostic results.Since the first application of LIF to the diagnostic of Hall thruster plume[17],it has been widely used in many other electric propulsion devices,such as gridded ion thrusters and helicon thrusters [18,19].
For medium power Hall thrusters less than 1 kW,the ranges of LIF measurement mainly focus on the discharge channel and near-field plume [20–25],the plasma in the farfield plume is less probed.The near-field plume usually ranges from the exit plane to 1.5 times the channel outer diameter distance downstream of the exit plane in the axial direction,while the far-field plume is beyond.In addition,the far-field plume may be the zone where the ion attains its maximum velocity,which is related to the specific impulse,a very important performance parameter for Hall thrusters.More importantly,the ions in the far-field plume may show different characteristics from the near-field plume.Therefore,characterization of far-field plume plasma is essential to comprehensively understand the ion dynamics properties,and construct a complete picture of plume plasma within a medium power Hall thruster.Moreover,the measurement results can provide data for the validation of numerical simulation and provide data that can be incorporated into the appropriate models to assess the influence of the ion plume impingement on the spacecraft.
In this work,LIF measurements are performed in the farfield plume,100–300 mm downstream of the exit plane of a 600 W laboratory Hall thruster to probe the singly ionized xenon velocity.From the microscopic perspective of IVDF to the macroscopic perspective of most probable velocity,ion temperature,accelerating potential and electric field,the plasma properties in the far-field plume are analyzed and discussed.
2.Experimental setup
2.1.Hall thruster system
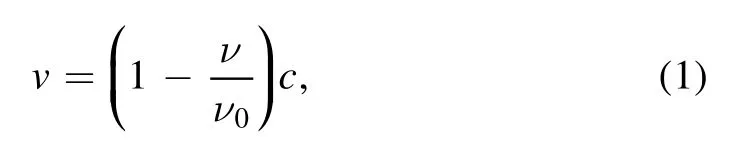
The thruster used in the study is a 600 W Hall thruster developed by Beamed Energy and Electromagnetic Propulsion Laboratory,figure 1 sketches the structure and key dimensions of this thruster.The magnetic circuit consists of one inner magnetic coil,four outer separate magnetic coils and several magnetic cores.The discharge channel,which is made of pure boron nitride,has a 22 mm inner radius,a 34 mm outer radius and a depth of 25 mm between the exit plane and the anode located on the bottom of the discharge channel.This hollow cathode used in this experiment is developed by Science and Technology on Vacuum Technology and Physics Laboratory,and the maximum emitting current is 5 A with a LaB6emitter.The nominal operating parameters for the thruster are listed in table 1.The experiment is conducted in the VM-2400 vacuum chamber,with a diameter of 2.4 m and a length of 3 m,the chamber pressure with thruster firing at nominal condition is approximately 2.8 × 10⁻³Pa(corrected for xenon).The thruster is mounted on chamber centerline to minimize the interaction of the plasma with the walls of the facility.The thruster and the hollow cathode are both fed with 99.999%xenon gas,figure 2 shows the pictures of the front and side view of plume with thruster firing at nominal condition.The Cartesian coordinate system and the origin used are shown in figure 1,where r=0 mm represents the thruster centerline,z=0 mm represents the exit plane.The LIF measurement locations are marked as blue dots.Moreover,in order to minimize the influence of the cathode on the experimental results,the interrogation plane is horizontal (i.e.parallel to the optical table,and will not intersect the hollow cathode),and figure 1 is just intended to include all the elements.
2.2.LIF diagnostic technique
A light source with vacuum wavelengthλand frequencyν=c/λis considered.When an ion is moving along the direction of the photon’s wave vector,the ion absorbs the photon at a shifted frequency which is different from that when the ion is at rest.This Doppler effect appears as a shift in the resonant frequencyν0as the laser is scanned over a very short frequency range (or wavelength range).The magnitude of the frequency shift depends on the velocity v along the laser beam axis as follows [26]:
where c is the speed of light in vacuum.More details about the LIF physics and its application can be found in references [27,28].

Figure 1.A schematic diagram of the 600 W Hall thruster geometry and measurement ranges.
Figure 2.Photographs of the Hall thruster plume operating at nominal condition.

Table 1.Parameters for the nominal condition.
Figure 3 illustrates the transition scheme for LIF measurement of xenon ion.This scheme is widely used for three reasons.First,the lower state of this scheme is metastable,which has the advantage of a relatively large population to be excited and therefore this scheme will generally provide a relatively higher signal-to-noise ratio (SNR) than other schemes.Second,the scheme is non-resonant,and third,the hyperfine structure constants are well established.Moreover,the wavelength in this scheme is accessible by the dye laser which is available to our laboratory while not easily accessible by the commercial diode lasers used by some researchers [29–33].To sum up,the choice for this transition scheme is a combination of the advantage of the transition itself and the accessibility of the laser wavelength.

Figure 3.Xe II transition scheme for LIF spectroscopy.

Figure 4.The LIF setup for the measurement of axial velocity.
Figure 4 depicts the LIF setup for the measurement of axial ion velocity.The laser used is a Sirah tunable dye laser located in a clean room,with a linewidth of about 250 kHz and a maximum output of 750 mW at 605.1 nm.As shown in the figure,the laser beam first passes through a beam splitter,and 10% of the laser power goes into the power meter for monitoring the power of the laser beam,while the remaining is sent to the second same beam splitter for the monitoring of the wavelength,and then the main laser beam is chopped at 1 kHz by a mechanical optical chopper for phase sensitive detection and directed to the center of a focusing lens (diameter 25.4 mm,focal length 1000 mm) in the vacuum chamber by several mirrors.Inside the chamber,the laser beam is focused to be a light spot with a diameter of 1.5 mm by the lens.The laser power at the probing volume is about 100 mW,moderately saturated to improve the signal to noise ratio of the fluorescence signals.The thruster is mounted on a 3-axis orthogonal translation stage with its centerline parallel with the laser beam.The travel distance of the translation stage is 400 mm for each direction.
When the ions in specific state are excited to a higher energy state by the incident laser and then decayed to a lower energy state,the fluorescence is emitted.The emitting fluorescence is focused into a 200 μm,0.22 NA fiber by a lens in the collimator,which is placed 45° relative to the incident laser beam.To protect the collimator from the plasma,a quartz window is set in front of the collimator.The fluorescence collimated is fiber-coupled to the monochromator through a fiber feedthrough on the chamber wall.The grating inside the monochromator only permits fluorescence at the wavelength 529.2 ± 1 nm to pass through to a photomultiplier tube (PMT),which converts optical signal to electrical signal.This electrical signal is next sent to a Stanford Research Systems SR830 lock-in amplifier which is set to extract signals at the optical chopper frequency.The optical chopper is also connected to the SR830,which is used for the phase-sensitive detection.For each operating condition and each probed location,a LIF trace of approximately one thousand points is scanned over a range of 0.04 nm,with the laser operating in a constant power mode.

Figure 5.Absorption spectral lineshapes of the reference cell.
Several factors affect the line shape and give rise to broadening and/or shift of the spectral line.Theoretically,the resulting spectral lineshape is the convolution of hyperfine splitting,natural broadening,power broadening and the dominant Doppler effect.Other factors may affect the spectral lineshape include Zeeman effect and Stark effect,which is originated from magnetic and electric field,respectively.But it was confirmed in previous studies that these effects are too small,and thus are neglected.The linewidths/shifts for different factors are listed in table 2 for clarity.To extract the ion velocity distribution function from the raw LIF trace,the Gauss inverse filter is used to perform deconvolution to remove the effect of these factors.More details about the deconvolution method can be found in [26].

Figure 6.Xe+ axial VDFs along radial direction at (a) z=100 mm,(b) z=200 mm,and (c) z=300 mm.

Table 2.Linewidths/shifts for different factors.
To determine the Doppler shift,a low pressure seethrough xenon hollow cathode discharge lamp(reference cell)is placed on the location of the thruster with the same optical setup during Hall thruster LIF measurements,to provide a stationary absorption reference.This calibration process repeats four times,and the average value is taken to extract the resulting IVDF.After subtracting off the mean background light signal recorded at wavelengths near the limits of the laser scan,the absorption reference lineshapes are depicted in figure 5.
The uncertainty of measured velocity is associated with the determination of the magnitude of the Doppler shift relative to the reference[20,34–37],which is thus dependent on the accuracy of wavelength measurements.The laser wavelength is monitored by a Bristol Instruments 621 wavelength meter with the accuracy of ±0.0002 nm,so the uncertaintyΔvin velocity is 99 m s-1,and the uncertainties for the temperature,accelerating potential and electric field are:

where +mXeandTionare xenon ion mass and temperature respectively,e is the elementary charge.ΔTion,ΔUaccand ΔEaccare the uncertainties for ion temperature,accelerating potential and electric field,respectively.
3.Results and discussion
In order to study the plasma properties within the far-field plume of the medium power Hall thruster,we perform tens of LIF scans from the thruster centerline (r=0 mm) to 50 mm in radial direction,from 60 to 300 mm downstream of the exit plane in axial direction,with the thruster firing at nominal condition and off-nominal conditions.The deconvolved and calibrated IVDFs are present,and the bimodal IVDFs are analyzed.In addition,the ion temperature,most probable velocity,accelerating potential and electric field are extracted and computed.
3.1.Ion velocity distribution function (IVDF)
Figure 6 is a contour plot of the Xe+axial VDF measured along the radial direction on three different axial locations at nominal condition.As can be seen in figure 6(a),at z=100 mm,the ion bulk velocity varies from 16.5 to 19 km s-1.The IVDF clearly splits into two parts at the channel centerline (r=28 mm),and the axial velocity difference of these two parts is up to 2 km s-1.It can be inferred that this IVDF comprises two ion populations,correspond to the higher velocity population and lower velocity population,respectively.Apart from this,two-populations phenomena range from r=20 mm to r=44 mm,and the LIF signal magnitude from the lower-velocity population is basically smaller than the higher-velocity population,the explanation for the two populations will be discussed later.
Figures 6(b) and (c) show the contour plot of IVDF at z=200 mm and z=300 mm.As can be seen,the distribution appears as one ‘band’,indicating just one peak in the IVDF.In figure 6(b),the ion populations spread much wider in radial locations where r > 28 mm than the locations where r < 28 mm,but the velocity is basically in the same range of 18–19 km s-1.Whereas the IVDFs at z=300 mm are much more uniform.

Figure 7.Bimodal velocity distributions and the fitted results.
Compared the IVDFs at z=100 mm to the IVDFs at z=200 mm and z=300 mm,figure 6(a) reveals that the plume plasma is more complex as approaching the exit plane of Hall thruster,where the plasma IVDF may exhibit bimodal,even three-peaks characteristics.
As stated above,some radial locations at z=100 mm exhibit bimodal IVDFs.Figure 7 displays the bimodal IVDFs measured in the experiment and the fitted results,and a single-peak IVDF (figure 7(a)) for comparison.As depicted in the figures,the bimodal IVDFs are observed at radial distances greater than channel inner radius in the far-field plume,which is quite different from that of the near-field plume where bimodal IVDFs occur in the central core region for the same power Hall thruster [22].

Figure 8.Xe+ axial VDF along axial direction on the thruster centerline.

Figure 9.The raw LIF trace and fitted curve at z=80 mm,r=0 mm.
To capture and analyze the ion axial acceleration characteristics in the far-field plume of medium power Hall thrusters,the IVDF ranging from z=60 mm to z=300 mm on the centerline of Hall thruster is measured and illustrated in figure 8.As can be noticed,the ion velocity is gradually increasing from near-field plume to far-field plume,eventually to a maximum most probable velocity of about 19 km s-1,which reveals that the ion is accelerating from the channel to the far-field plume,and the location for the maximum axial velocity of the Hall thruster is about z=300 mm,r=0 mm.
3.2.Most probable velocity and ion temperature
Generally,to quantity the ion velocity and temperature,a fitting process is needed.The most frequently used fitting function is Gaussian distribution.For the single-peak LIF trace,one Gaussian function is adequate.However,for the bimodal LIF trace,the sum of two Gaussian functions is used [38]

whereTion,1/2is the temperature for the first and the second ion population,v1/2corresponds to the ion most probable velocity,kBrepresents Boltzmann constant.Theoretically,the mean velocity can be calculated from the raw LIF trace using integration method.However,this method is generally susceptible to the data scatter,especially when the signal to noise ratio is low.Different from the mean velocity,the most probable velocity mainly depends on the peak location and the fitting function is not susceptible to the data scatter.Therefore,the most probable velocity and ion temperature are used to assess the ion properties.Figure 9 gives an example of how the data scatter influences the mean velocity.The computed mean velocity with raw LIF data is 8.7536 km s-1,and the most probable velocity with Gaussian fitting is 17.836 km s-1.It is apparent that the difference between this two velocity is significant even though the signal to noise ratio is 38,which demonstrates that the choice of most probable velocity is rational.
The Xe+most probable velocity and temperature as a function of radial position at z=100 mm,z=200 mm,and z=300 mm are plotted in figures 10–12,respectively.The associated errors are also illustrated in these figures.However,because of small values for the temperature uncertainty,just around the same size as the data dots,the associated error bars are not drawn in the temperature distribution.In figure 10,the data in the blue and red dashed rectangle correspond to the bimodal IVDFs,and thus are plotted separately.It can be seen that the velocity of the first ion population varies a little,but the velocity of the second ion population decreases with the increase of radial distance.The ion temperature curves show periodic oscillating while the overall magnitude tends to decrease.
The ion most probable velocity in figure 11(a) is within the range of 18–19.5 km s-1,and varies a little.As shown in figure 11(b),the ion temperature increases with the increase of radial distance,and then decreases,the maximum temperature is 1.12 eV at r=42 mm.With the axial distance increasing to 300 mm from 200 mm,the ion is still accelerating with the bulk velocity reaching 19 km s-1.However,the ion temperature at z=300 mm oscillates dramatically,and the magnitude varies from 0.2 to 0.8 eV.
3.3.Accelerating potential and electric field
The accelerating potential Uaccis important to estimate how much energy is used for the ion acceleration.It can be derived from an energy conservation equation:

Figure 10.(a) Xe+ most probable velocity and (b) temperature at z=100 mm.

Figure 11.(a) Xe+ most probable velocity and (b) temperature at z=200 mm.

Figure 12.(a) Xe+ most probable velocity and (b) temperature at z=300 mm.

And the electric field E can be directly derived from the accelerating potential

Without any smoothing of the ion velocity distribution mentioned in reference [27],the results of accelerating potential and electric field are plotted in figure 13.As can be seen in figure 13(a),the accelerating potential varies a little as a function of radial distance except the case of z=100 mm,where two kinds of ion populations exist,and the green curve corresponds to the lower velocity ion population.In the range of r=0 mm to r=28 mm,the accelerating potential is increasing from z=100 mm to z=300 mm.The electric field seems to oscillate around 0 V cm-1as a function of radial distance.
Figure 14 shows the accelerating potential and electric field on thruster centerline as a function of axial distance from z=60 mm to z=300 mm with thruster firing at nominal condition.It can be clearly seen that the accelerating potential increases from 203.5 to 245.2 V,and the electric field gradually decreases with the increase of axial distance.
3.4.Influence of discharge voltage

Figure 13.The accelerating potential (a) and electric field (b) as a function of radial distance.

Figure 14.Accelerating potential and electric field on the thruster centerline as a function of axial distance.
In order to investigate more deeply the influence of discharge voltage on the ion dynamics,three off-nominal discharge voltage conditions are measured.Figure 15 illustrates the Xe+most probable velocity and temperature on thruster centerline for a discharge voltage ranging from 250 to 400 V.To protect the collection optics from impinging of the plume plasma,the starting location is moved further to 180 mm downstream of the exit plane for the discharge voltage of 400 V compared to other discharge voltage conditions in this experiment.
From the velocity curve for the discharge voltage of 350 V in figure 15(a),it can be easily inferred that the ion is still accelerating beyond 300 mm downstream of the exit plane,but its maximum velocity is supposed to be smaller than 22.5 km s-1,which is the maximum velocity for the 400 V condition.From the perspective of energy conversion,the greater discharge voltage means that the ions can be accelerated to further position downstream of the exit plane,that is the further location for the peak velocity.However,as the discharge voltage increases from 250 V to 400 V,the ion velocity peaks at 220 mm,300 mm,greater than 300 mm and 260 mm,respectively,which indicates that the position for the peak velocity is shifted toward the exit plane when the discharge voltage is ramped up.Therefore,it can be easily inferred that the potential energy is not completely converted to the ion axial kinetic energy.First,part of potential energy may be spent on the generation of Xe2+ion,even Xe3+ion for higher discharge voltages.Second,a part is converted to the ion radial kinetic energy because of the plume divergence.In addition,the tendency of the ion temperature on the thruster centerline seems roughly contrary to the velocity,and the maximum temperature of ion reaches 1.06 eV for the 400 V condition.
3.5.Discussion about the axial bimodal IVDF
In order to deeply explore the origin of the axial bimodal IVDF,the incident laser beam is adjusted to be perpendicular to the thruster axis,and the radial ion velocity distributions at the nominal operating condition are measured and calibrated.The distributions of IVDF at z=100,200 and 300 mm downstream of the exit plane are given in figure 16.Positive radial velocity means that the ion moves away from the thruster centerline.It is clear that the bimodal IVDF dominates in the radial IVDFs for the probed locations,and two peaks can be identified by the fluctuation amplitude of the noise.In addition,from z=100 mm to z=300 mm,the radial maximum velocity decreases gradually.The most obvious feature is that the radial velocity on the thruster centerline is symmetric,which is consistent with the results of BHT-600 [22].
Combined the axial and radial IVDFs,it poses a question that how to correlate the one-peak axial IVDF and the twopeaks radial IVDF.Huang previously stated that,in general,the IVDFs exhibit multi-peaked behavior in two types of locations,the acceleration zone and near the channel walls[32],the far-field plume is not included.Hargus also identified some radial and axial IVDFs exhibit two peaks[36].But they did not give the corresponding relations between the radial and axial velocities.So to avoid ambiguity,we turn to adopt the resultant velocity to plot ion velocity vector field.Because the radial velocity at r=0 mm is symmetric with respect to the thruster centerline,the ion velocity on the centerline is purely axial.However,at z=100 mm and 0 < r < outer channel radius,the ions seem to diverge outward consistently.Beyond the outer radius in the radial direction,the radial IVDFs exhibit only one peak.Based on the ion velocity vector field in the far-field plume(z ≥ 100 mm) and the results in the near-field plume(z < 100 mm) in the BHT-600 [22],the plume structure can be outlined with lines of different colors as shown in figure 17,with the ion velocity vectors overlaid as red arrows.The blue and green lines originate from the channel centerline at the exit plane,and diverge outward and inward respectively.The purple lines originate from the inner radius of the discharge channel and diverge inward.The ions from the opposite sides of the annulus along the green and purple lines flow inward,meet and begin to interact downstream of the exit plane,which is consistent with that the ions on the centerline diverge outward and inward with nearly the same radial velocity magnitude.The ions bounded by the green lines downstream of the exit plane consist of different populations,including the ions generated in channel and then accelerated by the electric field into the plume and the ions coming from the opposite side of the channel.At z=100 mm and r > 44 mm,the ions in zone 1 are out of the interaction zone of the ions accelerated out of the channel and the ions coming from the opposite side of the channel,and therefore only one peak is detected in the axial IVDFs.However,the axial bimodal IVDF is not so clearly discernible in BHT-600 due to that the interrogation zones only extend 1.5 exit diameters (z < 100 mm) into the plume.

Figure 15.(a) Xe+ most probable velocity and (b) temperature variation with the discharge voltage.

Figure 16.Xe+ radial VDFs at (a) z=100 mm,(b) z=200 mm and (c) z=300 mm.
From the perspective of collisions,the small probability for the Xe I-electron inelastic collision in the far-field plume fails to explain the bimodal IVDFs and the ions originate from chargeexchange collisions between the xenon ion and atom fall in the slow velocity range,which would be less than 15 km s-1.
Respect to the discharge oscillations,we believe the IVDFs in the near-field plume,especially in the discharge channel are strongly influenced by the oscillations.However,the discharge oscillations are supposed to lessen further downstream in the far-field plume,but this demands more investigations.To sum up,the bimodal axial IVDF is merely a geometry effect of the annular discharge channel in the farfield plume.

Figure 17.Plume structure outlined by different colors.
4.Conclusions
Measurements of xenon ion velocity distribution function as a function of distance and discharge voltage are conducted in the plume of a medium power (600 W) Hall thruster.The IVDFs at different axial locations show different features.The bimodal IVDFs are measured at radial distances greater than the channel inner radius at axial distance of 100 mm,while the bimodal IVDFs are measured in the central core region of the near-field plume for the same power Hall thruster.The IVDF on the centerline indicates that the ion velocity gradually increases from near-field plume to far-field plume,eventually to a maximum most probable velocity of about 19 km s-1(z=300 mm,r=0 mm) at nominal condition.
In addition,the ion most probable velocity as a function of radial distance varies a little except the lower velocity populations in the bimodal IVDFs which show a decreasing trend with the increase of radial distance.The two-dimensional ion velocity vector field indicates that the bimodal axial IVDF is merely a geometry effect for the annular discharge channel in the far-field plume.The ion temperature curves at 100 mm downstream of the exit plane show periodic oscillating while the overall magnitude tends to decrease.Further at 200 mm,the ion temperature first increases,peaks at radial distance of 44 mm,and then decreases,while the ion temperature at 300 mm oscillates dramatically.The accelerating potential shows the similar trend as the ion most probable velocity,while the electric field oscillates around the value of 0 V cm-1in the radial direction.The accelerating potential increases from 203.5 to 245.2 V along the centerline,and the electric field peaks at 80 mm downstream of the exit plane,and then gradually decreases.
Finally,we find that when the discharge voltage increases from 250 V to 400 V,the ion velocity peaks at 220 mm,300 mm,greater than 300 mm and 260 mm,respectively.It indicates that the position for the peak velocity is shifted toward the exit plane when the discharge voltage is ramped up.It can be inferred that more energy may be lost on the generation of Xe2+ion,even Xe3+ion for higher discharge voltages.Besides,the velocity curve tends to be steeper with the discharge voltage before reaching the peak velocity.
Acknowledgments
This work is supported by National Natural Science Foundation of China (No.11805275) and Hunan Provincial Natural Science Foundation of China (No.2018JJ3592).
猜你喜欢
黄河之声(2022年6期)2022-08-26
美与时代·城市版(2022年3期)2022-04-25
歌海(2021年2期)2021-06-22
青年歌声(2021年2期)2021-03-05
心声歌刊(2021年6期)2021-02-16
音乐天地(音乐创作版)(2020年9期)2021-01-14
金桥(2020年9期)2020-10-27
金桥(2019年10期)2019-08-13
智慧少年(2017年8期)2018-01-10
小学阅读指南·低年级版(2016年12期)2017-01-05
 Plasma Science and Technology2020年5期
- Plasma Science and Technology的其它文章
- Investigation on the streamer propagation in atmospheric pressure helium plasma jet by the capacitive probe
- Numerical accuracy and convergence with EMC3-EIRENE
- Effects of trapped electrons on the ion temperature gradient mode in tokamak plasmas with hollow density profiles
- Contribution of joint experiments on small tokamaks in the framework of IAEA coordinated research projects to mainstream fusion research
- Underwater pulsed spark discharge influenced by the relative position between the top of a pin electrode and an insulating tube
- Investigation of the performance of CF3I/c-C4F8/N2 and CF3I/c-C4F8/CO2 gas mixtures from electron transport parameters