
Research on extraction and reproduction of deformation camouflage spot based on generative adversarial network model
2020-06-28 03:02XinYngWeidongXuQiJiLingLiWnninZhuJiyoTinHoXu
Defence Technology 2020年3期
Xin Yng , Wei-dong Xu , Qi Ji , Ling Li , Wn-nin Zhu , Ji-yo Tin , Ho Xu
a National Key Laboratory of Lightning Protection and Electromagnetic Camouflage, Amy Engineering University, Nanjing, Jiangsu, 210007, China
b Teaching and Research Office of Camouflage in Training Center, Army Engineering University, Xuzhou, Jiangsu, 221004, China
Keywords:Deformation camouflage Generative adversarial network Spot feature Shape description
ABSTRACT The method of describing deformation camouflage spots based on feature space has some shortcomings,such as inaccurate description and difficult reproduction. Depending on the strong fitting ability of the generative adversarial network model, the distribution of deformation camouflage spot pattern can be directly fitted, thus simplifying the process of spot extraction and reproduction. The requirements of background spot extraction are analyzed theoretically. The calculation formula of limiting the range of image spot pixels is given and two kinds of spot data sets,forestland and snowfield,are established.Spot feature is decomposed into shape, size and color features, and a GAN (Generative Adversarial Network)framework is established.The effects of different loss functions on network training results are analyzed in the experiment.In the meantime,when the input dimension of generator network is 128,the balance between sample diversity and quality can be achieved.The effects of sample generation are investigated in two aspects.Subjectively,the probability of the generated spots being distinguished in the background is counted, and the results are all less than 20% and mostly close to zero.Objectively, the features of the spot shape are calculated and the independent sample T-test is applied to verify that the features are from the same distribution,and all the P-Values are much higher than 0.05.Both subjective and objective methods prove that the spots generated by this method are similar to the background spots. The proposed method can directly generate the desired camouflage pattern spots, which provides a new technical method for the deformation camouflage pattern design and camouflage effect evaluation.
1. Introduction
Deformation camouflage technology is an important military protection method, which usually coats the designed camouflage pattern on the surface of the moving target in order to reduce the saliency of the target or hide the target in the background. The technology is now widely used in military personnel and weapons in various countries.The design of deformation camouflage mainly includes three aspects: the selection of main color, the design of spot shape and the configuration between spots.Among them,the design of spot shape is regarded to be consistent but not identical with the spot shape of the relevant color patches in the background area. Around this principle, scholars have carried out a lot of research, mainly focusing on two aspects.
On the one hand,feature description is established to extract the distribution of spot features in the background, or conditional distribution is established to evaluate the camouflage effect when the joint distribution is difficult to establish. The Octopus [1,2]method is an early method to describe spot shape. That is, by determining the center of gravity of the shape, a line segment is extended every 45°to contact the shape contour,and the length of each line segment is combined to form a feature vector. The accuracy of this method is too poor to measure the difference of different shapes effectively.The chain code[3]method is similar to the Octopus method. Although its accuracy can be effectively improved, it cannot measure the difference between shapes.Moment invariants [4] and Fourier descriptors [5] are invariant to rotation, scaling and translation. Translation and rotation invariance are needed to describe the shape features of camouflage spots.Size is one of the most important features of camouflage spots. If the size feature is described as a dimension alone,the consistency will be lost in the distance measurement.In addition,color features are actually closely related to spot shape features. The method we proposed above hides the assumption that color features and spot shape features are independent of each other. This assumption is not consistent with reality.In a word,the size of a spot area is also related to its color.
On the other hand, the background spot distribution is established according to the proposed feature description method, and then the spot shape is generated by the distribution function or the existing spot shape is evaluated to meet the requirements.Because of the defects in the way of describing spot features to varying degrees, it is very difficult to estimate the distribution of highdimensional features even in the case of given features, so it is not common to study the literature of spot reproduction.Literature[6] gives a template method of digital camouflage to generate pattern spots. In essence, it has been assumed that the proposed templates conform to the distribution of background spot shapes.
This paper aims to solve the problem of extracting and reproducing the features of camouflage spots by means of the strong distribution fitting ability of GAN network. The construction,training and optimization of GAN network are studied for specific problems. This provides a fast and effective way to solve the problem of camouflage spot design.
2. Related work
2.1. GAN
Generative Adversarial Network (GAN) was proposed by Goodfellow[7]in 2014, and it has made vigorous development. In recent years,many scholars have conducted a lot of research on the training, evaluation and structural design of the network [8-10].Different from the traditional neural network model, this network is an unsupervised network model, consisting of two networks of generator and discriminator. The generator is a generative model used to fit the distribution of data; the discriminator is a discriminant model used to judge the fidelity of the data generated by the generator and the real data. During the training, generators and discriminators are trained alternately to enhance each other's abilities.Practice has shown that the GAN network is very suitable for the distribution of more complex modeling problems.
GAN adopts a clever training method to realize the estimation of likelihood function. This training method avoids the repeated application of Markov chain learning mechanism to the calculation of partition function.It does not require the lower variational limit and approximate inference,thus greatly improving the application efficiency [11]. Let the sample data be x and x ~Pdata(x), and the random noise data be z and z ~Pnoise(z).The generator network G implements a mapping from z to x.According to relevant research,the effect of z data from Gaussian distribution is better than that from uniform distribution. The discriminator network D is used to distinguish real sample x from generated sample G(z). In the training process, on the one hand, D network should constantly improve its discrimination ability,that is,to maximize the expected value Ex~Pdata(x)(D(x))and minimize Ez~Pnoise(z)(D(G(z)));on the other hand, it should help G network training with its discrimination ability, that is, to fix network D and minimize the expected value.
Because GAN training requires two networks to do game training with each other,it needs to achieve Nash equilibrium[12].However,it is difficult to achieve this due to the influence of various random factors in the actual process, and problems such as mode collapse, gradient dispersion and gradient explosion often occur.Some scholars have made improvements to GAN, mainly reflected in the improvement of network structure, loss function, optimization algorithm and process. Arjovsky et al. [13] proposed WGAN,which uses Wasserstein distance instead of JS divergence (Jensen-Shannon divergence) [14] as a loss function with better smoothness. Besides, WGAN employs Lipschitz continuity constraints and adjustments to network details such as changing activation functions. In theory, these adjustments have thoroughly solved the problem of unstable training. Gulrajani et al. [15] then proposed using gradient penalty instead of parameter truncation to achieve faster convergence. With the emergence of GAN training mode in network structure, DCGAN, cGAN, BiGAN and infoGAN have emerged in different network structures for specific problem areas[9,16,17]. These networks optimize their own structure and improve the loss function to make the training process faster,more stable and robust. In view of the complexity of the nature of the problem of camouflage spot description and reproduction, the structure and training skills mentioned above are used for reference in the construction of the network, and different parameters are optimized through the verification experiment in this paper.
2.2. GAN + camouflage
Due to the advantages of the GAN model, the current camouflage research combined with the GAN model has gradually risen,and scholars have studied in various aspects such as texture migration,camouflage design,and camouflage detection.Alfimtsev et al. [18] designed a camouflage pattern generation system based on the characteristics of the deep neural network recognition system and human observers. The generated camouflage pattern was tested on the Faster-RCNN Inception V2 and Faster-RCNN ResNet101 recognition systems and achieved good results. Zheng Y.F. et al. [19] designed the DDCN-4C model through the Dense Deconvolution Network to accurately detect hidden camouflage people.The method they use is a discriminant model.Zhu J.Y.et al.[20]designed Cycle-GAN,which successfully realized the migration of the texture style of the zebra to the ordinary horse.This work is very instructive for the modeling of camouflage patterns.Yeh et al.[21] studied the semantic image restoration technology based on the GAN model, and this result can be directly transferred to the fixed target imitation camouflage design. In fact, for imitation camouflage, models that incorporate deep neural networks have evolved quite maturely.Due to the complexity of the problem,it is very difficult to directly fit the large-scale background with the GAN model for the deformed camouflage applied to the moving target.The network structure and the training amount will be quite large.
The structure of neural network usually needs fixed-size image input, and the size of camouflage spot is one of its important features.Therefore,it is considered that the camouflage spot is initially decomposed into three features of shape s, size m, and color c. In other words, it is necessary to apply network G fitting to joint distribution(s,m,c)~Pdata(s,m,c).Then the size of the spot shape is determined as uniform size to solve the problem of fixed input network data. Therefore, the whole structure can be optimized alternately by the objective function shown in Eq. (1).It should be noted that the decomposition of camouflage spots is independent without considering the background factors, but it is not independent when given a specific background area. This conjecture was verified in the fourth section of the experiment. This decomposition way of spot features enables calculations to be implemented quickly and efficiently, and it is just a matter of handing over the problems of describing the spot shape and establishing joint distribution to the generator.

3. Model framework
An overview flow chart of the proposed method for extracting and reproducing the deformed camouflage spots is shown in Fig.1.The spots pattern in the background is obtained by the process of clustering and morphological opening operations of the background image. Then, according to the parameters at the time of shooting, the spots pattern is screened according to the size requirement to establish a data set. Finally, the GAN model is designed to fit the spot features in the dataset. The trained model can be used directly to generate deformed camouflage spots.
3.1. Spot extraction
Currently,the main methods of extracting spot features include color clustering algorithm and region growing method. In this paper, the performance of spot shape algorithm is not discussed in detail. The AFK-MC2algorithm proposed by Olivier [22] et al., in 2016 is used to extract background spot shape. The algorithm improves the distribution of proposals to optimize the selection of initial points, as shown in Fig. 2. Among them, c1is the initial sampling point. d(x,c1) is the distance metric between the sampling points. This paper uses the Euclidean distance metric of RGB color space.X represents all the points to be clustered and|X|is the number of points.Get the first initial cluster point from the uniform distribution. With the proposal distribution q(x|c1) of the Metropolis-Hastings sampling method,a convergent sequence can be obtained, the last one of the sequence is the initial clustering point. Repeat this process to get all k initial cluster points. The algorithm greatly improves the speed of clustering. In the experiment,when the range of the background area is large,the amount of pixels can reach tens of millions, which can effectively improve the clustering speed.

In the process of spot extraction, too large or too small spots need to be discarded to ensure the accuracy of the camouflage design.Since the resolution of the current imaging device has many influence factors, the ground resolution L is determined according to the angle of view θ of the imaging device, the single row pixel amount M of the CCD,and the observation distance R,as shown in Eq. (3):

At present,the analysis of the size of camouflage spots is usually based on the visual angle threshold under the condition of human eye observation.According to this principle,Yi[23]thinks that the design observation distance of ground equipment deformation camouflage design is 800-3000 m,and the corresponding spot size is 0.72-2.70 m. In fact, satellite reconnaissance is the most important means of reconnaissance in current military confrontations.When calculating the relevant parameters,10 cm is generally used as the reconnaissance resolution of satellites in the industry.In the meantime, considering that the number of pixels is too small, it is impossible to distinguish different shapes of spots, which violates the design principle of camouflage spots.Therefore,it should be set to calculate the spot size in multiples.This paper recalculate it by 3 times standard.At a limit resolution of 10 cm,the spot size should be 0.3 m.Therefore,according to the proportional conversion of the data given by Yi et al.[23],the spot size should be 0.3-1.13 m.The calculation process of the pixel size Psof the spot size in the image is shown in Eq. (4). According to this formula, camouflage spots pattern with too large or too small size in the background can be calculated and discarded.

3.2. GAN architecture
The overall architecture of GAN network is shown in Fig. 2,which includes a generator network and a discriminator network.The input of generator network is Gaussian random sampling z,and the output is spot shape s, size m and color c. The input of the discriminator network is the output of the generator network,and its output represents the credibility of the samples from the real distribution. All the neurons in the network are multi-layer perceptron. In fact, the convolution neural network is superior to multi-layer perceptron in image processing as a whole.Considering two factors,a fully connected network is adopted.On the one hand,the output of the network has three quantities, and the color features and size features cannot be effectively expressed in the convolution network; on the other hand, after decomposing the spot features, the difficulty of learning the distribution has been greatly reduced. Experiments show that the fully connected network can better fit the data. The numbers following the word Dense in the block diagram in Fig. 3 represent the number of neurons.For the spot shape s,its binary spot image data is stretched row by row into vector data. Since the size feature is for image pixels,the color feature has been clustered into k when clustering,so both of them are encoded by one-hot method[24,25].The leaky ReLU activation function [24,26] is used in all activation layers of the network,which is an improvement of ReLU activation function and can effectively solve the problem that neurons are“dead”and cannot participate in gradient propagation.Its slope parameters are set to 0.2. The last activation function of the generator network is set to tanh function, which can generate regular data of [-1,1] interval. The last layer of the discriminator network uses linear functions directly.Arjovsky[13]et al.have proved that this setting can accelerate the convergence of the network and rapidly propagate the gradient. A batch normalization layer is set up in each block of the generator network, which is beneficial to the convergence of the network.After statistical calculation,there are 6 blocks for generator and 3 blocks for discriminator in the whole network, and there are nearly 38 million parameters to be optimized in total, which is a large amount of training. However,there are no prominent problems such as gradient dispersion or gradient explosion in actual training, so it is possible to achieve good convergence without using a residual module such as the ResNet[27] network.

Fig.1. Overview of deformed camouflage spot extraction and reproduction model.

Fig. 2. Network model structural diagram.

Fig. 3. Proposed model architecture.
The loss function is defined according to the Wasserstein distance and mean square error distance,and different performances are tested in experiments.The optimization equations are shown in Eq.(5)and Eq.(6),respectively.Among them,the loss function for L1needs to satisfy the Lipschitz continuity condition limit. In practical operation, this condition can be satisfied with a given range of parameter values wi∈[ - 0.01,0.01].

The RMSprop[28]algorithm is used to optimize the parameters of the model in the experiment. The number of iterations is set to 10,000.The training data of each batch randomly selected from the sample is set to 128. In order to make the network optimization process more stable,the learning rate is set to 0.00005.During the training, the discriminator is firstly optimized once, then the parameters of the discriminator are fixed, the generator and the discriminator are combined into a network for optimization once,and then alternately reciprocated until the network converges.
3.3. Evaluation method
At present,the methods for evaluating the performance of GAN results include average logarithmic likelihood, kernel density estimation and sample fidelity[29].However,because the GAN model belongs to generative model, the existing methods cannot be applied to all kinds of models. This paper evaluates the stability,generalization performance and image quality of the model from quantitative and qualitative aspects. On one hand, the generated spot pattern is placed in the background and observed by a professional observer whether it is “prominent” to obtain the overall quality effect evaluation. On the other hand, five features, rectangularity, dispersion, eccentricity, roundness and second-order moment [30], are used to sample the feature space of the background spot shape, and the independent T-test is used to test the significant difference between the actual data and the generated data. The stability of the model can be obtained by the difference curve between generator and discriminator loss during training.In fact, no information can be obtained from the loss value of GAN model,but the comparison between the two modules can basically reflect the convergence trend of the model.
4. Experiments and discussion
4.1. Data set establishment
Currently, there are few open data sets related to camouflage spots,so it is necessary to establish relevant data sets.A wide range of background image data can be obtained by using UAV (Unmanned Aerial Vehicle) to image the background area. The UAV's flight altitude is 100 m and the lens angle is 94°. The data are processed according to the calculation method provided in section 3.1. Firstly, image pixels are clustered into five categories. Since there are some noisy points in the image center after clustering,the morphological opening operation is used to process each kind of data one by one. According to Eq. (4), it can be calculated that the pixel size of the spot shape should be roughly between 8 and 30.After screening out the qualified spots, the size and color features are extracted and coded.Size data are encoded by one-hot[24,25]with length and width, and a total of 66-dimensional data is obtained. There are five kinds of color data, and five-dimensional vectors can be obtained. After the shape data is expanded, there are 28×28=784 dimension data. So the total size of the data feature space is 855 dimensions.
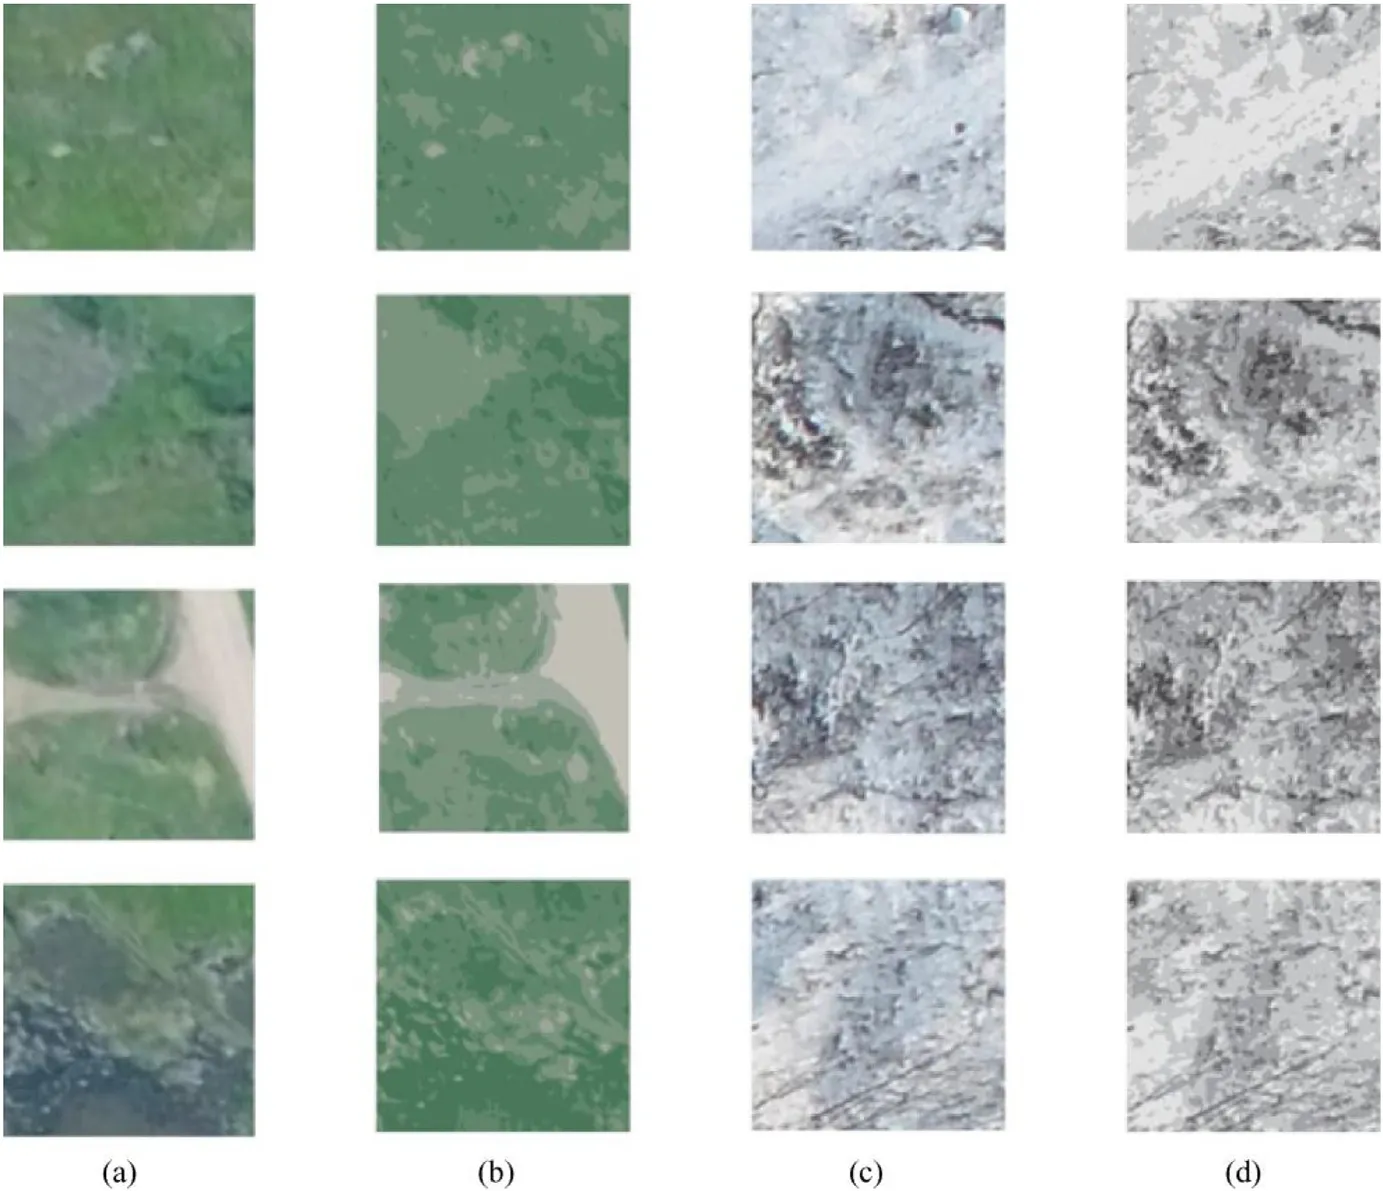
Fig. 4. Original images and clustered images in the process of data set establishment; (a) Original image of forestland background; (b) Clustered image of forestland; (c) Original image of snowfield background; (d) Clustered image of snowfield.
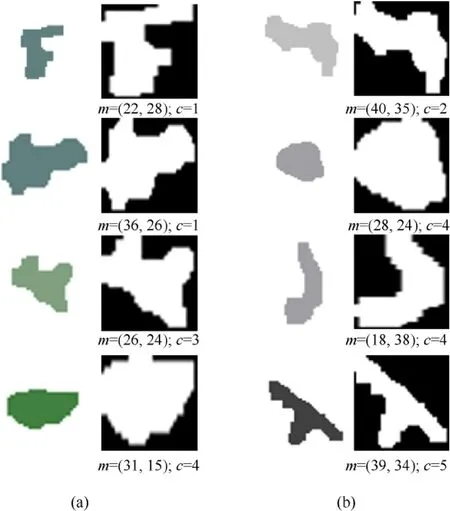
Fig. 5. Original spot feature extraction to get shape, color and size features. (a) Spot from a forestland background. (b) Spot from a snowfield background.
Two kinds of databases, forestland background and snowfield background,were respectively photographed and established.One original image and the clustered image randomly selected are shown in Fig. 4. Fig. 5 shows the shape, color and size characteristics of the spots in the image after clustering after feature extraction.In order to shorten the calculation time,only the background data with an area of approximately 1 square kilometer is used as the demonstration. A total of 22 images were acquired,with an image resolution of 5472 pixel×3078 pixel and a total pixel count of approximately 16 million. The actual area of each map is 0.048 km2.After the spots clusters and filtering processing,the data volume obtained of the forestland data set is 10234, and that of the snowfield data set is 12541.
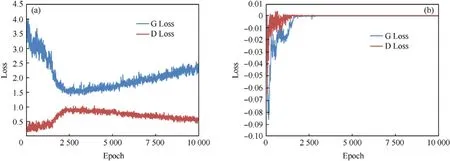
Fig. 6. Comparison of training conditions of two different loss functions; (a) Loss function of mean square error; (b) Loss function of Wasserstein function.
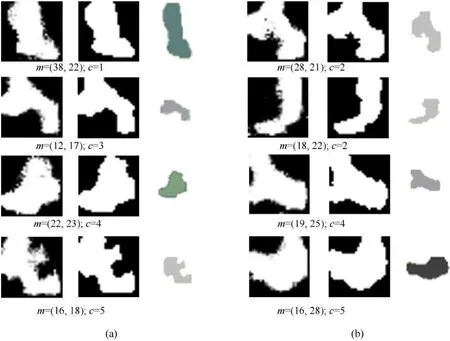
Fig. 7. Training results and processing; (a) Data set and training results of forestland; (b) Data set and training results of snowfield.
4.2. Training details and parameter optimization
Table 1 shows the computer software and hardware environment used in the model training process.
In order to give full play to the advantages of the generative model and make the model have better generalization ability, the effects of the loss functions defined by the Wasserstein distance and mean square error distance on the stability of the training process were investigated on the forest background data set during training. As shown in Fig. 6, the horizontal axis is the number of training times and the vertical axis is the value of the loss function.Fig.6(a)shows that G Loss is higher than D Loss under loss function of mean square error, and converges almost when the training times are close to 2500. However, with the increase of training times,G Loss gradually increases while D Loss gradually decreases,the network tends to be unbalanced and the amplitude of oscillation increases slightly. In terms of the quality of the generated images, the patterns are getting more and more monotonous.Fig.6(b)shows that under loss function of Wasserstein distance,the initial oscillation amplitudes of both networks are very large, but tend to stabilize quickly.And the network is basically stable when it comes to 2000 training sessions. After stabilization, there is no longer a trend line change with the subsequent training loss value.The oscillation amplitude of the loss value of the two networks decreases from beginning to end.The generated images have good diversity and high definition. This shows that the loss function of the Wasserstein distance is better than that of mean square error.
Fig.7 shows the comparison between the training results in the two training sets and the data in the original training set.Since the data quality status of color and length cannot be given, the results are discussed by observing the shape characteristics. The image in Fig.7 represents the spot shape feature; m and c below the image are the spot size feature(the number of pixels in length and width)and the color feature (the color coding after clustering). The first column of Fig. 7 is the generated data, whose image spots are continuous data calculated by tanh function, so its edges are somewhat blurred. But in fact, the effect of camouflage spots is observed from a long distance, and the smaller degree of edge blurring has little effect on the overall effect. In practical applications, the image can be binarized by threshold segmentation and simple morphological processing. The spot feature and color feature of the generated data are obtained by searching for the maximum subscript of the neuron. The second line in Fig. 7 is the result of the simple morphological processing of the data in the second line. The third column is the restored spot (the image is scaled proportionally for a more intuitive display). Overall, the algorithm works well. The generated camouflage spots have high similarity with the spot patterns in the background,and the trained network can quickly generate spot patterns.

Fig.8. Effect image of generated spots in background,the spots indicated by the red circle is generated by the model;(a)Effect image of generated spots of forestland data set;(b)Effect image of generated spots of snowfield data set.
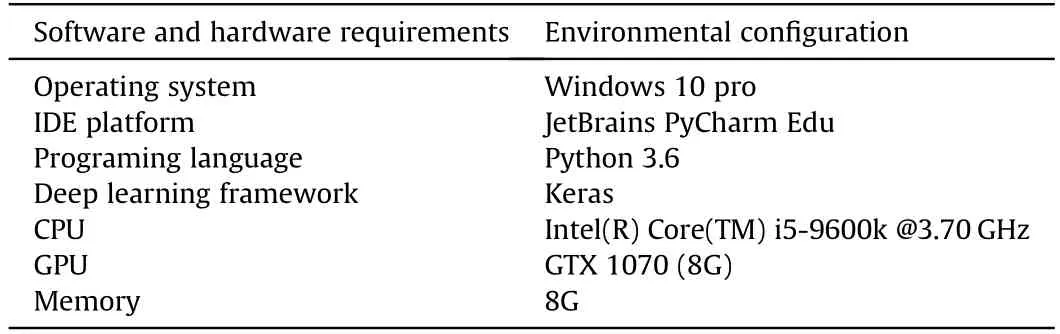
Table 1 Experimental environment.
The effect of random data dimension input by generator on the result of generation is investigated.Experimental results show that the lower the dimension is, the worse the diversity of data generated will be,and the model will be closer to the mode collapse,but the image quality will be slightly improved. As the dimension increases, the diversity of data increases, but the quality decreases significantly. Finally, a better result can be obtained by weighing dimension value 128.
4.3. Analysis of subjective and objective effects
Design observation experiments and obtain the overall effect of the generated spots by the statistics. The generated spot patterns were randomly and equally proportionally placed in the clustered background after restoration, and the subjective effects observed by 30 observers were counted, as shown in Fig. 8. The spots indicated by the red circle in the figure is generated by the model.Observers are free to zoom in and out of the background image for unlimited observation time, and need to point out possible spots.The number of times each spot was found and the number of times it was observed were calculated. The statistical results show that the probability of discovery of all spots is less than 20%. Higher probability of spot detection is because the random placement of the location is more obvious. For most of spots, the possibility of being discovered is close to zero.The result of snowfield data set is worse than that of forestland data set, and its probability of being discovered is generally higher. This is due to the poor clustering effect of the snowfield data set, which are generally small and mostly removed during data pre-processing. Generally speaking,the generated spots are consistent with the background spots subjectively, and can meet the camouflage effect requirements.
In order to more objectively analyze whether the data generated by the generator network and the samples come from the same distribution, the sample data with a capacity of 50 are randomly selected to calculate the five features of the spot shape: rectangularity, dispersion, eccentricity, roundness and second-order moment. The independent sample T-test is used to test whether the two data come from the same distribution in SPSS analysis software. The test results of data sets of forestland and snowfield are shown in Table 2 and Table 3, respectively. The results of both data sets show that the distribution data and sample data have strong homogeneity of variance in feature space.The results of the independent sample T-test indicate that the probability of the two being from the same distribution is very high, and its P-value is much higher than 0.05. It is worth pointing out that the standard deviation of most of the generated data is slightly lower than that of the sample data, which to some extent indicates that the concentration of the generated data is slightly higher and its diversity is slightly worse than that of the original data.
5. Conclusions
In this paper,the extraction process of deformation camouflage spots and the problem of spot reproduction based on the GAN model are studied. Firstly, the problems of existing methods for describing and reproducing camouflage spots are analyzed. Subsequently, the calculation method of extracting background camouflage spot features is proposed, and the calculation formula of determining the size range of spot based on imaging parameters is given. The spot feature is decomposed into shape feature, color feature and size feature, and the forestland and snowfield spot feature data sets are created in turn. The GAN framework isestablished, and the training and experiment process are carried out. Firstly, the effects of mean square error loss and Wasserstein distance loss on network convergence are analyzed.The loss curve and generated data show that the Wasserstein distance loss is better than the mean square error loss function on the whole.Secondly,the effect of generator input dimension on image results is studied and 128 is determined as the best input dimension.Then the subjective and objective effects of the spots are investigated.Subjectively, the generated spots are restored and then placed in the background.The probability that 30 observers can observe the spots is counted.The results show that the probability is lower than 20% and the probability of most spots is close to 0. Objectively,sample data with a capacity of 50 are randomly extracted and five features of spot shape, including rectangularity, dispersion, eccentricity, roundness and second-order moment, are calculated.The independent sample T-test is used to test the significance of the two data from the same distribution. The results show that the probability of sampling from the same distribution in the feature space is very high, P-Value is much higher than 0.05.

Table 2 Independent sample T-test results of spot shape features in forestland data set.

Table 3 Independent sample T-test results of spot shape features in snowfield data set.
The method proposed in this paper overcomes the shortcomings of the previous need to describe spots in feature space,and can directly fit the distribution of spot patterns. This method can quickly and effectively extract and generate camouflage spots,which provides a new solution for the design of camouflage patterns and the effect evaluation of camouflage patterns. However,there are still some detailed problems in this study,such as the low accuracy of the generation, the poor clustering effect of snow background and so on.The generated discriminator network can be employed in some evaluation work, so how to strengthen the training of the discriminator is also the next step that needs to be focused on.
Acknowledgments
This research was funded by Natural Science Foundation of Jiangsu Province, grant number BK20180579.

- Defence Technology的其它文章
- Statistical variability and fragility assessment of ballistic perforation of steel plates for 7.62 mm AP ammunition
- Texture evaluation in AZ31/AZ31 multilayer and AZ31/AA5068 laminar composite during accumulative roll bonding
- Local blast wave interaction with tire structure
- Research and development of training pistols for laser shooting simulation system
- Summed volume region selection based three-dimensional automatic target recognition for airborne LIDAR
- A novel noise reduction technique for underwater acoustic signals based on complete ensemble empirical mode decomposition with adaptive noise, minimum mean square variance criterion and least mean square adaptive filter