
Electron population properties with different energies in a helicon plasma source
2021-03-01 08:09ZunZHANG张尊ZheZHANG章喆HaibinTANG汤海滨andJitingOUYANG欧阳吉庭
Plasma Science and Technology 2021年1期
Zun ZHANG (张尊) , Zhe ZHANG (章喆), Haibin TANG (汤海滨) and Jiting OUYANG (欧阳吉庭)
1 School of Space and Environment, Beihang University, Beijing 100191, People’s Republic of China
2 Key Laboratory of Space Environment Monitoring and Information Processing of MIIT, People’s Republic of China
3 Shanghai Institute of Space Propulsion, Shanghai Engineering Research Center of Space Engine,Shanghai 201112, People’s Republic of China
4 School of Instrumentation and Optoelectronic Engineering,Beihang University,Beijing 100191,People’s Republic of China
5 School of Physics, Beijing Institute of Technology, Beijing 100081, People’s Republic of China
Abstract The characteristics of electrons play a dominant role in determining the ionization and acceleration processes of plasmas.Compared with electrostatic diagnostics,the optical method is independent of the radio frequency(RF)noise,magnetic field,and electric field.In this paper,an optical emission spectroscope was used to determine the plasma emission spectra, electron excitation energy population distributions (EEEPDs), growth rates of low-energy and highenergy electrons, and their intensity jumps with input powers.The 56 emission lines with the highest signal-to-noise ratio and their corresponding electron excitation energy were used for the translation of the spectrum into EEEPD.One discrete EEEPD has two clear different regions,namely the low-energy electron excitation region (neutral lines with threshold energy of 13-15 eV) and the high-energy electron excitation region (ionic lines with threshold energy≥19 eV).The EEEPD variations with different diameters of discharge tubes (20 mm, 40 mm,and 60 mm) and different input RF powers (200-1800 W) were investigated.By normalized intensity comparison of the ionic and neutral lines, the growth rate of the ionic population was higher than the neutral one,especially when the tube diameter was less than 40 mm and the input power was higher than 1000 W.Moreover,we found that the intensities of low-energy electrons and high-energy electrons jump at different input powers from inductively coupled(H)mode to helicon (W) mode; therefore, the determination of W mode needs to be carefully considered.
Keywords: electric propulsion, helicon plasma, plasma diagnostics, optical emission spectroscope, electron excitation energy population distribution
1.Introduction
Due to the advantages of high density, electrodeless design,and multiple operation modes, helicon plasmas are gaining more and more attention as thrusters or plasma sources in spacecraft propulsion [1-4].In helicon plasmas, the electron characteristics are very important because electrons are the medium for neutral particles and plasmas.The electron dynamics determine the ionization and acceleration of the ions and lead to the establishment of plasma potentials, such as current-free double layers [5-8].It is thus of interest to understand the electron dynamics in such systems.Electron excitation energy population distributions (EEEPDs) can reflect the amount and the energy level of energetic electrons,so they play a vital role in electron dynamics.Therefore, we determined the electron properties and EEEPDs of a helicon plasma source with different input radio frequency (RF)powers and diameters of discharge tubes.
Much effort has been made to characterize the electron properties and electron dynamics.For example, Charleset alused a Langmuir probe to figure out the spatial evolutions of the electron temperature, electron density, and plasma potential.They concluded that electron temperatures in the exhaust were approximately 6 eV and followed a Boltzmann expansion [9].Takahashiet alused a Langmuir probe to determine the electron temperature, electron density, and electron energy distribution function in a helicon source terminated by a double layer.They deduced that the downstream electrons (5 eV) came from upstream electrons (8 eV and 5 eV)that have sufficient energy to overcome the potential of the double layer [10].They measured the radial electron characteristics and concluded that the electron temperature near the RF antenna is almost twice that at the center line of the helicon source[11].They also established a global model using the Druyvesteyn theory to get the electron characteristics, which were also compared with the experimental results[12,13].Williams used a Langmuir probe to draw the 2D contour of the electron density and electron temperature.He concluded that the electron density decreases downstream rapidly by more than an order of magnitude, while the electron temperature first increases and then decreases as the axial distance increases [14].
In previous research,the main diagnostic instrument used was the Langmuir probe,which is a kind of electrostatic tool.Its advantages are that it is simple to build and at low cost.However, it is hard to explain theI-Vcurve and it is very sensitive to plasma potential oscillations,magnetic fields,and electric fields [15, 16].Also, the probe has to be driven by a high scan voltage (e.g.±150 V) which could disturb the original plasma structure.
Therefore, in order to determine the electron properties,another optical method should be considered.The optical method has the advantages of having no scan voltage, and being unaffected by the plasma potential oscillations and magnetic and electric fields [17, 18].Therefore, the optical method causes little disturbance to the plasma and can reflect plasma properties such as electron temperatures and densities by using the collisional-radiative (CR) model [19-27].Moreover, the optical method can distinguish electrons with different energies by their emission lines.
In this paper, based on the emission spectra of the argon discharge plasma,we established EEEPDs using the emission intensities and their corresponding electron excitation energy levels.We investigated the EEEPD variations with different diameters of discharge tubes (20 mm, 40 mm, and 60 mm)and different input RF powers(200-1800 W).We found that the high-energy region of the EEEPD appears and expands with the increase of input power density.The growth rate of the high-energy electrons is higher than that of the low-energy electrons with the increase of input power density.Moreover,we found that the intensities of high-energy electrons and low-energy electrons jump at different input powers from inductively coupled (H) mode to helicon (W) mode.
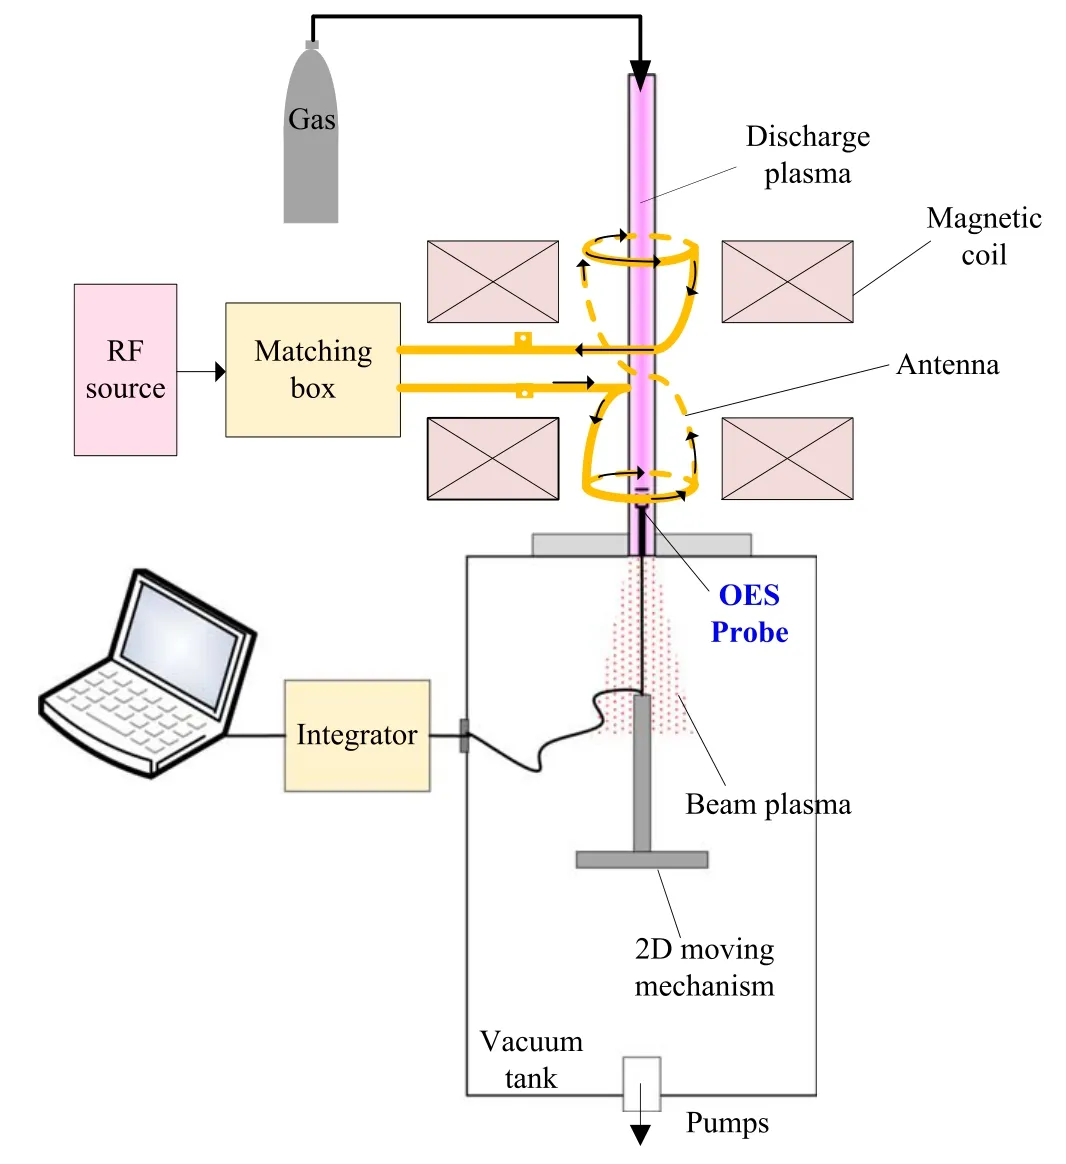
Figure 1.Sketch of the experimental setup.
2.Experimental apparatus
The experimental sketch is shown in figure 1.The discharge chamber consisted of a 20 mm diameter and 450 mm long quartz tube.This discharge chamber (tube) was surrounded by two axial solenoids and it was connected to an earthed stainless steel diffusion chamber which was 300 mm in diameter and 500 mm long.The closed end of the discharge tube was sealed using a dielectric plate (Polytetrafluoroethylene).The tube diameter could be changed to 40 or 60 mm with a corresponding diameter antenna.The quartz tube was surrounded by a water-cooled 155 mm long helical antenna.A 13.56 MHz RF source was connected to this helicon antenna.The required magnetic field was generated by two axial solenoids with an equal current of 40 A.The divergent magnetic field generated decreased from about 0.02 T(200 G)in the antenna center to about 0.001 T(10 G)in the middle of the diffusion chamber.The argon mass flow rate was 8.8 standard cubic centimeters per minute (sccm) during the discharge.The discharge system was pumped down to a base pressure of 10−3Pa by a turbo-molecular rotary pump which was connected to the side of the diffusion chamber downstream.The working pressure was about 0.4 Pa(3 mTorr)and it was measured using an ionization gauge.
An optical emission spectroscope (OES) with wavelengths ranging from 200 nm to 1000 nm was used for the optical experiments.A ceramic collimator was designed and installed on the head of the optical fiber.The spatial resolution of this OES assembly was less than 5 mm, and was described in detail in our previous works [4, 19, 20].For a brief introduction here, a light-proof ceramic collimator was designed and mounted on the head of the optical fiber.A small hole was opened in the head of this ceramic collimator.This hole allowed only a small fraction of the plasma(≤5 mm long) to pass through the collimator and to meet the optical path of the fiber.The OES assembly was installed on a 2D positioning mechanism to reach the desired measurement locations.

Figure 2.Emission spectrum with electron excitation energy thresholds.
3.Experimental results
3.1.OES emission spectra and EEEPDs
Figure 2 shows the emission lines with the electron excitation energy thresholds of an argon RF discharge.The OES assembly was set at a location 5 cm upstream of the exit plane and on the center line of the plasma source.The wavelengths of the emission lines and their excitation energies were compared with the NIST atomic spectra database lines in order to meet the international standards(https://physics.nist.gov/PhysRefData/ASD/lines_form.html).
All the emission lines with wavelengths ranging from 300 nm to 1000 nm were divided into two different regions by their different excitation energy thresholds.Firstly, the emission lines with wavelengths ranging from 300 nm to 600 nm are mainly high-energy electron excited ionic lines.This region is labeled as high-energy electrons due to their higher electron excitation energies(≥19 eV).Meanwhile,the region with wavelengths ranging from 600 nm to 1000 nm is labeled as low-energy electrons because of their lower electron excitation energies (mainly 13-15 eV).Tables 1 and 2 show the details of the high-energy electron excited ionic lines and low-energy electron excited neutral lines, respectively.These tables show the wavelengths, ion types, transition probabilities(Aki),statistical weights(gk),excited energy levels(Ei,Ek),and the electron configurations of the emission lines.
Taking one emission line as an example, its emission intensity was used as the axisYand its electron excitation energy threshold was used as the axisX.In this way,a total of 56 lines with the highest signal-to-noise ratio (SNR) in one emission spectrum was used to establish the EEEPD under a fixed working condition.Therefore, this new EEEPD is a graph with 56 discrete points, as shown in figure 3.Many curve fit methods, such as Gauss, exponential, growth,hyperbola, logarithm, peak function, polynomial, and power,were used to fit the discrete points in order to get a continuous distribution.However, all the curve fit results are very flat in the high-energy region leading to an unclear EEEPD at the high-energy tail.They could not reflect the high-energy electron properties.Therefore,we still used the discrete points as the EEEPD for comparison with different working conditions.
3.2.EEEPDs with different diameters of discharge tubes
Figure 4 shows the comparison of the emission spectra with different diameters of discharge tubes (20 mm, 40 mm, and 60 mm).It was obtained under the working condition of 8.8 sccm mass flow rate and 1000 W RF input power.The head of the optical assembly was set 5 cm upstream of the exit plane and on the center line of the tube.We can see from figure 4 that the intensities of all emission lines increase with the decrease of tube diameters.However, the intensities of emission lines with low electron excitation energies(e.g.Ar I 750 nm neutral line) and high electron excitation energies(e.g.Ar II 388 nm ionic line)increase at different growth rates with the decrease of discharge tube diameters.
Figure 5 shows the normalized emission intensities of the 750 nm (neutral) and 388 nm (ionic) lines, ratios of the skin depths to the radii, and power densities of the volume and surface area within the antenna region with different discharge tubes by taking the data of 60 mm as a reference.Because the RF power is largely deposited at the skin depth in inductively coupled plasmas, as the discharge tube changes,the skin depth will have a profound impact on the ionization across the radius of the plasma.Therefore, we compared the skin depth ratios and power densities with the intensities of the low-energy excited neutral and high-energy excited ionic lines in order to show their impact on the relative electron density.
The definition for the skin depth of a plasma isHerecis the phase velocity of the RF wave, ω is the RF angular frequency, and ωpis the plasma frequency, defined aswhereeis the electron charge,neis the electron density, ε0is the permittivity of free space, andmeis the mass of an electron.At 1000 W RF input power, the electron densities for 20 mm,40 mm,and 60 mm are 8.2 × 10¹⁷m−3,7.5 × 1017m−3,and 6.2 × 10¹⁷m−3, respectively.These electron densities were derived with a Langmuir probe and an OES assembly in our earlier study as described in detail in [19].Thus, the calculated skin depths for 20 mm, 40 mm, and 60 mm are 5.848 mm,6.144 mm,and 6.758 mm,respectively.Therefore,the ratios of the skin depths to the radii of the tubes for 20 mm, 40 mm, and 60 mm are 0.5848, 0.3072, and 0.2253,respectively.Finally, the normalized ratios of the skin depthsto the radii of the tubes for 20 mm, 40 mm, and 60 mm are 2.59,1.36,and 1,respectively,by taking the data of 60 mm as a reference.

Table 1.High-energy electron excited ionic lines from 300 to 600 nm with the highest SNR.

Table 2.Low-energy electron excited neutral lines from 600 to 1000 nm with the highest SNR.

Figure 3.EEEPD of the emission spectrum.

Figure 4.Emission spectra with different diameters of discharge tubes.
The emission intensities of the 750 nm and 388 nm lines represent the low-energy electron excited neutral and highenergy electron excited ionic populations, respectively[19, 20].The results show that the growth rate of the ionic population is larger than that of the neutral population with the decrease of discharge tube diameters.The low-energy electron excited neutral populations are likely to be saturated when the discharge tube diameters decrease to 40 mm and 20 mm.This phenomenon can be explained by the neutral depletion,which is a lack of neutral fuel resulting in a plasma density limit or even a decreasing density with increasing input power density [28, 29].Since the RF power is quite high (1000 W) there should be significant neutral depletion.As the tube diameter decreases, there will be little neutral depletion once the threshold in the tube size is reached;therefore, saturation is observed.However, the high-energy electron excited ionic populations still increase with the decrease of diameters.This phenomenon indicates a higher degree of gas ionization and propellant utilization in the smaller diameter discharge tube because of the higher input power density and the resultant increasing in the electron temperature, particularly in the high-energy region.

Figure 5.Normalized skin depth ratios, power densities, and emission intensities of the neutral and ionic lines with different tube diameters by taking the data of 60 mm as a reference.

Figure 6.EEEPDs with different diameters of discharge tubes.
Moreover,both the skin depth ratios and power densities increase with the decrease of tube diameters.The growth rate of the skin depth ratios is similar to that of the lateral area(or radius) power densities, but the growth rate of the volume power densities increases dramatically and becomes much larger than that of the skin depth ratios with the 20 mm discharge tube.Furthermore, the growth rate of the high-energy electron excited ionic populations is larger than that of the skin depth ratios.This phenomenon indicates that the highenergy electrons might come from the ‘helicon wave’ mode,which can go through the skin region and enter the bulk of the plasma.
Figure 6 shows the EEEPDs with different diameters of discharge tubes.The low-energy electron excited regions of the EEEPDs are nearly the same with different tubes.The EEEPD with the 60 mm discharge tube mainly focuses on the low-energy electron excited neutral populations (13-15 eV)with very few high-energy electron excited ionic populations.However, the high-energy electron excited ionic populations(≥19 eV) begin to show up with the 40 mm and 20 mm discharge tubes.Furthermore, a higher energy amplitude and energy tail appear with 20 mm diameter of the discharge tube due to the higher input RF power density.

Figure 7.Emission spectra with different input RF powers.

Figure 8.Normalized emission intensities of the neutral and ionic lines with input powers by taking the data of 200 W as a reference.
3.3.EEEPDs with different input RF powers
Figure 7 shows the emission spectra with different input RF powers (200-1800 W) tested on the 20 mm diameter discharge tube.They were obtained under the working condition of 8.8 sccm mass flow rate and with different RF input powers.The location of the optical assembly was on the center line and 5 cm upstream of the exit plan inside the discharge tube.We can see from figure 7 that the intensities of the emission lines show a clear increase with the increase of input RF powers.

Figure 9.EEEPDs with different input RF powers.
Figure 8 shows the normalized emission intensities of the 750 nm(neutral)and 388 nm(ionic)lines with different input RF powers.These values are normalized by taking the data of 200 W as a reference.The results show that the growth rate of the high-energy electron excited ionic population is larger than that of the low-energy electron excited neutral population with the increase of input powers, especially when the input RF power is higher than 1000 W.Furthermore,the lowenergy electron excited neutral population tends to be saturated when the input power increases to 1000 W.However,the high-energy electron excited ionic population shows a clear jump from 1000 W to 1400 W and tends to be saturated after 1400 W.Moreover, the high-energy electron excited ionic population increased by 350 times,which is much larger than the increased 50 times of the low-energy electron excited neutral population when the input power is higher than 1400 W.The high-energy electrons are more affected by the increased input powers.This phenomenon indicates that the degree of gas ionization and propellant utilization increase significantly when the input power is higher than 1400 W.
Figure 9 shows the EEEPDs with different input RF powers ranging from 600 W to 1800 W.The EEEPD intensity with 200 W is too low to show here.We can see from figure 9 that the low-energy electron excited neutral populations increase before the saturation point of 1000 W.Meanwhile,the high-energy electron excited ionic populations also increase as the RF input power increases from 600 W to 1400 W and these high-energy populations seem to be saturated from 1400 W to 1800 W.Moreover, the proportion of high-energy electron excited ionic population becomes larger with the increase of input RF powers.
4.Discussion
Figure 10 shows the intensity jumps of the high-energy electron excited ionic (388 nm) and low-energy electron excited neutral (750 nm) lines with the increase of input powers tested with the 20 mm discharge tube.Figure 11 shows the normalized intensity jumps of the high-energy excited ionic and low-energy excited neutral lines by taking the data of 200 W as a reference.In our earlier studies, the intensity of the 750 nm line is linear with the absolute electron density derived from a Langmuir probe with RF compensation [19, 20].Here, the intensity variation of the 750 nm line represents the population jump of a relatively low-energy electron for the different E,H,and W modes.The low-energy electron population jumps at 300 W from E to H modes and 700 W from H to W modes.
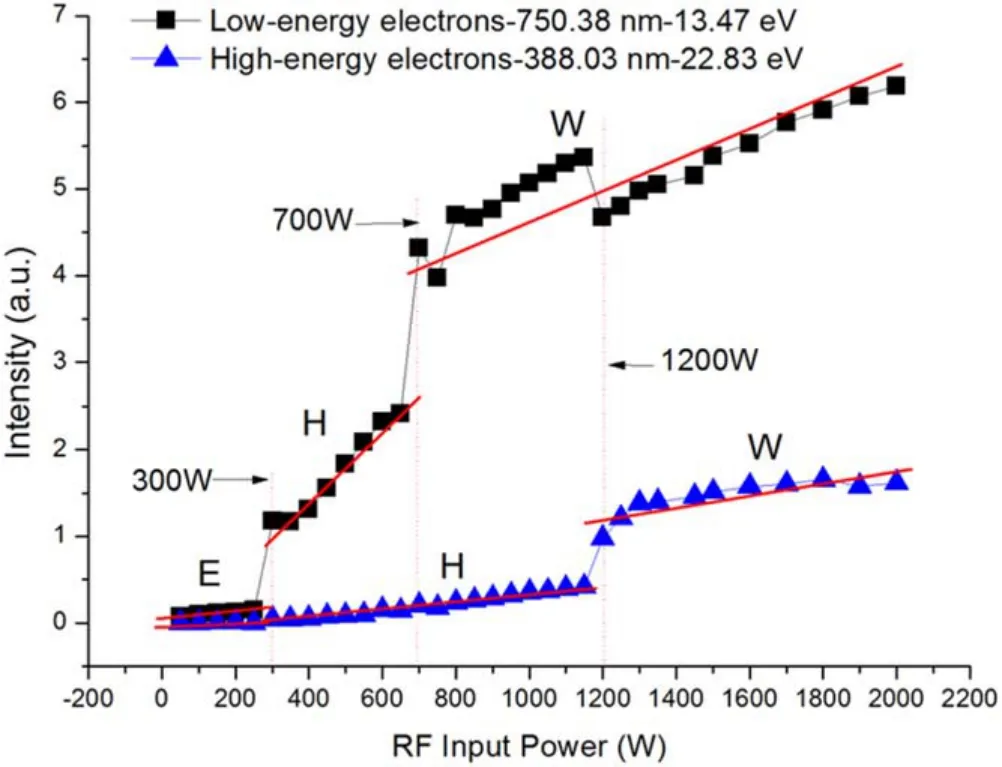
Figure 10.Population jumps with the increase of input powers.
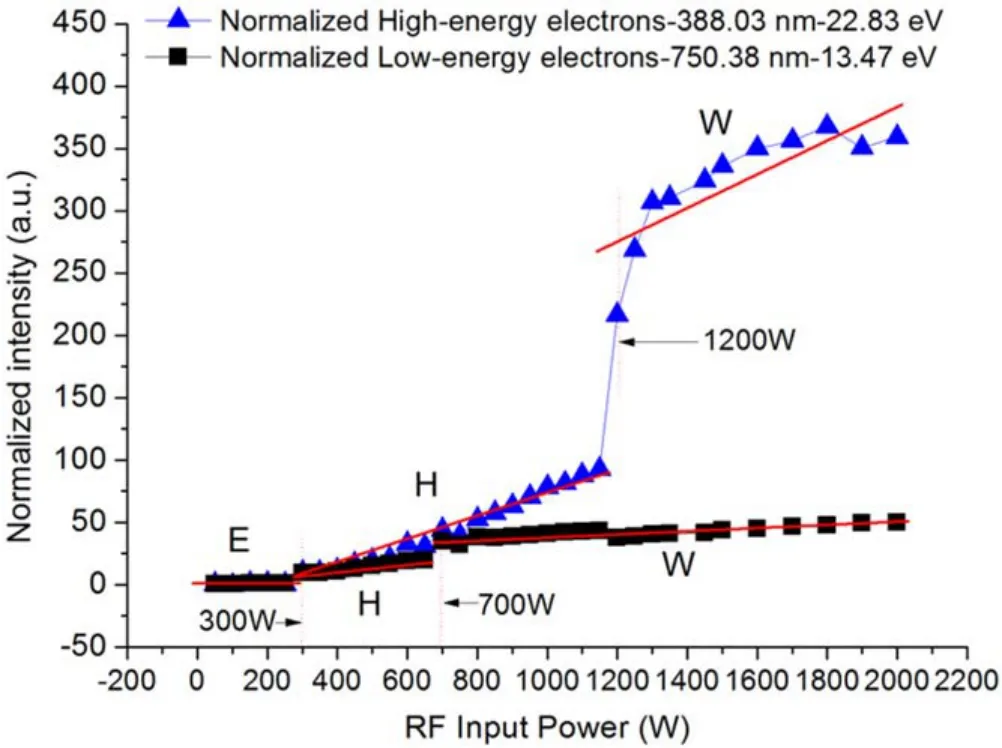
Figure 11.Normalized electron population jumps with the increase of input powers by taking the data of 200 W as a reference.
However, the interesting thing is that the high-energy electron excited ionic population jumps at a higher input RF power (1200 W) from H to W modes.This phenomenon shows that the input power(or energy)requirements for lowenergy electrons and high-energy electrons to reach the W mode are different.The problem brought by this phenomenon is that it is unreasonable to define the W mode only by the density jumps.It is necessary to combine other diagnostics to determine the characteristics of the W mode, such as using a magnetic probe to determine the magnetic wave form.It would be interesting to know whether the high-energy electrons are produced after the discharge reaches the W mode,or whether the W mode can be established as long as the highenergy electrons reach a certain density.We plan to answer this question in our future investigations.
Moreover,both the intensities of the low-energy electron excited neutral and high-energy electron excited ionic lines become saturated when the input RF powers reach a threshold.This phenomenon might be caused by neutral depletion.This could be examined by feeding neutral gas with different mass flow rates.Furthermore, when the high-energy electron excited ionic population jumps at 1200 W, the low-energy electron excited neutral population decreases a little bit.This phenomenon can be explained as follows: because the ionization process consumes a higher proportion of the total input energy,the energy obtained by the excitation process is reduced.
5.Conclusions
An OES assembly was immersed in a helicon plasma source to investigate the plasma emission spectrum, the EEEPD,the growth rate of the high-energy and low-energy electrons,and the different intensity jumps of the high-energy and lowenergy electrons.We translated the emission spectra into the EEEPDs with different diameters of discharge tubes and input RF powers.The EEEPDs were mainly divided into two different regions including the low-energy electron excited region (13-15 eV) and the high-energy electron excited region (≥19 eV).
Results show that the high-energy electron populations in EEEPDs begin to appear and increase with the decrease of the tube diameter and the increase of the input RF power due to the higher power density and the resultant higher electron temperature, particularly in the high-energy region.The growth rate of the high-energy electron population is always higher than the low-energy electron population, especially when the tube diameter is smaller than 40 mm and the input power is higher than 1000 W.
An interesting phenomenon is that the low-energy and high-energy electron intensities jump at different input powers from H to W modes.Therefore, this phenomenon reminds us that we cannot judge the establishment of W mode only by the density jumps.Other characteristics for W mode determination are required, such as the magnetic or electric fields, and wave structures.For future investigations on electron dynamics it would be better to distinguish their different energies.
Acknowledgments
This work was supported by National Natural Science Foundation of China (Nos.11805011 and 11872093).This work was partly supported by the Shanghai Engineering Research Center of Space Engine (No.17DZ2280800).
ORCID iDs
Zun ZHANG (张尊) https://orcid.org/0000-0002-1981-8852
猜你喜欢
连云港文学(2022年2期)2022-05-10
故事作文·低年级(2021年2期)2021-02-04
故事作文·低年级(2021年2期)2021-02-04
作文大王·低年级(2020年12期)2020-12-31
孩子(2019年9期)2019-11-07
中华诗词(2019年9期)2019-05-21
思维与智慧·上半月(2018年4期)2018-04-09
延河(2017年7期)2017-07-19
美与时代·城市版(2016年9期)2016-05-14
新校园·阅读(2009年8期)2009-10-23
 Plasma Science and Technology2021年1期
- Plasma Science and Technology的其它文章
- First results of negative ion extraction with Cs for CRAFT prototype negative beam source
- Manipulation and optimization of electron transport by nanopore array targets
- Modulational instability of the coupled waves between fast magnetosonic wave and slow Alfvén wave in the laser-plasma interaction
- Dense positrons and γ-rays generation by lasers interacting with convex target
- Linear gyrokinetic simulations of reversed shear Alfvén eigenmodes and ion temperature gradient modes in DIII-D tokamak
- Design and performance study of a gas-Cherenkov detector with an off-axis parabolic reflector for inertial confinement fusion experiments