
Neolignans and Norlignans from Insect Medicine Polyphaga plancyi and Their Biological Activities
2021-03-12 02:16HongJieZhuTeXuYongMingYanZhengChaoTuYongXianCheng
Hong-Jie Zhu ·Te Xu ·Yong-Ming Yan ·Zheng-Chao Tu ·Yong-Xian Cheng
Abstract Ten neolignans or norlignans (1— 10) including eight new compounds were isolated from the whole bodies of Polyphaga plancyiBolivar.Their structures were identifi ed by spectroscopic data.Compounds 3,4,8, and 9 are racemates indicated by chiral HPLC analysis.Chiral separation followed by ECD calculations allowed to clarify the absolute confi gurations of all the antipodes.All the new compounds were evaluated for their biological properties toward extracellular matrix in rat renal proximal tubular cells, human cancer cells (K562, A549, and Huh7), EV71, ROCK2, JAK3, DDR1, and coagulation.
Keywords Polyphaga plancyi·Insect medicine·Lignans·Renal protection·Anticoagulant activity
1 Introduction
Insects are a special group of existence on the earth.Facing the changing environment, they have strong adaptability, productivity and continuity.They seem small and insignifi cant, but the largest number of living beings on the planet, and their presence has created a huge molecular libraries [1,2].The tenacious vitality of insects is highly likely to be related to their unique molecular mechanisms [2], which provides us a confi dence to track their bioactive molecules.
In China, the insectPolyphaga plancyiBolivar has been used for promoting blood circulation [3].Whereas, so far there have few reports about its chemical composition [4].Previous studies revealed the signifi cance of structurally novel non-peptide small molecules (NPSMs) [5— 11], inspiring our further interest on insect chemistry.As far as the title species was concerned, eight new compounds and two known compounds belonging to neolignans and norlignans were isolated in this study (Fig.1).Chiral HPLC separation was used to aff ord optically active isomers.Subsequent absolute confi guration clarifi cation was aided by electronic circular dichroism (ECD) calculations.In addition, the biological activities of all the new compounds were assessed using multiple assays.
2 Results and Discussion
2.1 Structure Elucidation of the Compounds
Plancyin A (1) has the molecular formula C18H18O6deduced from analysis of its HRESIMS ([M-H] - ,m/z329.1040, calcd 329.1031),13 C NMR, and DEPT spectra, indicating 10 degrees of unsaturation.The 1 H NMR spectrum (Table 1) of 1 indicates the presence of three aromatic/olefi nic protons atδH6.63 (brs, H-2), 6.82 (brs, H-4), 6.90 (brs, H-6), indicating the presence of a 1,3,5-trisubstituted benzene ring.The 13 C NMR and DEPT spectra show 9 carbons ascribed to two methylene, threesp2 methine, and four quaternary carbons (one carbonyl, three olefi nic including one oxygenated).Based on the molecular formula, we judged that compound 1 is a completely symmetrical structure.The 1 H— 1 H COSY spectrum (Fig.2) shows correlations of H-7/H-8.The HMBC correlations of H-7/C-2, C-6, C-9 (δC176.9), H-8/C-1, and H-4/C-2, C-3 (δC158.8), C-6 allow to establish half the structure fragment of 1.Taken together, the structure of 1 was established as shown.

Fig.1 The chemical structures of compounds 1— 10
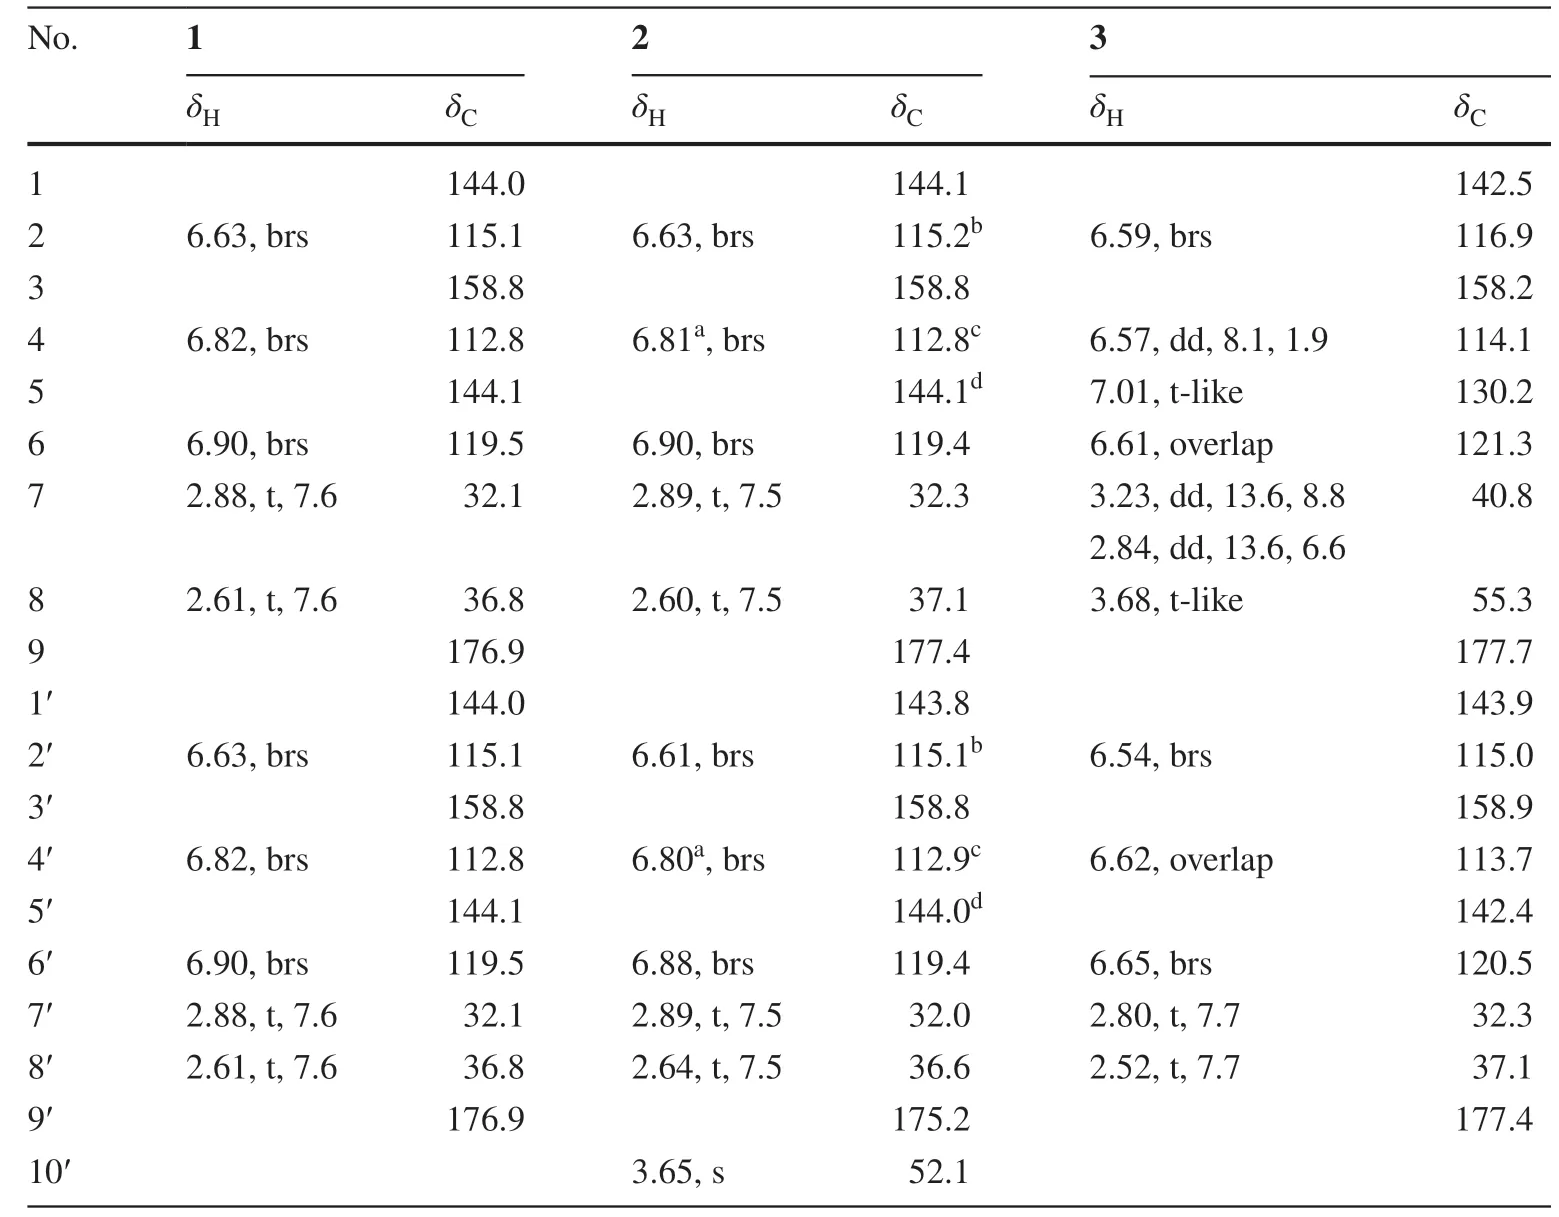
Table 1 1H (600 MHz) and 13C NMR (150 MHz) data of 1— 3 (δ in ppm,J in Hz, in methanol- d 4 )
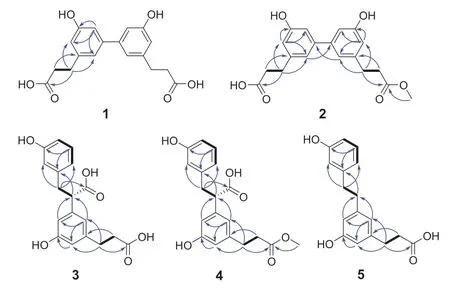
Fig.2 1 H— 1 H COSY (black bond) and key HMBC (blue arrow) correlations of 1— 5
Plancyin B (2) has a molecular formula of C19H20O6derived from its HREIMS (m/z 343.1193 [M-H] - , calcd for 343.1187),13C NMR, and DEPT spectra, having 10 degrees of unsaturation.The1H and13C NMR data of 2 resemble those of 1, differing in that the additional existence of a methyl in 2.The HMBC correlation of H-10′ (δH3.65, s)/C-9′ (δC175.2) indicates the connection position of the methyl group as shown.With these in hand, the structure of 2 was readily determined.
Plancyin C (3) possesses a molecular formula C18H18O6(10 degrees of unsaturation) deduced from its negative HRESIMS at m/z 329.1036 [M-H] - (calcd for 329.1031) and NMR data.The 1 H NMR spectrum (Table 1) indicates the presence of seven aromatic/olefi nic protons.The13C NMR and DEPT spectra display 18 carbons, of which twelve are olefi nic carbons belonging to two phenyl groups.Besides, the residual signals include three methylene, one sp3methine, and two quaternary carbons.The1H—1H COSY spectrum (Fig.2) shows correlations of H-4/H-5/H-6, H-7/H-8 and H-7′/H-8′.The HMBC correlations of H-7/C-2, C-6, C-9 (δC177.7), H-8/C-1 (δC142.5), in consideration of the chemical shift of C-1, indicate the presence of phenylpropanoid (part A).The HMBC correlations of H-7′/C-2′, C-6′, C-9′ (δC177.4) and H-8′/C-1′ (δC143.9) allow to establish the structure fragment of another phenylpropanoid (part B).In addition, the chemical shift of C-5′ and the HMBC correlations of H-4′, H-6′/C-8 (δ C 55.3) indicate that parts A and B in 3 are linked via C-8—C-5′.Taken together, the data enable assignment of the planar structure of 3.The lack of an optical rotation indicates that 3 is racemic.Separation by using chiral HPLC yielded two enantiomers, whose absolute confi gurations at stereogenic centers were assigned using computational methods.The ECD spectrum of (8 S)- 3 is correlated well with the experimental spectrum of (+)- 3, leading to the unambiguous assignment of the absolute confi gurations at the stereogenic centers in (+)- 3 as 8S(Fig.3).
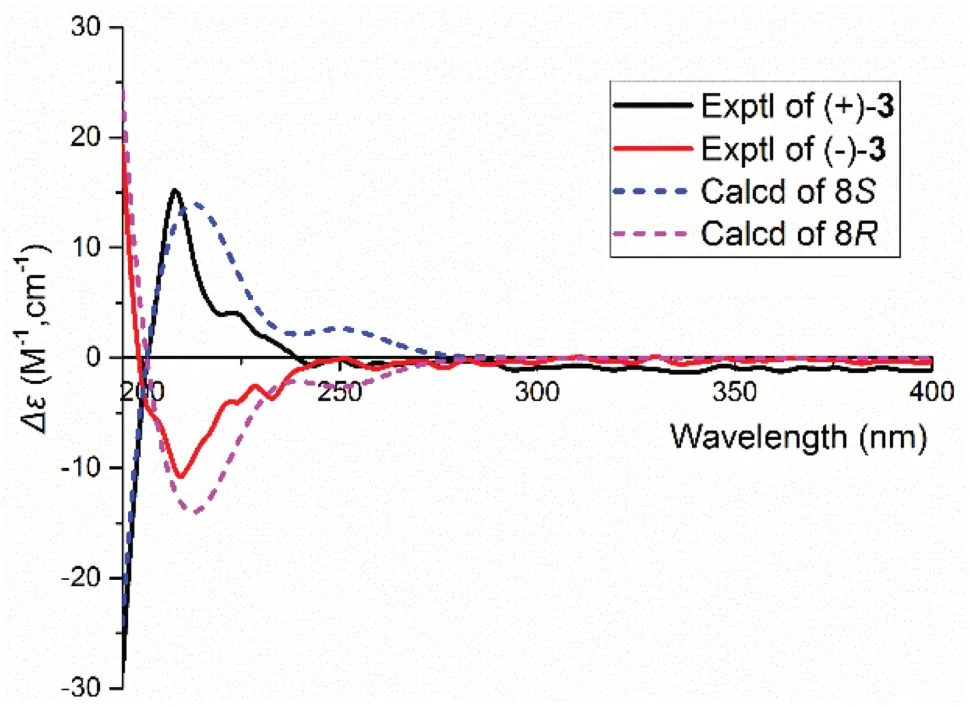
Fig.3 Comparison of calculated ECD spectra for (8 S)- 3 and (8 R)- 3 with the experimental spectra of (+)-3 and (-)-3 in MeOH.σ = 0.3 eV; shift = - 10 nm
Plancyin D (4) has the molecular formula C19H20O6(10 degrees of unsaturation), based on analysis of its HREIMS,13C NMR, and DEPT spectra.The 1 H and 13 C NMR data of 4 resemble those of 3, differing in that the additional existence of a methyl in 4.The HMBC correlation of H-10′ (δH3.63, s)/C-9′ (δC175.2) indicates the connection position of the methyl group as shown.Thus, the planar structure of 4 was determined.For the structure like 3, it is challenging to clarify the stereochemistry at C-8.Separation of 4 by chiral HPLC aff orded (+)- 4 and (-)- 4, whose absolute confi gurations were further determined by ECD calculations and comparison (Supplementary material) with the data of 3, allowing (+)- 4 to be 8S.
Plancyin E (5) has the molecular formula C17H18O4(9 degrees of unsaturation), based on analysis of its HREIMS and NMR data.Inspection of these NMR data disclosed that the structure of 5 extremely resemble that of 3, differing in that a carboxyl group of C-8 is absent gaining support from the HMBC correlations of H-8/C-1, C-4′, C-6′ and the chemical shift of C-8 (δC 39.0).Therefore, the structure of 5 was constructed.
Plancyin F (6) possesses a molecular formula C15H14O4deduced from its negative HRESIMS and NMR data, indicating 9 degrees of unsaturation.The 1 H NMR spectrum of 6 shows two ABX systems indicated by the signals atδH7.15 (d,J= 1.8 Hz, H-2), and 6.86 (d,J= 8.1 Hz, H-5), 7.13 (dd,J= 8.1, 1.8 Hz, H-6) andδH7.05 (d,J= 1.9 Hz, H-2′), 6.80 (d,J= 8.1 Hz, H-5′), and 7.01 (dd,J= 8.1, 1.9 Hz, H-6′), suggesting the presence of two 1,2,4-trisubstituted benzene rings.In addition, there exists a signal atδH3.53 (s, 2H, H-7) and a methyl signal atδH 2.28 (s, 3H, H-7′).The 13 C NMR and DEPT spectra display 15 carbons ascribed to one methyl, one methylene, sixsp2methine, seven quaternary carbons (one carbonyl, sixsp2including two oxygenated).The 1 H— 1 H COSY spectrum (Fig.4) gives cross peaks of H-5/H-6 and H-5′/H-6′, in conjunction with the HMBC correlations of H-7/C-2, C-6, C-8 (δC177.3), and the chemical shift of C-4 (δC154.0), revealing the west part of 6.The HMBC correlations of H-7′/C-1′, C-2′, C-6′ and H-6′/C-4′ (δC152.7) allow to establish the structure fragment of the east part.Two parts are connected via C-3—C-3′ aided by the HMBC correlations of H-2/C-3′ and H-2′/C-3.The structure of 6 was therefore identifi ed.
Plancyin G (7) has the molecular formula C20H18O8(12 degrees of unsaturation) deduced from its HRESIMS and NMR data.The 1 H NMR spectrum of 7 shows the presence of two doublets atδH7.59 andδH6.37 both withJvalue of 15.9 Hz, indicating thetransrelationship of H-7 and H-8, two ABX systems characteristic of signals atδH7.31 (d,J= 1.7 Hz, H-2), 6.78 (d,J= 8.3 Hz, H-5), and 7.06 (dd,J= 8.3, 1.7 Hz, H-6) andδH7.43 (d,J= 1.7 Hz, H-2′), 6.74 (d,J= 8.3 Hz, H-5′), and 7.08 (dd,J= 8.3, 1.7 Hz, H-6′), and two methyl signals respectively atδH3.96 (s, H-10) andδH3.69 (s, H-10′).The 13 C NMR and DEPT spectra display 20 carbons ascribed to two methyl, ninesp2methine, nine quaternary carbons (two carbonyl, sevensp2including five oxygenated).The architecture of 7 was constructed mainly based on the HMBC spectrum (Fig.4).In the HMBC spectrum, the correlations of H-7/C-2, C-6, C-9 (δC170.8), H-7′/C-2′, C-6′, C-9′ (δC167.7) indicate the presence of two phenylpropanoid parts, the correlations of H-5, H-10/C-3 (δC150.5), H-5′, H-10′/C-3′ (δC148.9) and ROESY correlations H-2/H-10, H-2′/H-10′ indicate the position of methoxyl, respectively.Further, a pivotal ROESY correlation of H-8/H-7′ in consideration of the chemical shift of C-8′ (δC139.9) suggests the position of ester oxygen and the presence ofE-confi gurated olefi nic protons (H-7′ and H-8′), in accordance with the requirement of degrees of unsaturation.Taken together, these data enable assignment of the structure of 7.

Fig.4 1H— 1 H COSY (black bond), Key HMBC (blue arrow), and ROESY (red arrow) correlations of 6— 9
Plancyin H (8) possesses a molecular formula C18H16O6(11 degrees of unsaturation) deduced from its HRESIMS and NMR data.The1H NMR spectrum indicates the presence of seven aromatic/olefi nic protons.The13C NMR and DEPT spectra display 18 carbons, of which twelve are olefi nic carbons belonging to two phenyl groups.Besides, the residual signals include one methylene, threesp3methine, and two quaternary carbons (carbonyl).The HMBC correlations (Fig.4) of H-7/C-2, C-6, C-9 (δC178.3), H-8/C-1, and the 1 H— 1 H COSY correlation of H-7/H-8 indicate the substructure of C-1—C-7—C-8—C-9 (part A).The structure fragment C-1′—C-7′—C-8′—C-9′ (part B) was established the HMBC correlations of H-7′/C-2′, C-6′, C-9′ (δC178.4), H-8′/C-1′, and the1H—1H COSY correlation of H-7′/H-8′.Further, the1H—1H COSY correlation of H-8/H-8′ and the HMBC correlations of H-5/C-7′, H-7/C-8′, and H-7′/C-8 suggests two parts are connected via C-6—C-7′ and C-8—C-8′.The 1 H— 1 H COSY correlations of H-4/H-5, H-5′/H-4′, H-6′, and HMBC correlations of H-5/C-1, C-3 (δC156.6) and H-5′/C-1′, C-3′ (δC158.4) indicate the replacement of benzene ring.Taken together, the planar structure of 8 was established as shown.There are three chiral centers in 8, the ROESY correlations (Fig.4) of H-8/H-7′ and H-8′/H-2′, H-6′ evidently imply the relative confi guration of 8.Compound 8 is racemic, chiral HPLC separation aff orded (+)- 8 and (-)- 8, whose absolute confi gurations was further determined as 8R,7′S,8′Rfor (+)- 8 and 8S,7′R,8′Sfor (-)- 8 by ECD comparison (Fig.5).
Compound 9 was determined to have the molecular formula C16H16O 6 (9 degrees of unsaturation) on the basis of HRESIMS and NMR data.The 1 H NMR spectrum shows an ABX system with signals resonated atδH6.53 (d,J= 1.6 Hz, H-2′), 6.69 (d,J= 8.0 Hz, H-5′), and 6.50 (dd,J= 8.0, 1.6 Hz, H-6′).Two aromatic protons atδH6.58 (s, H-2) andδH6.31 (s, H-5) suggest the presence of a 1,2,4,5-tetrasubstituted benzene ring.The13C NMR and DEPT spectra indicate 16 carbons ascribed to two oxygenated methylene, seven methine (5sp2and 2sp3), and seven quaternary carbons (4 oxygenated).The1H—1H COSY spectrum shows correlations of H-5′/H-6′; H-7/H-8, and H-7′/8′.The HMBC correlations of H-7′/C-1, C-1′, C-2′, C-6 and C-6′ indicate that the two phenyl groups are connected via C-7′.The HMBC correlations of H-8/C-1, H-2/C-7, H-7/C-8′, and H-8′/C-1′, C-6 suggest the structural motif of an isochroman.Taken together, the planar structure of 9 was determined as shown.There are two chiral centers in 9, the ROESY spectrum (Fig.4) of 9 displays the correlation of H-7′/H-8.We found that the NMR data of compound 9 are exactly same as those of periplanol A [20].However, the absolute confi guration of periplanol A has not been determined yet.To clarify the absolute confi guration of 9, chiral HPLC separation was first conducted due to it is racemic.The absolute confi guration of each enantiomer of racemic 9 was assigned by using ECD calculations.The ECD spectrum (Fig.6) of (7R,7′S)- 9 agrees well with the experimental one of (-)- 9, leading to the unambiguous assignment of the absolute confi gurations at the stereogenic centers in (-)- 9 as 7R,7′Sand (+)- 9 as 7S,7′R(Tables 2 and 3).
The known compound (10) was identifi ed as 5—5′ dehydrodi-3-(4-hydroxy-3-methoxyphenyl) propionic acid by comparing its NMR data with those in the literature [21].
Proteins or peptides are commonly considered to be the active substances in the insects.However, the chemical profi ling and biological role of nonpeptidal small molecules in the insects remains largely unknown.In this study, ten lignan derivatives were characterized.It is evident that compounds 5,6, and 9 are diverse norlignans and there exist four types of connection pattern for the ten lignans, adding new facets for the insect derived natural products.
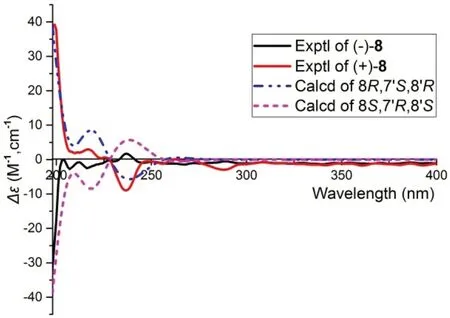
Fig.5 Comparison of calculated ECD spectra for (8 R,7′ S,8′ R)- 8 and (8′ S,7′ R,8′ S)- 8 with the experimental spectra of (+)-8 and (-)-8 in MeOH.σ= 0.3 eV; shift = - 7 nm

Fig.6 Comparison of calculated ECD spectra for (7 S,7′ R)- 9 and (7 R,7′ S)- 9 with the experimental spectra of (+)-9 and (-)-9 in MeOH.σ= 0.3 eV; shift = —3 nm
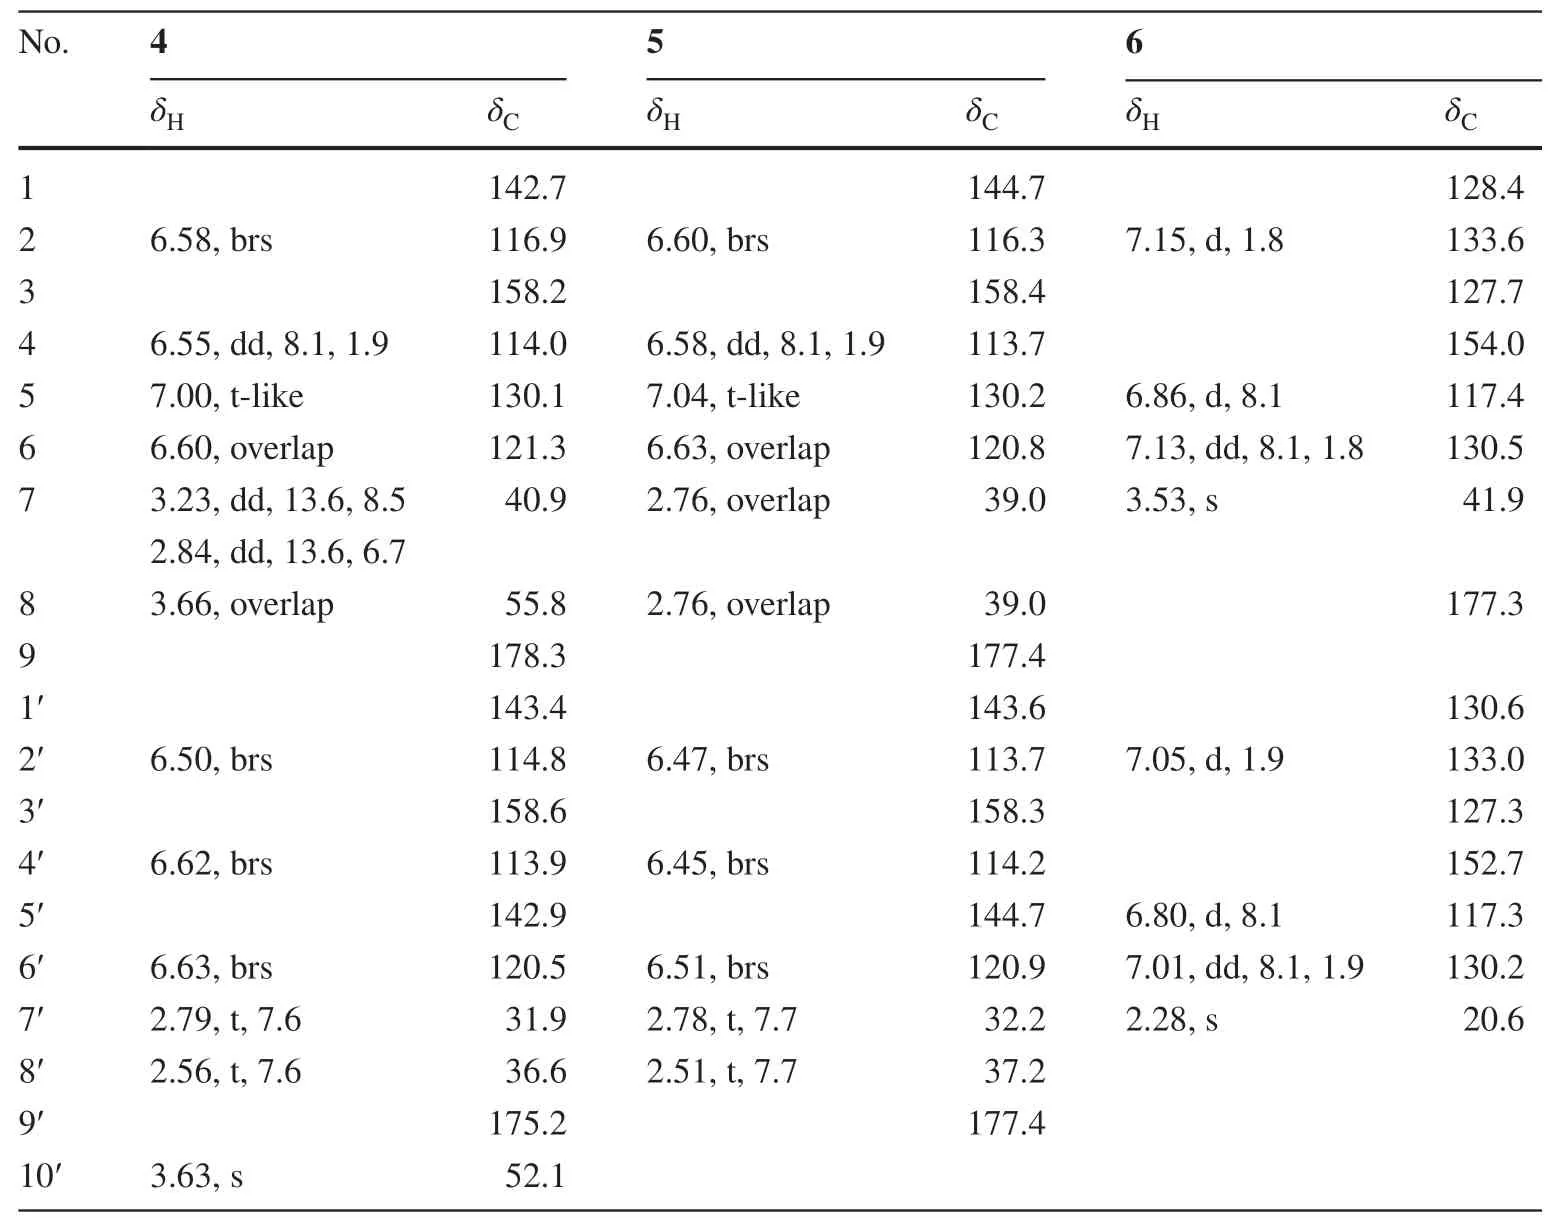
Table 2 1 H (600 MHz) and 13 C NMR (150 MHz) data of 4— 6 (δin ppm,Jin Hz, in methanol- d4 )
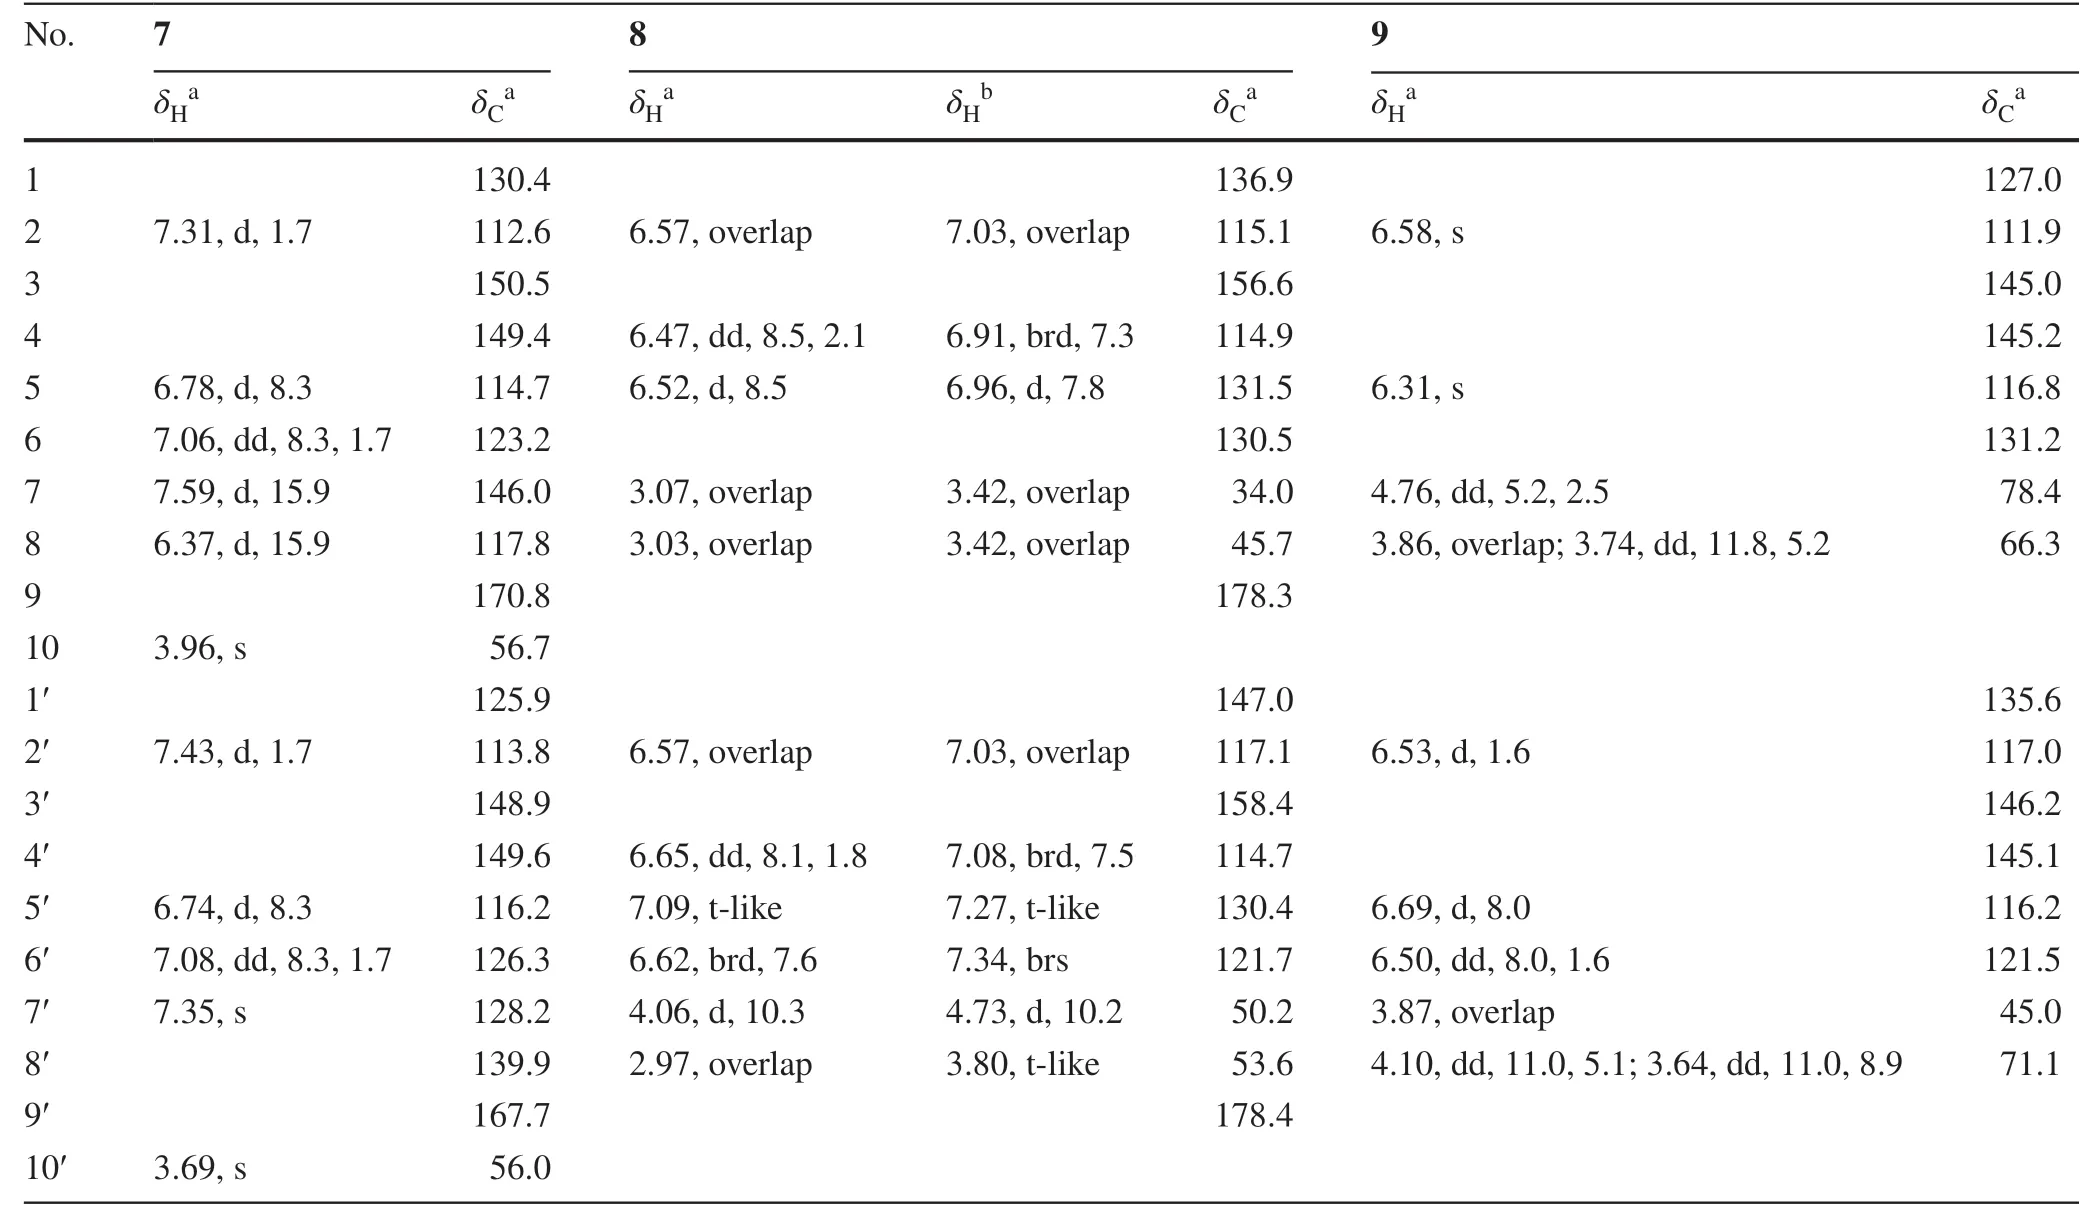
Table 3 1 H (600 MHz) and 13 C NMR (150 MHz) data of 7— 9 (δin ppm,Jin Hz)
2.2 Biological Evaluation
To explore the mechanism underlying the antifi brotic eff ect of the compounds, we first examined whether the compounds aff ected TGF-β1—induced activation of the marker genes in NRK-52e cells (40 μM, data not shown).As presented in Fig.7, compound 1 reduces three marker genes, especially for fibronectin andα-SMA in TGF-β1—induced NRK-52e cells (Fig.7 a).Compound 7 signifi cantly inhibits three marker genes (Fig.7 b).Besides, Western bolt assay shows that compounds 1 and 7 decrease the protein expression with a dose-dependent manner in TGF-β1-induced NRK-52e cells (Fig.8 a, b).Next, we assessed the expression of Smad2/3 phosphorylation in NRK-52e cells.As presented in Fig.9, compound 1 inhibits Smad3 phosphorylation, but does not aff ect TGF-β1—induced Smad2 phosphorylation (Fig.9 a).Compound 7 decreases both Smad3 and Smad2 phosphorylation level, and the eff ect for Smad2 appears to be more potent than Smad3 at 40 μM (Fig.9 b).Although more investigation are needed, our current study provides evidence that compounds 1 and 7 can play potential roles in the therapy of renal fibrosis by the disruption of Smad activation.
In addition, all the new compounds were evaluated for their inhibitory activities against human cancer cells (K562, A549, and Huh7), EV71, ROCK2, JAK3, DDR1, and coagulation.Compounds (+)- 3 and (-)- 3 show cytotoxicity against K562, A549, and Huh-7 cell lines with IC50values ranging from 16.6 to 67.7 μM (Table 4).In contrast, compounds (+)- 3 and (-)- 3 also exhibit inhibitory activity against EV71 with IC 50 values of 23.2 μM and 27.1 μM, respectively.It was found that compound 6 exhibits potent inhibitory activities toward these kinases with IC50values of 9.17 μM for JAK3 and 27.1 μM for ROCK2.Compounds (+)- 9 and (-)- 9 exhibit inhibitory activities against JAK3 and DDR1 kinases (Table 5).In addition, partial compounds exhibit negligible inhibitory eff ect on coagulant (Tables 6,7 and 8).

Fig.7 Western blot analysis showing that 1 and 7 protect against TGF- β 1-mediated renal fibrosis.NRK-52e cells were incubated with TGF- β 1 (10 ng/mL) for 48 h in the absence or presence of the compounds (40 μM).Cell lysates were immunoblotted with antibod-ies against fibronectin, collagen I,α-SMA, and GAPDH.GAPDH and GW were used as a normalizing control and a positive control, respectively.GW: GW788388 (Medchemexpree, HY-10326)

Fig.8 Western blot analysis showing that 1 and 7 block TGF- β1-mediated renal fibrosis.NRK-52e cells were preincubated with different concentrations of the compounds for 48 h before TGF- β1 (10 ng/mL) treatment.Cell lysates were immunoblotted with antibodies against fibronectin, collagen I,α-SMA, and GAPDH
3 Experimental Section
3.1 General Experimental Procedures
Optical rotations were recorded on a Horiba SEPA-300 polarimeter.UV spectra were measured on a Shimadzu UV-2401PC spectrometer.CD spectra were determined on a Chirascan instrument.NMR spectra were recorded on a Bruker AV-600 MHz spectrometer, with TMS as an internal standard.ESIMS and HRESIMS were collected on an Agilent 1290 UPLC/6540 Q-TOF spectrometer.C-18 silica gel (40—60 μm; Daiso Co., Japan), MCI gel CHP 20P (75—150 μm, Mitsubishi Chemical Industries, Tokyo, Japan) and Sephadex LH-20 (Amersham Pharmacia, Uppsala, Sweden) were used for column chromatography.Semi-preparative HPLC was underwent on an Agilent 1200 liquid chromatograph with an YMC-Pack ODS-A column (250 × 10 mm, i.d., 5 μm, flow rate: 3 mL/min) and a Daicel Chiralpak (IC, 250 mm × 4.6 mm, i.d., 5 μm, flow rate: 1 mL/min).
3.2 Insect Material
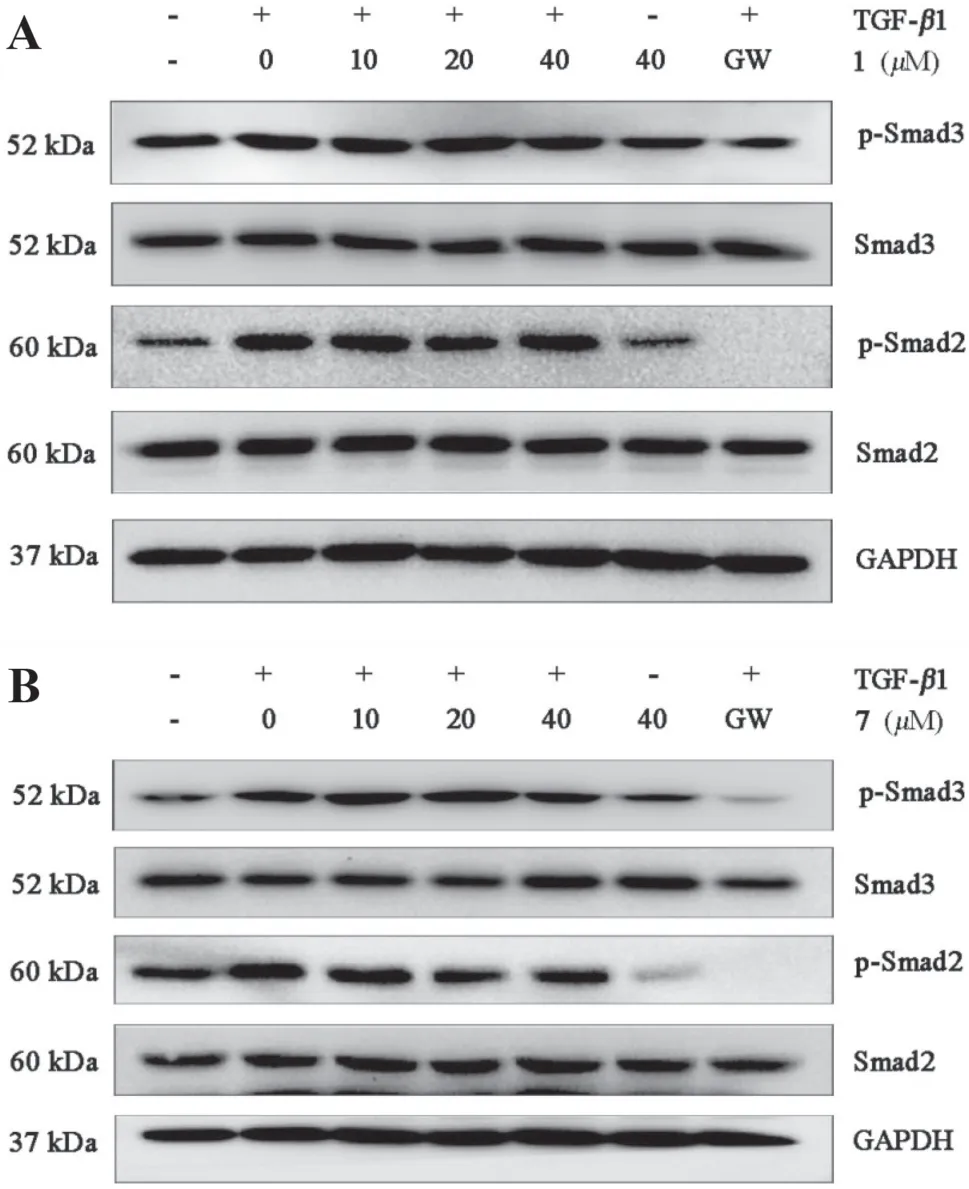
Fig.9 Western blot analysis showing that 1 and 7 inhibit TGF- β1—induced Smad2/3 phosphorylation in NRK-52e cells.NRK-52e cells were treated with TGF- β1 (10 ng/mL) for 1 h in the absence or presence of different concentrations of the compounds.Cell lysates were immunoblotted with antibodies against p-Smad3, Smad3, p-Smad2, Smad2, and GAPDH
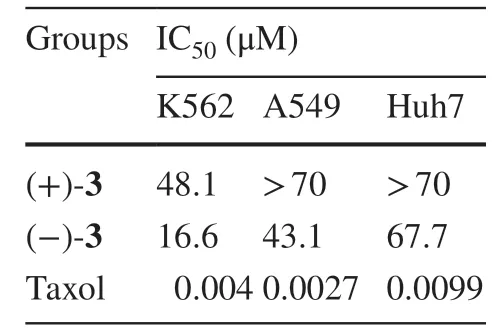
Table 4 Cytotoxicity against three different human cancer cell lines
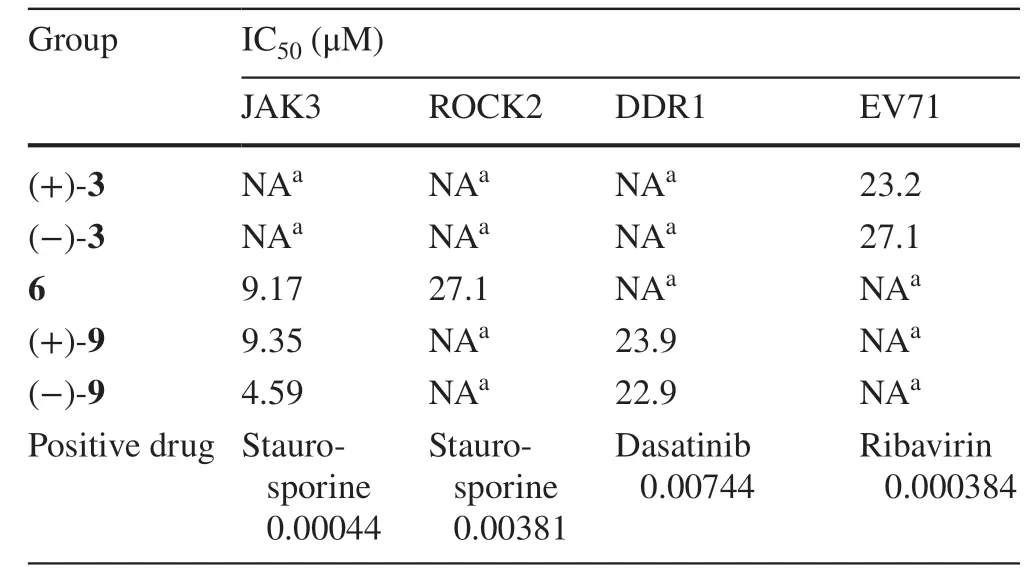
Table 5 Inhibitory eff ects of the isolates toward JAK3, ROCK2, DDR1, and EV71

Table 6 Inhibitory eff ects of the isolates on PT (n = 3)
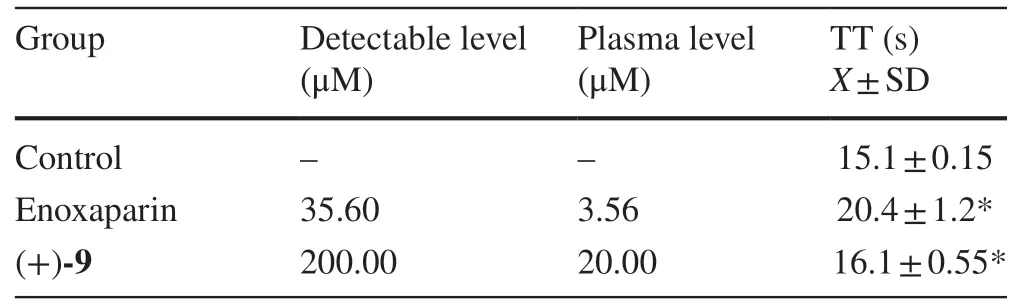
Table 7 Inhibitory eff ects of the isolates on TT (n = 3)
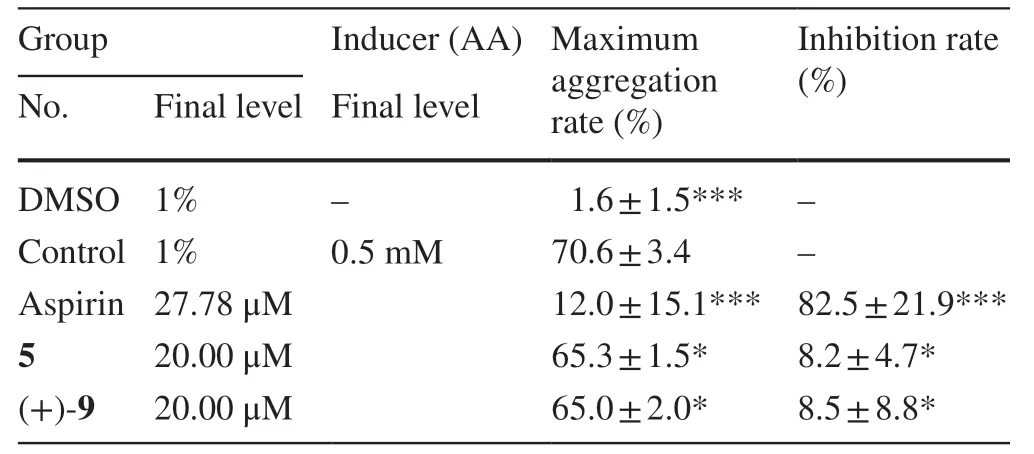
Table 8 Inhibitory eff ects of the isolates on AA induced platelet aggregation in rabbits (X ± SD, n = 3)
The specimen ofPolyphaga plancyiwas purchased from Henan Province, China, in November 2014, and identified by Prof.Da-Rong Yang at Kunming Institute of Zoology, Chinese Academy of Sciences.A voucher specimen (CHYX-0593) is deposited at the School of Pharmaceutical Sciences, Shenzhen University Health Science Center, People’s Republic of China.
3.3 Extraction and Isolation
The whole bodies ofP.plancyi(50 kg) were extracted under reflux with 70% EtOH (300 L, 4 h, 3 h, 3 h) to give a crude extract (6.32 kg), which was suspended in water followed by successive partition with petroleum ether and EtOAc to aff ord an EtOAc soluble extract.This extract (127 g) was divided into six parts (Frs.A—F) by using a MCI gel CHP 20P column eluted with gradient aqueous MeOH (10%—100%).Fr.B (8.1 g) was gel filtrated over Sephadex LH-20 (aqueous MeOH, 80%) to aff ord 3 parts (Frs.B1—B3).Compound 9 (2.6 mg,tR= 19.2 min) was obtained from Fr.B3 (0.40 g) by semi-preparative HPLC (MeCN/H2O, 13%, flow rate: 3 mL/min).Fr.C (12.0 g) was gel filtrated over Sephadex LH-20 (aqueous MeOH, 80%) to aff ord 5 parts (Frs.C1—C5).Fr.C2 (5.51 g) was submitted to a RP-18 column eluted with gradient aqueous MeOH (15—50%) to yield 8 subfractions (Frs.C2.1—C2.8).Fr.C3 (2.45 g) was submitted to a RP-18 column eluted with gradient aqueous MeOH (15—50%) followed by semi-preparative HPLC (MeCN/H2O, 29%, flow rate: 3 mL/min) to produce 4 (1.3 mg,tR= 28.0 min).Fr.C4 (1.71 g) was gel filtrated over Sephadex LH-20 (MeOH) followed by semi-preparative HPLC (MeCN/H2O, 21%, flow rate: 3 mL/min) to produce 8 (2.6 mg,tR= 27.2 min).Fr.D (8.7 g) was gel filtrated over Sephadex LH-20 (aqueous MeOH, 80%) to aff ord 6 parts (Frs.D1—D6).Further, Fr.D5 (1.23 g) was gel filtrated over Sephadex LH-20 (MeOH) followed by semi-preparative HPLC (MeCN/H2O, 29%, flow rate: 3 mL/min) to produce 3 (22.5 mg,tR= 11.6 min),10 (2.5 mg,tR= 12.3 min),7 (2.1 mg,tR= 19.2 min),6 (2.8 mg,tR= 28.4 min), and 5 (5.5 mg,tR= 34.0 min).Fr.D6 (1.01 g) was gel filtrated over Sephadex LH-20 (MeOH) followed by semi-preparative HPLC (MeCN/H2O, 29%, flow rate: 3 mL/min) to produce 1 (12.5 mg,tR= 12.2 min) and 2 (3.8 mg,tR= 34.5 min).Notably, compounds 3,4,8, and 9 were isolated as racemates, which were subjected to chiral HPLC to yield (+)- 3 (10.1 mg,tR = 8.3 min) and (-)- 3 (10.5 mg,tR= 11.6 min) (n-hexane/ethanol, 85:15, flow rate: 1 mL/min), (+)- 4 (0.7 mg,tR= 10.4 min) and (-)- 4 (0.5 mg,tR= 15.8 min) (n-hexane/ethanol, 80:20, flow rate: 1 mL/min), (+)- 8 (1.4 mg,tR= 12.5 min) and (-)- 8 (1.1 mg,tR= 14.6 min) (n-hexane/ethanol, 90:10, flow rate: 1 mL/min), (+)- 9 (1.2 mg,tR= 8.9 min) and (-)- 9 (1.1 mg,tR= 14.3 min) (n-hexane/ethanol, 77:23, flow rate: 1 mL/min), respectively.
3.4 Compound Characterization
Plancyin A (1): Yellowish solid; UV (MeOH)λmax(logε) 288 (3.82), 255 (4.02), 211 (4.45) nm; ESIMSm/z329 [M-H] - , HRESIMSm/z329.1040 [M-H] - (calcd for C18H17O6, 329.1031).1H and13C NMR data, see Table 1.
Plancyin B (2): Yellowish solid; UV (MeOH)λmax(logε) 291 (3.76), 256 (4.00), 214 (4.54) nm; ESIMSm/z343 [M-H] - , HRESIMSm/z343.1193 [M-H] - (calcd for C19H19O6, 343.1187).1H and13C NMR data, see Table 1.
Plancyin C (3): Yellowish solid; {+ 49.5 (c0.17, MeOH); CD (MeOH) Δε195- 27.87, Δε208+ 15.93; (+)- 3};- 58.0 (c0.16, MeOH); CD (MeOH) Δε195+ 18.55, Δε208- 11.62; (-)- 3}; UV (MeOH)λmax(logε) 278 (3.77), 205 (4.80) nm; ESIMSm/z329 [M-H] - , HRESIMSm/z329.1036 [M-H] - (calcd for C18H17O 6 , 329.1031).1 H and 13 C NMR data, see Table 1.
Plancyin D (4): Yellowish solid;+ 86.7 (c0.07, MeOH); CD (MeOH) Δε197- 39.04, Δε209+ 15.41; (+)- 4};- 86.5 (c0.05, MeOH); CD (MeOH) Δε195+ 33.86, Δε208- 17.87; (-)- 4}; UV (MeOH)λmax(logε) 277 (3.53), 205 (4.60) nm; ESIMSm/z343 [M-H] - , HRESIMSm/z343.1178 [M-H] - (calcd for C19H19O6, 343.1187).1 H and13C NMR data, see Table 2.
Plancyin E (5): Yellowish solid; UV (MeOH)λmax(logε) 277 (3.60), 217 (4.24), 205 (4.60) nm; ESIMSm/z285 [M-H] - , HRESIMSm/z285.1133 [M-H] - (calcd for C17H17O4, 285.1132).1H and13C NMR data, see Table 2.
Plancyin F (6): Yellowish solid; UV (MeOH)λmax(logε) 291 (3.72), 208 (4.44) nm; ESIMSm/z257 [M-H] - , HRESIMSm/z257.0816 [M-H] - (calcd for C15H13O4, 257.0819).1H and13C NMR data, see Table 2.
Plancyin G (7): Yellowish solid; UV (MeOH)λmax(logε) 323 (4.39), 204 (4.39) nm; ESIMSm/z385 [M-H] - , HRESIMSm/z385.0917 [M-H] - (calcd for C20H17O8, 385.0929).1H and13C NMR data, see Table 3.
Plancyin H (8): Yellowish solid;+ 34.9 (c0.11, MeOH); CD (MeOH) Δε198+ 29.58, Δε230- 5.48; (+)- 8};- 29.6 (c0.14, MeOH); CD (MeOH) Δε198- 37.08, Δε237+ 2.03; (-)- 8}; UV (MeOH)λmax(logε) 280 (3.53), 221 (4.15), 205 (4.52) nm; ESIMSm/z327 [M-H] - , HRESIMSm/z327.0873 [M-H] - (calcd for C18H15O6, 327.0874).1 H and 13 C NMR data, see Table 3.
Periplanol A (9): Yellowish solid;+ 36.1 (c0.04, MeOH); CD (MeOH) Δε 197 - 6.41, Δε 206 + 11.24, Δε292 + 2.06; (+)- 9};- 12.8 (c0.41, MeOH); CD (MeOH) Δε196+ 7.91, Δε204- 12.17, Δε294- 2.08; (-)- 9}; UV (MeOH)λmax(logε) 507 (2.58), 474 (2.59), 290 (3.65), 206 (4.36); ESIMSm/z303 [M-H] - , HRESIMSm/z303.0863 [M-H] - (calcd for C16H15O6, 303.0874).1 H and 13 C NMR data, see Table 3.
3.5 Biological Evaluation for Kidney Fibrosis
3.5.1 Cell Culture and Cytotoxicity Assay
NRK-52e cell lines were maintained in Dulbecco’s modifi ed Eagle’s medium (DMEM) supplemented with 10% fetal bovine serum and 100 U/mL penicillin—streptomycin in 37 °C with atmosphere of 5% CO2.The growing cells were seeded at 1 × 10 4 cells per well in 96-well culture plates for 24 h.Cells were exposed to the compounds with different concentrations (2.5, 5, 10, 20, 40 μM) for 48 h.The equal volume of DMSO was used as the solvent control.CCK-8 solution (10% v/v) was added and incubated for another 2 h.Light absorbance of the solution was measured at 450 nm (Epoch 2; BioTek Instruments, Inc.).
3.5.2 Western Blot Assay
Protein expression was analyzed by Western blot analysis as described previously [12].The concentration of all the compounds was 40 μM for primary screening and 10, 20, 40 μM for dose-dependent experiments.The primary antibodies as follows: Anti-Fibronectin antibody [IST-9] (#ab6328; Abcam), COL1A1 Antibody (#84336; Cell Signaling Technology),α-Smooth Muscle Actin (D4K9N) XP® Rabbit mAb (#19245; Cell Signaling Technology), Smad3 (C67H9) Rabbit mAb (#9523, Cell Signaling Technology), Phospho-Smad3 (Ser423/425) (C25A9) Rabbit mAb (#9520, Cell Signaling Technology), Smad2 (D43B4) XP® Rabbit mAb (#5339, Cell Signaling Technology), Phospho-Smad2 (Ser465/467) (138D4) Rabbit mAb (#3108, Cell Signaling Technology), GAPDH (D16H11) XP® Rabbit mAb (#5174, Cell Signaling Technology).Cell pellets were collected and resuspended in RIPA lysis buff er (containing 0.1 mM PMSF).GW: GW788388 (Medchemexpree, HY-10326) [13].
3.6 Biological Evaluation for Human Cancer Cells (K562, A549, and Huh7), ROCK2, JAK3, and DDR1
Compounds 1— 9 were evaluated for their inhibitory eff ects against human cancer cells (K562, A549, and Huh7) [14], ROCK2 [15], JAK3 [16], and DDR1 [4] as previously described methods.
3.7 Biological Evaluation for EV71
Compounds 1— 9 were evaluated for their EV71 inhibitory activities in vitro.VERO cells were plated into 384-well plate at a suitable density and allowed to adhere prior to addition of varying concentrations of drugs.Then the cells were covered with enteroviruses EV71 which was diluted at fresh culture medium.After that, the cells were incubated at 37 °C for a further 72 h.Then discard the old medium, add fresh medium containing CCK-8, and incubated in 37 °C for 2 h.The A450 was then measured with an Envision Plate Reader (PerkinElmer).
3.8 Anticoagulant Assay
The prothrombin time (PT) and thrombin time (TT) was determined with a coagulometer (TECO MC-4000, Germany).All the reagents were purchased from TECO GmbH (Germany).PT reagent, TT reagent, and normal human plasma was reconstituted in 4 mL (or 1 mL for plasma) of distilled water, according to the instructions of the manufacturer.The compounds were dissolved to 2 mM in DMSO at various concentrations.Then use 20 mM Tris—HCl pH 7.4 (including 5% Tween 80) diluted to 200 μM to be measured.For the PT and TT assays, 5 μL samples (or 10 μL for TT) were mixed with 45 μL (or 90 μL for TT) of normal human plasma and incubated for 2 min at 37 °C; 100 μL of PT (or 50 μL of TT) reagent was then added and the clotting time was recorded.
3.9 Platelet Aggregation Assay
Turbidometric measurements of platelet aggregation inhibition were performed in a Chronolog Model 700 Aggregometer (Chronolog Corporation, Havertown, PA, USA) according to Born’s method [17,18].The present study was approved by the Research Ethics Committee of Kunming Institute of Botany, Chinese Academy of Sciences.The blood from the rabbits by ear central arter puncture, were anticoagulated with 3.8% sodium citrate (9:1, v/v).Platelet-rich plasma (PRP) and platelet-poor plasma (PPP) were prepared shortly after blood collection by spinning the sample at 180 g for 10 min at 22 °C.The PRP was carefully removed and the remaining blood centrifuged at 2400×gfor 10 min to obtain PPP.The centrifuge temperature was maintained at 22 °C.Platelet counts were adjusted by the addition of PPP to the PRP to achieve a count of 250 × 10 9 /L.Platelet aggregation studies were completed within 3 h of preparation of PRP.Immediately after preparation of PRP, 250 μL was transferred into each of the test tubes, with 250 μL PPP set as a control.Before addition of inducers, the compounds were incubated with PRP at 37 °C for 5 min.Final concentration of agonist was: arachidonic acid (AA) 0.5 mM as positive reference.Percentage inhibition by the compounds was calculated according to the formula:

whereA: maximum change of turbidity in DMSO added,B: maximum change of turbidity in sample added.
3.9.1 Computational Methods
Molecular Merck force field (MMFF) and DFT/TDDFT calculations were performed with Spartan’14 software package (Wavefunction Inc., Irvine, CA, USA) and Gaussian 09 program package [19], the conformational search generated low-energy conformers within a 10 kcal/mol energy was finished by software Conflex 7.Geometry optimizations of compounds 3 ,8, and 9 were carried out at the DFT/B3LYP/6-311G (d, p) level.The calculated ECD spectra were determined by using Gaussian 09 software employing the TDDFT-B3LYP functional and the 6-311G (d, p) basis sets.ECD calculations further were conducted at the B3LYP SCRF (PCM)/6-311G (d,p) level in MeOH.
AcknowledgementsThis study was supported by the National Science Fund for Distinguished Young Scholars (81525026) and Shenzhen Government’s Plan of Science and Technology (JCYJ20170412110504956).
Compliance with Ethical Standards
Conflicts of interestThe authors declare that they have no conflict of interest.
Open AccessThis article is licensed under a Creative Commons Attribution 4.0 International License, which permits use, sharing, adaptation, distribution and reproduction in any medium or format, as long as you give appropriate credit to the original author(s) and the source, provide a link to the Creative Commons licence, and indicate if changes were made.The images or other third party material in this article are included in the article’s Creative Commons licence, unless indicated otherwise in a credit line to the material.If material is not included in the article’s Creative Commons licence and your intended use is not permitted by statutory regulation or exceeds the permitted use, you will need to obtain permission directly from the copyright holder.To view a copy of this licence, visit http://creat iveco mmons.org/licen ses/by/4.0/.
 Natural Products and Bioprospecting2021年1期
- Natural Products and Bioprospecting的其它文章
- In Memory of the Late Professor Jun Zhou (1932-2020)
- In Mourning and Memory of Late Professor Zhou Jun
- Natural Products in Cancer Therapy: Past, Present and Future
- On the Famous Traditional Chinese Medicine “Fu Zi”: Discovery, Research, and Development of Cardioactive Constituent Mesaconine
- The Outlook of the Development of Innovative Products from Biocompatible Natural Spider Silk in the Beauty Thread-Lifting Industry
- Insight into Medicinal Chemistry Behind Traditional Chinese Medicines: p-Hydroxybenzyl Alcohol-Derived Dimers and Trimers from Gastrodia elata