
Flow separation control over an airfoil using continuous alternating current plasma actuator
2021-03-19 03:20JianGuoZheng郑建国
Chinese Physics B 2021年3期
关键词:建国
Jian-Guo Zheng(郑建国)
School of Aerospace Engineering,Huazhong University of Science and Technology,Wuhan 430074,China
Keywords: dielectric barrier discharge plasma actuator,alternating current plasma discharge,flow separation,flow control,delayed response
1. Introduction
The pursuit of flow separation control over aerodynamic bodies is of great importance to both fundamental research and practical engineering applications. The flow separation occurring over an aircraft at high angle of attack could cause lift reduction,drag increase,structural vibration,etc. To mitigate such detrimental effects, a variety of flow control techniques,either passive or active, have been proposed and investigated in the past with varying degree of success. The passive control methods such as vortex generator and riblet usually involve the local geometric modification of aerodynamic body surface. Despite the advantage of requiring no auxiliary power,the passive control devices are always in operation and therefore could cause negative effects to aerodynamic vehicles in off-design conditions.By contrast,the active flow control usually involves energy or momentum addition to the flow or manipulation of inherent flow instability in a regulated manner.Active control is more flexible than passive control as it can be turned on or off based on the flow conditions in a real-time closed loop control system.
As an active control device, plasma actuator has desired attributes including light weight, lack of mechanical component, fast response time, high bandwidth, and so on. A typical dielectric barrier discharge(DBD)plasma actuator has two electrodes mounted on the opposite sides of a dielectric layer as sketched in Fig.1(a).When a sinusoidal high-voltage waveform is applied to the actuator, air over the buried electrode will be weakly ionized and an electrohydrodynamic force is produced,leading to the generation of an electric-wind-based wall jet over the lower electrode,[1]see Fig.1(a). The jet velocity can be up to 10 m/s in atmospheric air.[1]The plasma actuator driven by sinusoidal voltage waveform with the peak-topeak voltage(Vp−p)in the range of one to tens of kilovolt(kV)and frequency varying from one to tens of kilohertz (kHz) is called alternating current(AC)DBD plasma actuator. The AC DBD has been studied extensively and implemented in various applications.[1-3]The studies using AC DBD plasma actuators for airfoil flow control can be traced back to the pioneering work by Roth,[4]for the suppression of flow separation over an NACA 0015 airfoil at Reynolds number of Re=6.4×10⁴,and a series of experiments by others,[5,6]to name just a few. In Refs. [7-10], the influence of actuation parameters like burst frequency and location of actuator on control performance is examined.Meanwhile,particle image velocimetry(PIV)measurement and flow visualization were conducted by Benard et al. to investigate vortex dynamics of separated airflow under AC plasma actuation.[11,12]On the other hand,Gaitonde et al.performed large eddy simulation (LES) to compare the actuation performance and mechanisms of continuous and pulsed AC plasma discharges in flow separation control.[13]The work by Sato et al. is focused on the identification of optimum reduced frequency of pulsed AC plasma for control of airfoil flow.[14,15]Moreau et al.investigated the control of a turbulent flow separated at mid-chord along an airfoil by implementing three DBD plasma actuators on different locations on the upper surface of airfoil.[16]They found that the baseline flow separation occurring at 50%of the chord can be delayed appreciably with the separation point moving to downstream location up to 76% of the chord. Although AC DBD has seen substantial success in various aerodynamic applications,[1-3,17]it is generally accepted that a disadvantage of AC DBD is that the induced jet velocity is relatively low, which is typically a few meters per second. As a result,this type of plasma actuator is mainly used for flow separation control in low subsonic regime with the freestream speed U∞≤30 m/s and Reynolds number of O(105).[2]
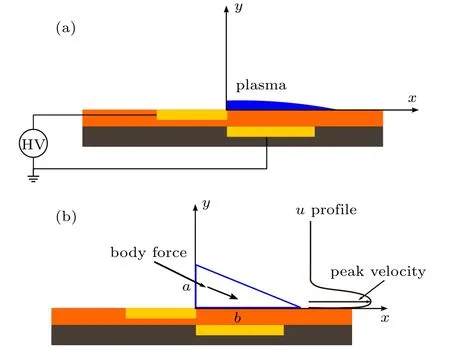
Fig.1. The side view of dielectric barrier discharge(DBD)plasma actuator driven by high voltage(HV)signals(a)and the sketch of body force model for AC plasma discharge and velocity profile of induced jet flow(b).
But some recent studies suggest that the mechanism of AC DBD has not been fully revealed and understood. For instance, Kelley et al. found that the AC DBD in continuous and burst modes has comparable performance with that of novel nanosecond DBD plasma actuator and can effectively mitigate the flow separation over airfoil in a high freestream speed flow with Mach number up to 0.4.[18]Note that the nanosecond plasma actuator has been intensively investigated as it shows great potential to control high-speed flow and is used in a wide range of flow control applications including unmanned air vehicle(UAV).[19,20]Zhang et al. reported that the AC DBD plasma can generate ultrasound with frequency of approximately 100 kHz.[21]Actually, given the complexity of physics of flow separation as well as plasma discharge,some phenomena peculiar to AC-DBD-based flow control has not been reported in the literature and additional insights into the AC plasma actuation are desired. In this study,a combined numerical and experimental investigation of flow separation control over an NACA 0015 airfoil using continuous AC DBD is conducted. The transient flow field around airfoil is visualized using particle image velocimetry (PIV) measurement.Numerical simulation is performed to complement the experiment. The delayed response of external flow to continuous AC plasma forcing and violent flow field fluctuation in the late stage of forced flow evolution at high angle of attack will be presented. Although abundant research has been directed towards the application of AC DBD plasma actuator to various flow control problems, the control mechanisms of AC DBD have not been fully clarified and little attention was paid to the above-mentioned phenomena of delayed response and violent fluctuation of flow field. The purpose of this paper is to highlight these physical phenomena,try to explain the underlying mechanisms and shed more insights into the understanding of separated flow control with AC plasma actuation.
The paper is organized as follows. In Section 2, the experimental setup will be presented. The physical model and numerical method will be given in Section 3, which is followed by the result and discussion in Section 4. Finally, the main findings of this study are summarized in Section 5.
2. Experimental setup
The NACA 0015 airfoil model is made of Acrylonitrile-Butadiene-Styrene (ABS) material. The DBD plasma actuator is flushed mounted near the leading edge of airfoil. Figure 2(a)shows the schematic installation of plasma actuator on airfoil,whereas figure 2(b)shows the assembled airfoil model installed in the wind tunnel. The actuator is composed of a dielectric material made of four layers of Kapton films with the total thickness of about 0.8 mm,and two copper electrodes mounted on opposite sides of the dielectric layer without overlap.The downstream edge of the exposed electrode marked by a blue arrow in Fig.2(a)is close to the leading edge. Experiment is conducted using a closed-loop,subsonic wind tunnel.It has a contraction ratio of 12 and a square test section with cross area of 0.6 m×0.6 m and length of 2 m. The freestream velocity U∞is adjustable, ranging from 3 m/s to 90 m/s. The turbulence intensity of freestream is less than 0.1%.
The alternating current high voltage waveform is generated by amplifying low voltage signal using a high voltage amplifier(10/40A;Trek Inc.). A two-velocity-component, timeresolved PIV system is used to measure the evolution of velocity field. A pair of thin light sheets is generated by using an Nd:YLF PIV laser. For particle scattering, the time between two image frames is determined based on flow velocity,camera magnification, and sub-region area for cross-correlation.A Phantom Miro 320s high speed camera of 1920 pixel by 1200 pixel with Nikkor 105 mm f1:2.8D lens is used. The size of field of view is about 283 mm × 177 mm and spatial resolution is around 3.5 mm. In performing the crosscorrelation, 32 pixel × 32 pixel of subregion area is adopted and the overlap is 50%. The measured velocity is accurate to about 0.49 m/s. A Safex Fog Generator F2010 is used to generate water-based particles,whose mean diameter is about 1µm. The PIV data is sampled at frequency of 693 Hz. More information on experimental setup can be found in Ref.[22].
Fig.2. The schematic installation of plasma actuator on airfoil (a)and the assembled NACA 0015 airfoil model installed in wind tunnel(b).
3. Physical model and numerics
3.1. Unsteady Reynolds averaged Navier-Stokes equations
The external flow over airfoil is assumed to be fully turbulent, and described by two-dimensional (2D) unsteady Reynolds averaged Navier-Stokes (URANS) equations given below:

It will be seen later that RSM can resolve the complex separated flow around airfoil and subsequent flow control satisfactorily. More details of RSM turbulence model can be found in Ref.[23].
3.2. Empirical body force model for AC DBD
The empirical body force model developed by Shyy et al.[24]is employed in this study to model the macro effect of AC plasma discharge on external airflow.It is assumed that the AC DBD produces a two-dimensional body force field acting on air in a right triangle region over the buried electrode, see Fig.1(b). The height of triangle is a=1.5 mm and the length of triangle is b=3 mm. The body force exerted on air in the triangle is given by

3.3. Numerics
The URANS equations system (1) is solved using a second-order finite volume method on structured quadrilateral mesh. The time integration is performed using a dual-timestepping method with multi-grid technique employed to speed up the convergence of solution in each time step.
4. Results and discussion
4.1. Flow induced by plasma discharge in quiescent air
In this subsection,the continuous AC plasma discharge in originally quiescent air is resolved to illustrate the basic characteristics of discharge induced flow as well as to validate the employed body force model. The computational domain is a two-dimensional rectangular region in x-y plane. The plasma actuator is flushed mounted on the lower wall of the computational domain.
It is well known that the continuous AC DBD in air will generate a near-wall jet flow over the buried electrode. Here,the induced flow is assumed to be laminar and numerically reproduced by solving system(1)with turbulence model turned off. A series of values of scale factor Φ is tested and simulation is run until a steady flow state is reached for each selected value of Φ. The calculated time-averaged u velocity profile along a vertical monitoring line 2-cm downstream the interface between the exposed and buried electrodes is plotted in Fig.3 with the value of Φ varying from 0.2 to 0.8. To validate the body force model in Eq.(2),the experimentally measured velocity distribution at the same downstream station(i.e.2-cm downstream of electrodes interface)is extracted from Ref.[25]and plotted in Fig.3. In the experiment reported in Ref.[25],the peak-to-peak voltage of AC waveform is Vp−p=12 kV and the measured peak jet velocity is around 5.3 m/s, see Fig.3.It is observed from Fig.3 that the predicted peak velocity is dominated by the scale factor and increases with Φ increasing. The jet velocity associated with Φ ≤0.4 is significantly smaller than the experimental data. When Φ is increased to 0.6,the predicted jet velocity is only slightly smaller than the experimental value. In the current study, a higher voltage of Vp−p= 18 kV is used in the flow control presented below.Therefore,Φ is set to be a higher value of 0.8 to match the employed higher voltage and produce a larger peak velocity. The predicted velocity for Φ =0.8 is around 6.2 m/s and about 17% higher than the experimental value with Vp−p=12 kV.This simulation shows that our method can successfully resolve the principal flow features induced by AC DBD and is reliable for the resolution of flow control based on AC plasma discharge. For all the simulations below, the value of Φ is fixed at 0.8.
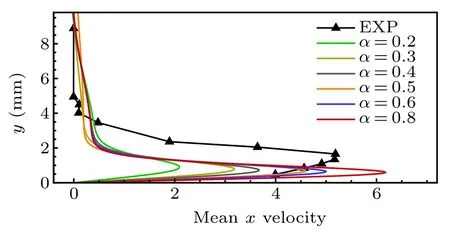
Fig.3. Comparison of predicted and measured velocity profiles for AC plasma discharge.
4.2. Flow separation control at intermediate angle of attack near stall
4.2.1. Baseline flow
In this subsection,the continuous AC plasma actuation of separated flow over an NACA 0015 airfoil model at intermediate angle of attack of ∠AoA=14◦near stall is investigated experimentally. As the first step,the baseline flow is examined.The Reynolds number based on chord length of c=20 cm and free stream speed of 25 m/s is 3.31×10⁵. According to our previous study,the stall angle of attack of NACA 0015 airfoil at Re=2.7×10⁵with U∞=20 m/s is around 14.5◦.[22]The flow conditions considered here including Reynolds number and free stream speed are close to those in Ref.[22]and the resulting stall angle of attack should be close to 14.5◦.In the current paper, the intermediate angles of attack are those angles of attack which are one or two degrees lower or higher than the stall angle of attack and close to the latter. The peak-to-peak voltage of AC waveform Vp−pis 18 kV.The measurement and visualization of transient flow field are conducted with timeresolved PIV system. The PIV data sampling frequency is 693 Hz, thus giving a time resolution of about 1.443 ms. An instantaneous vorticity field overlaid with velocity vector is illustrated in Fig.4(a)for the baseline flow,where the flow has reached a quasi-periodic state and time is reset to be 0. It is seen that the flow fully separates from the leading edge of airfoil, resulting in a separated, unsteady turbulent flow pattern.Note that in Fig.4,the non-dimensional vorticity is defined as¯ω=ωc/U∞where ω,c,and U∞are the vorticity,chord length of airfoil,and freestream speed,respectively.
4.2.2. Continuous AC plasma actuation
The plasma actuator is turned on at time instant t = 0.The control of post-stall flow is focused on the manipulation of leading edge shear layer as well as suppression of the unfavourable trailing edge vortex rolling up. Figures 4(b)-4(f)show the flow field evolution subject to plasma actuation. It is clearly observed that the separated flow dos not respond immediately to the continuous AC plasma discharge. It is not until 34.632 milliseconds(ms)after the plasma discharge that the flow changes slightly, see Fig.4(b). This phenomenon of delayed response of flow to external forcing,say plasma forcing employed here,is seldom reported in the previous studies.By time t =43.290 ms, the flow separation near the leading edge of airfoil has been greatly suppressed and a spanwise vortex is visible over the upper surface of airfoil with its core located at around x/c=0.4. With time moving on, the original large separation zone has been pushed to move to downstream region beyond about x/c=0.75 refer to Fig.4(d). By t =77.922 ms, the flow has become almost fully re-attached with a small separation bubble near the trailing edge of airfoil,as shown in Fig.4(e). Finally,a new quasi-periodic flow state is established and figure 4(f)illustrates the transient flow field at t = 129.870 ms in this flow regime. At this stage,the continuous AC plasma actuation has achieved success in suppressing the massive flow separation with only a relatively small separation zone being present in the vicinity of trailing edge. This is also confirmed by the comparison of the timeaveraged baseline flow pattern with that forced by AC DBD shown in Figs.5(a)-5(b). Obviously,the baseline case is in a sharp contrast with the forced flow. The controlled flow is a notable improvement over the baseline case without control in terms of the decrease of separation region.
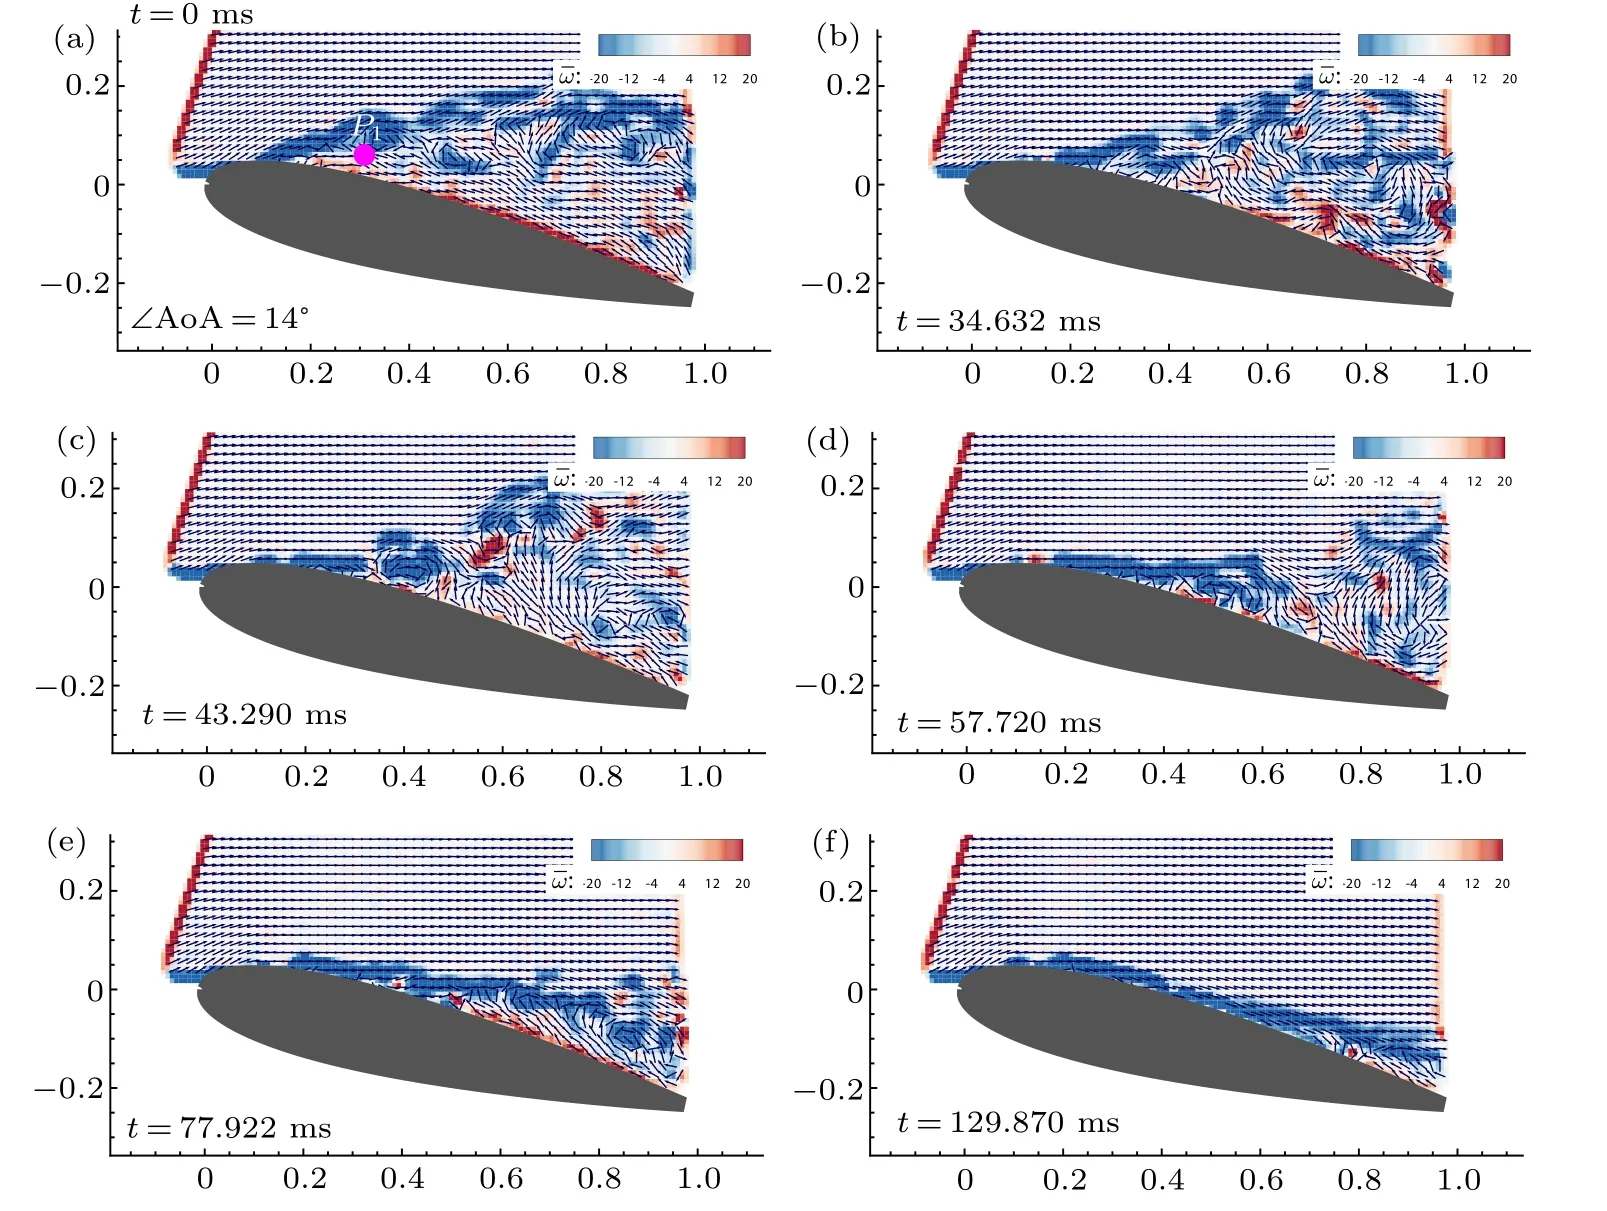
Fig.4. The time sequence of PIV measurements of transient flow field around airfoil model under continuous AC plasma control. Re=3.31×10⁵,∠AoA=14◦.
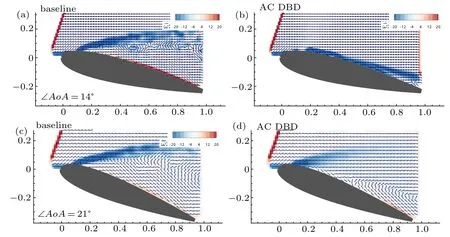
Fig.5. The comparison of time-averaged baseline flow with that forced by continuous AC DBD.In the first row,∠AoA=14◦,whereas in the second row,∠AoA=21◦. Re=3.31×10⁵.
To gain deeper insights into the control process and mechanism of unsteady separated flow with AC DBD plasma excitation, the time history of u velocity component at probe P1shown in Fig.4(a) is recorded and plotted in Fig.6(a). It is seen that with the plasma actuator switched on at t =0, the u velocity increases from around −5 m/s(associated with the reversed flow) to the mean value of around 35 m/s in tens of milliseconds. After time about t=100 ms,the velocity fluctuates slightly only, indicating that the forced flow has evolved into a quasi-periodic state with a typical transient flow pattern in this regime depicted in Fig.4(f). Also plotted in Fig.6(a)is the time history of u velocity for the flow with a higher angle of attack of ∠AoA=16◦.An interesting observation is that the forced flow at ∠AoA=16◦takes a longer time period of about 150 ms to reach the new quasi-periodic flow state and the delayed time is also increased when ∠AoA is increased from 14◦to 16◦. Meanwhile, the flow regularization process between t =0 and 150 ms exhibits larger velocity fluctuations and appears more complex than that with ∠AoA=14◦. It seems that the larger the angle of attack is, the more slowly the flow responds to the plasma actuation and the more complex the flow re-organization process. To the best of our knowledge, the phenomenon of delayed response observed here has not been addressed in the previous studies. In addition, for the flow at intermediate ∠AoA near stall,once the flow is controlled,the topology of main flow structures largely remains unchanged with flow pattern fluctuating slightly only. The reader is encouraged to watch the supplementary video for the flow control process at ∠AoA=16◦.Note that in the video the actuator is turned on at time 0.

Fig.6. Plot(a)shows the time history of u velocity at monitoring point P1 marked in Fig.4(a), whereas plot(b)depicts the time history of u velocity at monitoring point P2 marked in Fig.7(a).
4.3. Flow separation control at high post-stall angle of attack
4.3.1. Baseline flow
In this subsection, the control of separated flow over deeply stalled NACA 0015 airfoil model at high angle of attack of ∠AoA = 21◦is studied experimentally to highlight some physical phenomena peculiar to the control of airfoil flow in deep stall regime. The flow parameters are the same as those of the previous low ∠AoA case in Subsection 4.2 except for a high angle of attack.At the same time,numerical simulation is performed to complement the experiment. The airflow is considered to be fully turbulent and the Reynolds stress turbulence model is employed. An O-type structured grid of 900×300(circumferential×normal)is used with outer boundary being around 20c away from airfoil surface. The outer boundary of grid and airfoil surface are treated as far-field boundary and no-slip wall,respectively. A grid convergence study similar to that presented in Ref. [23] has been performed for the baseline flow without control,but is not presented here to save space.
The instantaneous flow fields around airfoil model from PIV measurement and simulation are presented in Figs. 7(a)and 8(a) for the baseline flow, respectively. The experiment and simulation are in good concurrence in terms of qualitative flow structures like separated shear layer. The simulation result,however,provides more details of the flow features including a strong trailing edge vortex.
4.3.2. Flow control procedure observed from experiment
Again,the plasma actuator is turned on when the baseline flow evolves into the transient state shown in Fig.7(a). The response of the flow separation to the continuous AC plasma discharge is visualized in Fig.7 based on PIV measurement.The flow actuation process depicted in Fig.7 is more complex than that at ∠AoA=14◦shown in Fig.4 and can be divided into three stages: the early stage of flow evolution without response to plasma forcing over time period from 0 to 60.606 ms(stage I), the intermediate stage characterized by preliminary flow reattachment from t =60.606 ms to 141.414 ms (stage II),and the late stage featuring large flow field fluctuation from t=141.414 ms onwards(stage III).
(i)Delayed response of external flow to plasma forcing
Again, it is observed from Fig.7 that in stage I of flow control process, the flow responds very slowly to the plasma discharge and there is no much change in the separated flow structures till t = 60.606 ms, refer to Figs. 7(a)-7(c). In the previous intermediate angle of attack case with ∠AoA=14◦, the external flow starts to respond to the plasma discharge around 30 ms after the actuator is switched on (refer to Figs. 4(a)-4(b) and Fig.6(a)). Meanwhile, the delay time appears to increase with angle of attack increasing and is doubled when ∠AoA is increased from 14◦to 21◦. The flow actuation process observed here contrasts sharply with the scenario of airfoil flow controlled by other means, say the novel nanosecond pulsed plasma actuator reported in Refs.[22,23],where the separated shear layer almost immediately reacts to the forcing and large-scale vortical structure is induced to form in less than 1 ms after the discharge.
(ii)Preliminary flow reattachment
With the flow evolving into the second stage, the flow structure near the leading edge starts to change from time t=62.049 ms. It is known that the AC DBD is a momentumbased active control device. Its control authority steps from the impartation of momentum from jet flow due to plasma discharge to the external flow and therefore is largely determined by the jet velocity. The interaction between the jet flow and separated flow is fairly complex and as shown in Figs. 7(d)-7(k), the formation and development of large-scale spanwise vortices is clearly observed over the upper surface of airfoil.After some time,the massive separation is suppressed significantly,as shown in Fig.7(k)with t=141.414 ms.
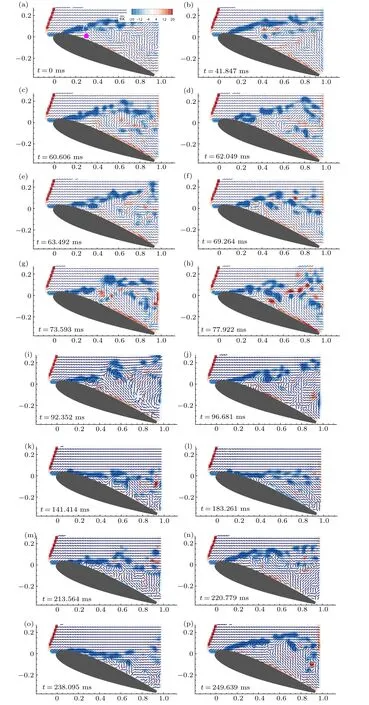
Fig.7. The time sequence of PIV measurements of transient flow field around airfoil model under continuous AC plasma control. Re=3.31×10⁵,∠AoA=21◦.
(iii)Violent flow field fluctuation
In Fig.7(k),the preliminary flow reattachment is realized.However,different from the previous case at lower ∠AoA,the flow pattern in Fig.7(k)is not the final state of the flow under continuous AC plasma forcing with high ∠AoA. The subsequent development of flow field is depicted in Figs.7(l)-7(p).As seen from Figs.7(l)-7(n), the preliminary reattached flow pattern only remains for a short time period and then the already suppressed separation zone starts to grow in size and propagate upstream. By t =220.779 ms, the forced flow almost recovers to the uncontrolled state, refer Fig.7(n). But,the recovered massive flow separation is gradually mitigated again by the plasma discharge and by t = 238.095 ms, the separation zone has been suppressed appreciably and become smaller. However,with time elapsing,the region of separated flow illustrated in Fig.7(o) at t =238.095 ms becomes progressively larger and by t=249.639 ms,once again,the massively separated flow pattern appears, as shown in Fig.7(p).The procedure of recovery and reattachment of flow separation illustrated in Figs.7(l)-7(p)will repeat in a relatively irregular manner. The careful examination of the time-resolved PIV measurements suggests that the flow has reached the late stage of flow development, where the forced flow fluctuates between a typical flow pattern with greatly suppressed separation region(like that shown in Fig.7(o)at t =238.095 ms)and one with recovered large separation zone(like that shown in Fig.7(p)at t =249.639 ms). The whole evolution process of the separated flow under continuous AC plasma excitation exhibits very complex and unsteady characteristics. A video showing the flow control procedure is provided. In the video,the plasma is actuated at time 0.
The complexity of flow control process and resulting flow pattern is also reflected in the variation of u velocity with time depicted in Fig.6(b),which is measured at probe P2marked in Fig.7(a).For the flow without control,the u velocity is a small negative value and slightly fluctuates. After the plasma actuator is turned on,the response of external flow to plasma forcing is delayed for up to tens of milliseconds.The most striking observation made from Fig.6(b) is that after the forced flow experiences the intermediate stage (i.e., the second stage between t=60.606 ms to 141.414 ms),the flow reaches the late stage of development characterized by violent velocity fluctuation.The velocity is fluctuating between the orders of −5 m/s to 30 m/s. The time variation of velocity depicted in Fig.6(b)associated with ∠AoA=21◦is consistent with the flow visualization results presented in Fig.7.
Although the forced flow does not appear to be well reorganized, the time-averaged vorticity and velocity fields of the baseline and actuated flows illustrated in Figs. 5(c)-5(d)show that the plasma forcing has significantly mitigated flow separation and AC DBD is still fairly effective for the control of airfoil flow in the deep stall regime.
It should be remarked that so far very little research has addressed the phenomena of delayed response of flow to AC plasma forcing and violent fluctuation of forced flow field.The angle of attack has an appreciable impact on the forced flow pattern. With the ∠AoA increasing, the delayed time also increases and the excited flow becomes unstable. The mechanisms behind these phenomena are very complex. The occurrence of repetitive massive flow separation from leading edge of airfoil and subsequent re-attachment of separated flow following the realization of the preliminary flow control is conjectured to be related to the complicated interaction between plasma discharge and external flow and inherent instability of external flow. The delayed response may be dominated by the employed AC voltage amplitude and resulting body force due to plasma discharge. Increasing voltage is expected to be able to reduce the delay time and mitigate flow field fluctuation. However, given the complexity of physics of separated flow and plasma discharge, more efforts need to be made to establish the precise relation between the delayed response as well as flow fluctuation and various factors including Reynolds number, AC voltage amplitude, angle of attack of airfoil, airfoil shape,etc.
4.3.3. Simulation results and evaluation of control effect
Attempts are also made to numerically reproduce the above experiment of the flow control and the representative results are illustrated as shown in Fig.8.Nevertheless,the discrepancy between the experimental results presented in Fig.7 and the numerical results shown in Fig.8 is evident. In the simulation, there is no significant delay in the flow structures change after the AC plasma forcing is implemented. A spanwise vortex has been induced to form 2.4 ms after the plasma is actuated,refer to Figs.8(a)-8(b). The large separation zone quickly shrinks from the leading edge of the airfoil and by time t =12 ms it has been forced to shed off from the trailing edge. At t =72 ms, the flow separation has been largely suppressed,see Fig.8(g). But,the flow separation region will grow in size again and the flow finally evolves into the late stage with a transient state as shown in Fig.8(h). Different from the experiment,the resolved forced flow does not fluctuate significantly. As analyzed earlier,the flow separation over the airfoil is fairly complex and its control mechanism has not been fully clarified. The delayed response of the flow separation to the plasma actuation may result from the competition between the plasma discharge and the external airfoil flow,whereas the violent fluctuation of the forced flow field may be a result of the inherent instability of the external flow. However,the body force model employed here is very simple and cannot describe the detailed physics of the plasma discharge and the interaction of the discharge with the external airflow.Meanwhile,as Reynolds stress turbulence model adopted here can only compute the averaged flow quantities, the flow instability and fluctuation of the flow field cannot be faithfully resolved. Our additional numerical experiments, which are not presented here in order to save space, indicate that other classical RANS turbulence models such as k=−ω and k-ε turbulence formulations also cannot reproduce the delayed response and flow field fluctuation.
The time-averaged flow fields from PIV measurement and simulation are compared in Fig.9. Although the dynamic evolutions of flow fields from experiment and simulation are different and the numerical simulation cannot faithfully resolve the delayed response and violent fluctuation of flow field, it is seen that the numerical result agrees well with experimental data in the time-averaged sense, refer to Figs. 9(a)-9(b).The experiment and simulation both lead to a similar flow pattern with significantly suppressed and delayed flow separation over airfoil upper surface. The averaged flow field depicted in Fig.9(a) illustrates that under plasma forcing, the flow separation has been appreciably mitigated relative to the baseline case shown in Fig.7(a). The comparison of the transient baseline flow shown in Fig.8(a)and time-averaged flow field shown in Fig.9(b)obtained from simulation indicates that the separation point is delayed from the leading edge of airfoil to about x=0.25c. Meanwhile,the predicted mean pressure coefficient profiles along airfoil surface are depicted in Fig.10 for the baseline flow and that with control. Compared with the baseline case, the continuous AC plasma actuator is able to recover stronger suction pressure. It is found that the plasma forcing leads to a 39%increase in lift,which also demonstrates the efficacy of AC DBD.
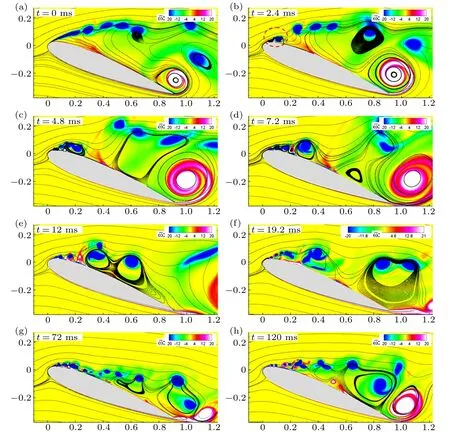
Fig.8. The time sequence of simulated vorticity field superimposed with streamlines subjected to continuous AC plasma control. Re=3.31×10⁵,∠AoA=21◦.

Fig.9. The experimentally measured (a) and numerically simulated (b)time-averaged flow pattern under continuous AC plasma actuation. Re=3.31×10⁵,∠AoA=21◦.

Fig.10.The predicted time-averaged pressure coefficient distributions along airfoil surface. Re=3.31×10⁵,∠AoA=21◦.
5. Conclusion
A combined experimental and numerical investigation of flow separation control over an NACA 0015 airfoil model using continuous alternating current DBD plasma actuator is conducted. The objective of this work is to highlight some experimentally observed phenomena, which is peculiar to ACDBD-based flow control and expected to provide additional insights into the mechanisms of AC DBD plasma actuation.The control of separated flow at Reynolds numbers of Re=3.31×10⁵is investigated. The transient flow field around airfoil under plasma forcing is visualized with the aid of timeresolved PIV system. Meanwhile,the numerical simulation is performed with the macro effect of plasma discharge on external flow modelled with an empirical body force formulation.The angle of attack of airfoil is seen to have an appreciable impact on the behavior of forced flow and control authority. It is interesting to observe that although the response of separated flow to the continuous AC plasma forcing is delayed for all the cases under consideration,the delay time increases with ∠AoA increasing. On the other hand,for the intermediate ∠AoA near stall,the forced flow is characterized by a well re-regularized flow pattern. The flow under plasma excitation is almost fully reattached to airfoil upper surface except for a small separation zone near the trailing edge of airfoil and the forced flow is relatively stable with only small fluctuation in flow field.However, when ∠AoA is increased to a high post-stall value of 21◦, the forced flow behaves quite differently from that at lower ∠AoA. Contrary to one’s first thought that the separated flow at high ∠AoA under plasma control will also become well organized and regular, it is found that for the airfoil flow in deep stall regime,after the preliminary flow reattachment,the forced flow will recover to close to its initial uncontrolled state and then reattach to airfoil surface. The flow pattern violently fluctuates between the re-separated and reattached states, exhibiting very complex characteristics. However, the analysis of qualitative time-averaged flow field and quantitative averaged lift coefficient of airfoil indicates that the AC DBD is very effective for the suppression of flow separation at high post-stall angle of attack and improvement of aerodynamic performance of airfoil.
猜你喜欢
大众文艺(2023年3期)2023-03-03
大众文艺(2023年3期)2023-03-03
新高考·高三数学(2022年3期)2022-04-28
艺术评鉴(2020年2期)2020-03-23
水动力学研究与进展 B辑(2017年5期)2017-11-02
中国钱币(2016年5期)2016-06-15
小说月刊(2015年6期)2015-04-23
雕塑(2000年4期)2000-06-24
军事历史(1997年6期)1997-08-21
- Chinese Physics B的其它文章
- Transport property of inhomogeneous strained graphene∗
- Beam steering characteristics in high-power quantum-cascade lasers emitting at ~4.6µm∗
- Multi-scale molecular dynamics simulations and applications on mechanosensitive proteins of integrins∗
- Enhanced spin-orbit torque efficiency in Pt100−xNix alloy based magnetic bilayer∗
- Soliton interactions and asymptotic state analysis in a discrete nonlocal nonlinear self-dual network equation of reverse-space type∗
- Discontinuous event-trigger scheme for global stabilization of state-dependent switching neural networks with communication delay∗