
Effects of Nb and Mo additions on thermal behavior,microstructure and magnetic property of FeCoZrBGe alloy∗
2021-03-19 03:21YamingSun孙亚明ZhiqunWang王志群ShiChongXu徐仕翀andZhongHua华中
Chinese Physics B 2021年3期
关键词:华中
Yaming Sun(孙亚明), Zhiqun Wang(王志群), Shi-Chong Xu(徐仕翀), and Zhong Hua(华中),†
1National Demonstration Center for Experimental Physics Education,Jilin Normal University,Siping 136000,China
2State Grid Economic Research Institute of East Inner Mongolia Electric Power Company Limited,Hohhot 010020,China
Keywords: alloy,Nb addition,Mo addition,transmission electron microscopy
1. Introduction
Fe-based nanocrystalline materials as one kind of the fundamental functional materials of electronic industry promote the development of related industries to the direction of high efficiency,energy saving and green environmental protection,playing a great role in promoting the progress of modern power and electrical industry technology, which has drawn a great deal of attention.[1-6]
Doping engineering is an effective method and widely used to tailor structures and properties of nanoscale materials, facilitating the construction of various multifunctional materials and devices. It has been reported that transition metals doped in Fe-based alloys have important effects.[7-9]Nb and Mo are popular adding elements due to the fact that they can improve microstructure and properties of Febased alloys effectively.[10,11]Moreover, the effects of Nb and Mo on microstructure and properties of Fe-based alloys have some difference. For FeCuVSiB alloys, Mo was not as effective as Nb in limiting grain growth.[12]For Mo-doped Fe73.5Si13.5B9Nb3−xMoxCu1(x=0,1.5,2 and 3)alloys,when Nb was gradually replaced by Mo, the thermal stabilities of both the ferro-paramagnetic transition of the amorphous phase and the precipitation of the α′′-Fe1−xSixphase were found to deteriorate.[13]For Fe-Si-B-M-Cu(M=Nb,Mo)alloys,replacing Nb by Mo can enhance oxidation resistance.[14]
Our research team has been engaged in the research of FeCoZrB alloys for a long time.[15-17]There is a large heat of mixing between the members of this series. During the process of crystallization, besides Fe(Co) crystallization phase, metastable phase or ZrCo3B2phase can easily form. Adding Nb can slightly reduce the negative enthalpy of mixing of this alloy system, while adding Mo will significantly reduce the negative enthalpy of mixing of this alloy system.[18]Theoretically,the effect of Mo addition on the crystallization phase should be greater than that of Nb addition, which is different from other alloys.[11-14]In this paper,Fe40Co40Zr9−yMyB10Ge1(y=0-4;M=Nb,Mo)amorphous alloys were prepared and annealed at their primary crystallization peak. The effects of Nb and Mo contents on the microstructure and properties of FeCoZrBGe alloys are investigated systemically and compared, to explore which element is more beneficial to microstructure and properties for the Fe40Co40Zr9B10Ge1alloy.
2. Experimental details
Nominal composition Fe40Co40Zr9−yMyB10Ge1(y = 0,1, 2, 3, 4; M=Nb, Mo) alloy ingots were prepared by arc melting with the mixtures of high pure elements. The ingots were remelted for 4 times with the magnetic stirring to ensure the homogeneity under the protection of high purity argon. Then mother alloy ingots were put into a special quartz tube. Amorphous alloy ribbons of Fe40Co40Zr9−yMyB10Ge1(y=0,1,2,3,4;M=Nb,Mo)were prepared by a single roller melt spinning technique(the copper-wheel rate is 38 m/s)and annealed at their primary crystallization peak in vacuum.
Differential scanning calorimetry(DSC)was recorded by a simultaneous thermal analyzer (STA, 449F5). The structures of alloys were checked by x-ray diffractometer (XRD,D/max 2500/PC, Cu-Kα, λ = 1.5406 ˚A, 40 kV, 200 mA).Grain size D of α-Fe(Co) crystals was calculated by Jade 5.0. Microstructures were analyzed by transmission electron microscopy (TEM, FEI Talos F200). Fischione Model 1050 TEM Mill was used to prepare TEM samples. Using digitalmicrograph software to analyze TEM images. Coercivity Hcwas measured by a DC B-H loop tracer(RIKEN BHS40).
3. Results and discussion
Figure 1 shows the DSC traces of Fe40Co40Zr9−yMyB10Ge1(y=0, 1, 2, 3, 4; M=Nb, Mo) amorphous alloys. Both the shape and the location of crystallization peaks change with the addition of Nb and Mo. There are three exothermic peaks in the DSC trace of the Fe40Co40Zr9B10Ge1alloy. With the increase of Nb/Mo content, the primary crystallization temperature Tp1shifts to low temperature. The deviation of the secondary crystallization peak, Tp2, is irregular and the third crystallization temperature Tp3shifts to high temperature. The shift of primary crystallization temperature Tp1is related to the atomic radii. The atomic radii of Zr,Nb and Mo is 0.160,0.148 and 0.140 nm, respectively. During the crystallization process, Zr, Nb and Mo distribute in the residual amorphous matrix. The diffusion rate of atomic with small radius is fast,which decreases the crystallization temperature of the system.Therefore, the primary crystallization temperature Tp1shifts to low temperature with the increase of Nb or Mo content.
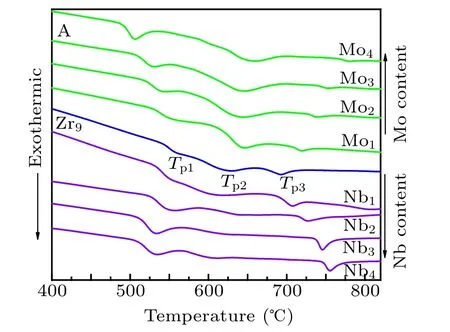
Fig.1. DSC traces of as-quenched Fe40Co40Zr9−yMyB10Ge1 (y=0,1,2,3,4;M=Nb,Mo)alloys.
The primary crystallization peak(Tp1)and the secondary crystallization peak(Tp2)of Fe40Co40Zr9−yMyB10Ge1(y=0,1, 2, 3, 4; M=Nb, Mo)alloys are shown in Fig.2. The gap between the primary crystallization (Tp1) and the secondary crystallization peak(Tp2)of the Mo-containing alloys is much wider compared to the Nb-containing alloys. In addition, the higher the content of Mo is, the wider the gap is. When addition ratio is 4 at%, the effect of Nb is far less than that of Mo on the gap between primary and secondary crystallization temperatures.Adding Mo can increase the annealing scope effectively and the temperature interval can reach 150.5 K when Mo addition is 4 at%.

Fig.2. Primary crystallization peak(Tp1)and secondary crystallization peak(Tp2)of Fe40Co40Zr9−yMyB10Ge1(y=0,1,2,3,4;M=Nb,Mo)alloys.
XRD of Fe40Co40Zr9−yMyB10Ge1(y=0,1,2,3,4;M=Nb, Mo) amorphous alloys annealed at crystallization peak temperatures is given in Fig.3. For the Fe40Co40Zr9B10Ge1alloy,α-Fe(Co)phase,β-Mn type phase and amorphous phase are observed. The crystallization volume fraction is low. For the Mo-containing and Nb-containing alloys,the primary crystallization phase is only α-Fe(Co) phase. There is almost no shift of diffraction peak. With the increase of Mo and Nb content, the diffraction peak strength of α-Fe(Co) phase increases. In other words, the crystallization volume fraction of α-Fe(Co)phase increases with the increase of Mo and Nb content.
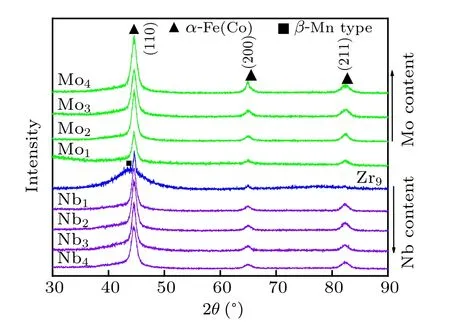
Fig.3. XRD of Fe40Co40Zr9−yMyB10Ge1 (y=0, 1, 2, 3, 4; M=Nb,Mo)amorphous alloys after annealing.
According to the results of XRD, the grain sizes [α-Fe(Co)]of Fe40Co40Zr9−yMyB10Ge1(y=1,2,3,4;M=Nb,Mo) alloys after annealing are given in Fig.4. With the increase of Nb and Mo content, the grain size decreases. The downward trends are obvious. At the same content of Mo and Nb,the grain size[α-Fe(Co)]of Mo-containing alloys is lower compared to Nb-containing.
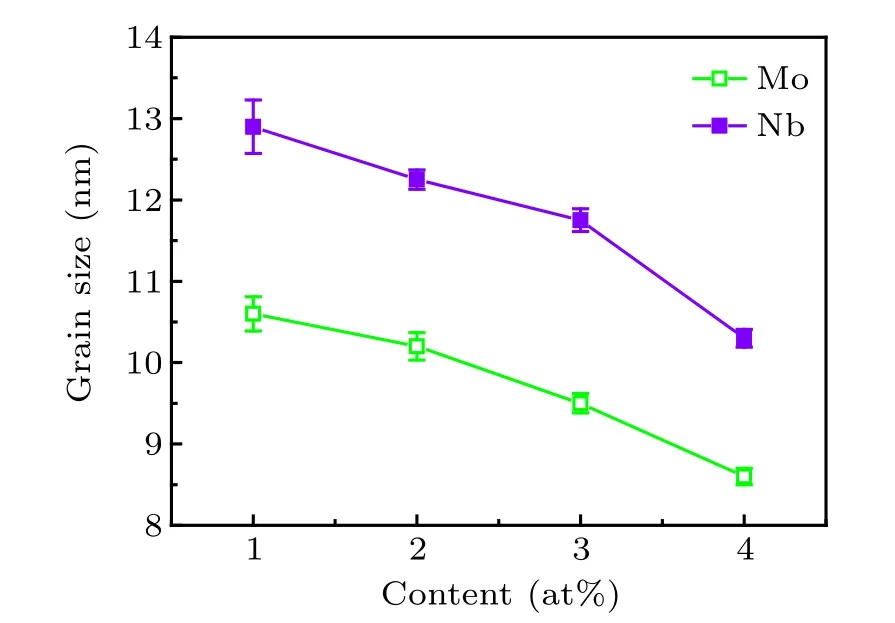
Fig.4. Grain sizes[α-Fe(Co)]of Fe40Co40Zr9−yMyB10Ge1 (y=1, 2,3,4;M=Nb,Mo)alloys with different M contents.
Figure 5 gives the transmission electron microscopy(TEM) images, the corresponding selected-area electron diffraction (SAED) patterns, high resolution transmission electron microscope (HRTEM) images, fourier transform (FFT) images and grain-size distribution images of Fe40Co40Zr9−yMyB10Ge1(y = 0, 4; M = Nb, Mo) alloys after annealing. The TEM image and SAED pattern of Fe40Co40Zr9B10Ge1alloy are shown in Fig.5(a1). The diffraction rings of α-Fe(Co) phase and β-Mn type phase are indexed. The enlarged area of A and B are shown in Figs. 5(a2) and 5(a3), respectively. The corresponding fast fourier transform (FFT) images are shown in the upper right corner. For Fig.5(a2), the FFT shows that the zone axis is body-centered cubic [111] and grain A is α-Fe(Co). For Fig.5(a3), the FFT shows that the zone axis is cubic [411]and grain B is β-Mn type. The TEM image and SAED pattern of the Fe40Co40Zr5Nb4B10Ge1alloy are shown in Fig.5(b1),and the diffraction rings of α-Fe(Co)phase are indexed. The enlarged area is shown in Fig.5(b2). The calculated d-space is 0.201 nm,which is consistent with the value for(110)plane of α-Fe(Co) phase. From Fig.5(b3), the mean grain size is approximately 8.9 nm. The TEM image and SAED pattern of the Fe40Co40Zr5Mo4B10Ge1alloy are shown in Fig.5(c1),and the diffraction rings of α-Fe(Co)phase are indexed. The fine α-Fe(Co) nanocrystals are found to be distributed in the residual amorphous phase. An enlarged area is shown in Fig.5(c2). The calculated d-space is 0.201 nm,which is consistent with the value for(110)plane of α-Fe(Co)phase.From Fig.5(b3),the mean grain size is approximately 6.8 nm. From the TEM images [Figs. 5(a1), 5(b1), 5(c1)], both the crystallization volumes fraction of Fe40Co40Zr5Nb4B10Ge1alloy and Fe40Co40Zr5Mo4B10Ge1alloy are larger than that of the Fe40Co40Zr9B10Ge1alloy without additive elements. From the HRTEM images[Figs.5(a2), 5(b2), 5(c2)], the grain size[α-Fe(Co)]of the Fe40Co40Zr9B10Ge1alloy is larger than that of the Nb- and Mo-containing alloys. The width of grainsize distribution can be determined by the geometric standard deviation (σ). From grain-size distribution [Figs. 5(b3) and 5(c3)],the geometric standard deviation(σ)for the grain size distribution of Mo-containing alloy with 4 at% Mo is sightly broader than that of Nb-containing alloy with 4 at%Nb.
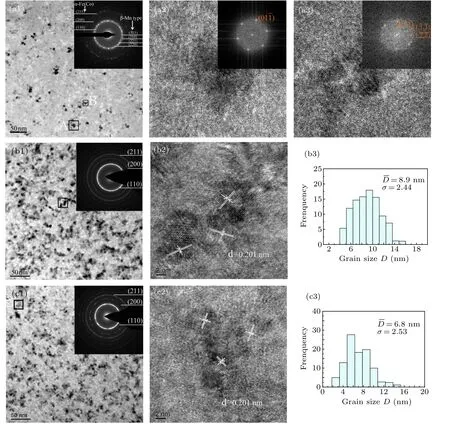
Fig.5. Transmission electron microscopy(TEM)images[(a1), (b1), (c1)], the corresponding selected-area electron diffraction(SAED)patterns [the upper right corner of [(a1), (b1), (c1)], high resolution transmission electron microscope images [(a2), (a3), (b2), (c2)], Fourier transform(FFT)images[the upper right corner of(a2),(a3)]and grain-size distribution images[(b3),(c3),(c3)]of alloys after annealing. (a)Fe40Co40Zr9B10Ge1,(b)Fe40Co40Zr5Nb4B10Ge1,(c)Fe40Co40Zr5Mo4B10Ge1.
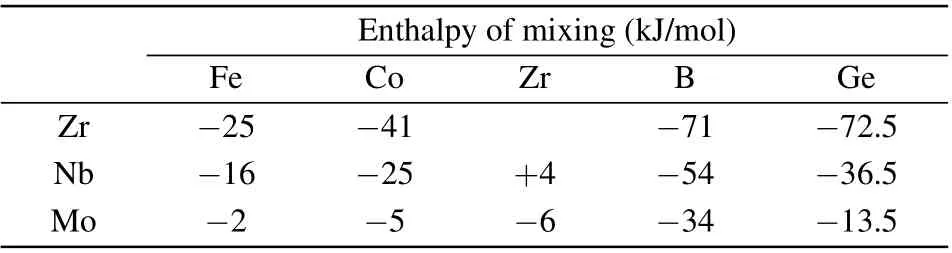
Table 1. Enthalpy of mixing between Zr/Nb/Mo and other elements.
Our research team has been engaged in the research of FeCoZrB alloys for a long time. During the process of crystallization,besides α-Fe(Co)crystallization phase,metastable phase or ZrCo3B2phase can easily form.[15-17]Table 1 gives the enthalpy of mixing between Zr/Nb/Mo and other elements.[18]There is a large negative enthalpy of mixing between the elements of FeCoZrBGe.Compared with Zr,adding Nb reduces the negative enthalpy of mixing, but adding Mo significantly reduces the enthalpy of mixing. If there is a large negative enthalpy of mixing among members,there is a greater attraction among members. The additions of Nb and Mo reduce the negative enthalpy of mixing,thus reducing the attraction between members and resulting in the difference of crystallization products. The effect of Mo addition on the crystallization phase of FeCoZrBGe alloys is greater than that of Nb addition.
Hcof Fe40Co40Zr9−yMyB10Ge1(y=0, 1, 2, 3, 4; M=Nb, Mo) alloys with different M contents is shown in Fig.6.The large Hcof Fe40Co40Zr9B10Ge1alloy is due to the precipitation of β-Mn type phase. With increasing the M content,Hcdecreases and the decrease of Hcfor Mo-containing alloys is more obvious. For the Nb-containing and Mo-containing alloys,only α-Fe(Co)phase precipitates from amorphous matrix. Hcof Mo-containing alloy is lower compared to the Nbcontaining alloy. Suzuki et al.[19]revealed that the value of Hcis in direct proportion to D6and Vcry. From Figs.4 and 5,it is clear that the grain size of Nb-containing alloys is larger than that of Mo-containing alloys under the same proportion.The downward trends of grain size are obvious, which could result in the decrease of Hcquickly. However, the crystallization volume fraction of α-Fe(Co)phase increases with the increase of Mo and Nb contents,which could result in the increase of Hc. Bitoh et al.[20]revealed that the value of Hcis also related to the width of grain-size distribution of α-Fe nanocrystals and Hcincreases with increasing width of the grain-size distribution. The width of grain-size distribution of Mo-containing alloy with 4 at% Mo is slightly broader than that of Nb-containing alloy with 4 at% Nb [Figs. 5(b3) and 5(c3)]. Therefore, the downward trends of Hcbecome slow with the increase of Mo and Nb content.

Fig.6. Coercivity(Hc)of Fe40Co40Zr9−yMyB10Ge1 (y=0,1,2,3,4;M=Nb,Mo)alloys with different M contents.
4. Conclusion
Amorphous alloy ribbons of Fe40Co40Zr9−yMyB10Ge1(y=0,1,2,3,4;M=Nb,Mo)prepared by melt spinning were annealed at their crystallization peak temperatures. The effect of M content on thermal behavior, microstructure and magnetic property were investigated systemically and compared.The effect of Mo addition is greater compared to Nb addition.
(1)With increasing Nb or Mo content,the primary crystallization temperature decreases. The gap between primary and secondary crystallization peaks of Mo-containing alloys is wider compared to Nb-containing alloys.
(2) For the Fe40Co40Zr9B10Ge1alloy, the primary crystallization phases of α-Fe(Co) and β-Mn type are observed.For the Mo-containing and Nb-containing alloys,the primary crystallization phase is only α-Fe(Co)phase. With increasing Nb or Mo content,the grain size of α-Fe(Co)phase decreases.The grain size of Mo-containing alloy is smaller compared to Nb-containing alloy under the same proportion.
(3)With increasing Nb or Mo content,Hcdecreases. Hcof Mo-containing alloy is smaller compared to Nb-containing alloy under the same proportion. For Fe40Co40Zr9B10Ge1alloy,high Mo addition proportion(4 at%)has better effect than high Nb addition proportion on the annealing scope,grain size and Hc.
猜你喜欢
凤凰动漫(军事大王)(2022年1期)2022-04-19
华中建筑(2021年12期)2022-01-17
湘潮(上半月)(2021年10期)2021-12-02
当代水产(2021年1期)2021-03-19
当代水产(2020年10期)2020-03-17
当代水产(2019年2期)2019-05-16
当代水产(2019年1期)2019-05-16
制造技术与机床(2018年12期)2018-12-23
制造技术与机床(2018年9期)2018-09-19
华中学术(2017年1期)2018-01-03
- Chinese Physics B的其它文章
- Transport property of inhomogeneous strained graphene∗
- Beam steering characteristics in high-power quantum-cascade lasers emitting at ~4.6µm∗
- Multi-scale molecular dynamics simulations and applications on mechanosensitive proteins of integrins∗
- Enhanced spin-orbit torque efficiency in Pt100−xNix alloy based magnetic bilayer∗
- Soliton interactions and asymptotic state analysis in a discrete nonlocal nonlinear self-dual network equation of reverse-space type∗
- Discontinuous event-trigger scheme for global stabilization of state-dependent switching neural networks with communication delay∗