
Experimental study of ELM-induced filament structures using the VUV imaging system on EAST
2021-03-22 08:04BangLI李邦TingfengMING明廷凤QingZHUANG庄清FeifeiLONG龙飞飞ShanluGAO高善露QiqiSHI石奇奇YuminWANG王嵎民XiaojuLIU刘晓菊ShaochengLIU刘少承LongZENG曾龙andXiangGAO高翔
Plasma Science and Technology 2021年3期
Bang LI (李邦), Tingfeng MING (明廷凤), Qing ZHUANG (庄清),Feifei LONG (龙飞飞), Shanlu GAO (高善露), Qiqi SHI (石奇奇),Yumin WANG (王嵎民), Xiaoju LIU (刘晓菊), Shaocheng LIU (刘少承),Long ZENG (曾龙) and Xiang GAO (高翔),,*
1 Anhui University, Hefei 230039, People’s Republic of China
2 Institute of Plasma Physics, Chinese Academy of Sciences, Hefei 230031, People’s Republic of China
3 University of Science and Technology of China, Hefei 230026, People’s Republic of China
4 Nanchang University, Nanchang 330031, People’s Republic of China
5 Key Laboratory of Optoelectronic Devices and Systems of Ministry of Education and Guangdong Province, College of Optoelectronic Engineering, Shenzhen University, Shenzhen 518060, People’s Republic of China
Abstract A high-speed vacuum ultraviolet (VUV) imaging system has been developed on the Experimental Advanced Superconducting Tokamak (EAST), which selectively measures line emission with a central wavelength of 13.5 nm (CVI, n=4-2).It has been employed to study edge/pedestal plasma behavior in EAST.Edge localized mode (ELM)-induced filament structures have been captured by the VUV imaging system during the ELMy high confinement mode discharge with both high temporal and spatial resolutions.The typical features (i.e.poloidal width and pitch angle) of the observed filaments are quantitatively characterized based on the VUV imaging data, and the dependence of these features on basic plasma parameters is analyzed.It is found that the poloidal width is proportional to the heating power, and the pitch angle is inversely proportional to the edge safety factor q9 5.The scatterplot shows a positive trend between the poloidal width and the ELM amplitude defined by the relative change in stored energy.These results are based on the condition that the perturbation induced by ELMs is confined to a narrow layer in the plasma.
Keywords: filament, ELM, VUV imaging, H mode, EAST tokamak
1.Introduction
The high confinement mode (H-mode) operation was first discovered in the ASDEX tokamak in 1982 [1].It has been observed and widely studied in tokamak devices with divertor configurations, including the Experimental Advanced Superconducting Tokamak (EAST) [2].Generally, edge localized mode-y (ELMy) H-mode plasmas are characterized by the periodic crash of the edge transport barrier associated with ELMs [3].When the steep plasma pressure gradient and current density at the edge pedestal exceed the plasma stability threshold, ELMs will periodically burst.These modes feature a periodic fast collapse of the edge pressure,a sudden loss of the confinement and a subsequent release of heat and particles onto plasma-facing components.In ELMy H-mode plasmas, the transient heat loads induced by the burst of ELMs can cause serious damage to the materials of the device.In ELM-free H-mode scenarios, there are no such periodic crashes.The first wall material of the existing tokamak devices can withstand these transient heat loads under the current discharge parameters[4].In the next generation of tokamak, such as the International Thermonuclear Experimental Reactor (ITER) device, the stored energy induced by type-I ELMy H-mode in the edge pedestal region is predicted to reach about 100 MJ, compared with other devices, its plasma collision rate is very low,the energy loss caused by an ELM burst may reach about 20 MJ, and the transient heat loads caused by an ELM burst are sufficient to affect the plasma-facing components’ lifetimes [5].To ensure the reliable operation of the device, it is necessary to carry out a series of studies on the transient thermal loads induced by the burst of ELMs.Understanding of the underlying physics of the ELM dynamics may be helpful in the search for an efficient method to meet such challenges.
In general, ELMs are classified as several types depending on the experimental observations, such as ELM frequency and its dependence on the heating power [6].The typical characteristics of type-I ELMs are that the ELM frequency increases with heating power.Although the type-I ELM-caused degradation of plasma confinement is less than that of other ELM types, the energy loss of a type-I ELM is much larger.Based on results from exiting tokamaks, the uncontrolled type-I ELM regime will not be acceptable for ITER operation [7].Therefore, dedicated experimental study of type-I ELMy H-mode related physics, such as ELMinduced filaments, is important.
Filamentary structures induced by ELMs have been observed in many tokamak devices.Filamentary structures in ELMy discharges were clearly observed on MAST by using a high-speed charge-coupled device (CCD) camera with a very short exposure time (20 μs) [8].Since then, such structures have been observed by using CCD cameras on various devices,such as EAST [9], ASDEX-upgrade [10] and DIII-D [11]devices.For these cameras,they mainly measure the emissions in the visible light band,which are mainly contributed from the SOL (scrape-off layer) region.Furthermore, the gas puff imaging diagnostics on NSTX [12, 13], Alcator C-Mod [14],TEXTOR[15]and the ASDEX-upgrade[16]devices can also observe similar blob-like structures.In addition to the above diagnostics, the electron cyclotron emission imaging (ECEI)diagnostics developed on the KSTAR successfully observed the evolution of the ELM filamentary structures [17], and the ECEI system has also been developed on EAST [18, 19].However, it is greatly affected by the lower hybrid wave(LHW)heating system,which is one of the key current driven and heating systems on EAST.
With the development of imaging diagnostic technology,the high-speed vacuum ultraviolet imaging (VUVI) diagnostic technology has been developed for edge plasma studies[20].The diagnostic technology was first built on the Large Helical Device (LHD) [21].It selectively measures photons with a central wavelength of 13.5 nm, which is mainly contributed from the line emission of CVI (n=4-2 transition).On EAST,the high-speed vacuum ultraviolet(VUV)imaging system has been developed since 2016 and has been upgraded recently.Better performance with a semi-tangential viewing field is achieved after the upgrade.ELM-induced filaments are clearly observed from the raw images in type-I ELMy H-mode discharges.
In this work, the features of the filament observed in the VUVI imaging data are quantitatively characterized, and the dependence of filament structures on the plasma parameters is studied.The experimental setup is described in section 2.In section 3, the method for quantitative characterization of the filament,i.e.the poloidal width and pitch angle of the filament structure, is discussed.Dependence of the filament structures on the plasma parameters, and the correlation between the filament width and the ELM amplitude, i.e.ELM-induced energy loss, are investigated in section 4.In section 5, the conclusions are drawn.
2.Experimental setup
After the upgrade of the heating and current drive system,LHW systems (4.6 GHz and 2.45 GHz) and neutral beam injection (NBI) systems with both co- and counter current directions have been proved to be reliable for EAST operation[22].ELMy H-mode plasmas are obtained routinely with different heating methods in the EAST experiment.Figure 1 shows the time history of basic plasma parameters of a typical type-I ELMy H-mode discharge with an upper single null configuration obtained on EAST.In figures 1(a)-(e), the plasma current, loop voltage, line-averaged electron density,plasma stored energy,normalized beta,H98,heating power and line emission intensity ofαD ,are shown,respectively.The lineaveraged electron density is supplied by the central channel of the POINT(POlarimeter-INTerferometer)system[23].TheαD signal shown here is given by an edge channel of theαD array,which monitors the outer target of the upper divertor[24].The L-H transition occurs at about 2.9 s.After t=3.0, there is a stepped increase in NBI heating to 2.7 MW, and the ELM frequency increases as the heating power increases, as shown in figures 1(f)-(h), which are the expanded view of theαD signal under different heating power conditions.It is consistent with the features of typical type-I ELMs[5].In this discharge,the toroidal magnetic fieldBTis −1.6 T.The negative magnetic field denotes that theBTis in the clockwise direction,while the plasma current is in the anti-clockwise direction from the top view of the EAST machine.
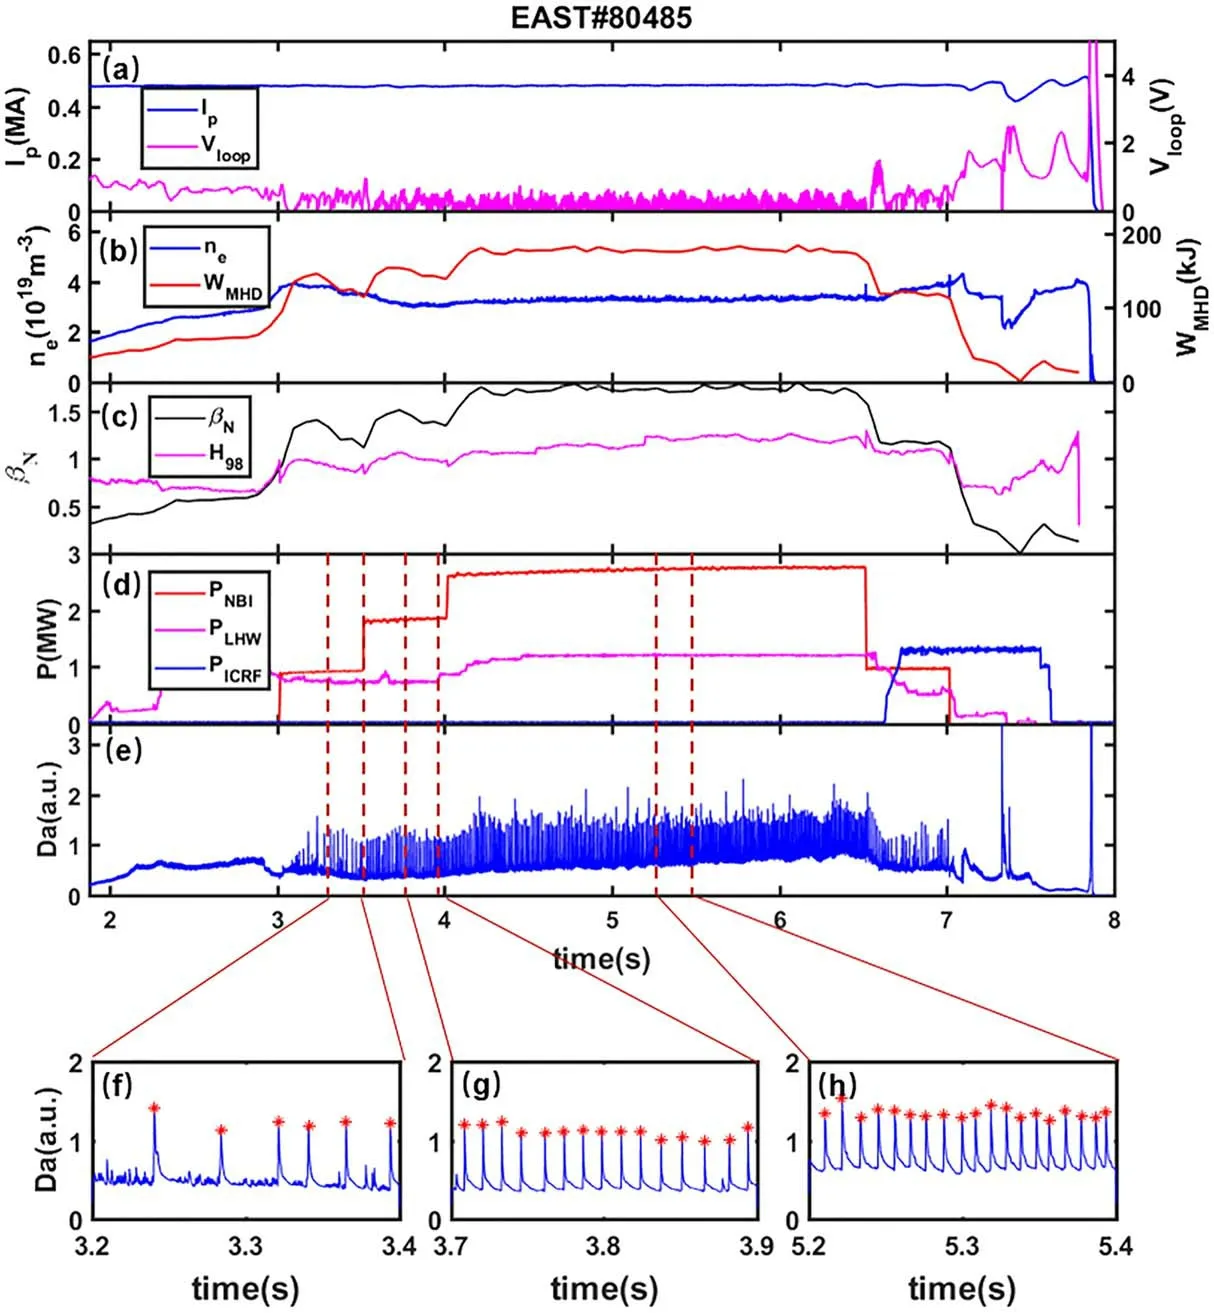
Figure 1.Typical plasma waveforms in type-I ELMy H-mode discharge on EAST:(a)plasma current(Ip)and loop voltage(Vloop),(b)lineaveraged density (ne) and plasma stored energy (WMHD), (c) βN andH98 factor, (d) heating powers from the LHW (PLHW), ion cyclotron range of the frequency wave(PICRF)and neutral beam injection(PNBI),(e) αD intensity,(f)-(h)a zoomed-in view region of the αD signal of the three power steps for shot: #80485 in EAST.
The EAST tokamak is equipped with a molybdenum first wall.The lower divertor and upper divertor are covered with graphite and tungsten,respectively[25].Carbon is one of the intrinsic impurities in EAST plasma.A high-speed VUV imaging system has been developed on the EAST tokamak.Filamentary structures have been successfully captured by these diagnostics [4].A semi-tangential viewing field is achieved after the upgrade in the recent experiment campaign.It is horizontally installed at the horizontal port D of the EAST tokamak, and the included angle between the primary optical axis and the centerline of port D is 22.5° from a top view, as shown in figure 2(a).The center of the detector is 250 mm above the midplane.In this work, the VUVI system is operated with a framing rate of 20 000 frames per second(fps)with an image size of 512×320 pixels.The blue area in figure 2(b)is the field of view of the target plane of the VUVI system in the pedestal region at the low field side.The image size is 512×320 pixels, which covers an area of about 560 mm (toroidally)×360 mm (poloidally) in the plasma region.The horizontal (X) and vertical (Y) axes of the image roughly represent the toroidal and poloidal directions in the plasma,respectively,as shown in figure 2(c).It is an example of the raw image captured by the VUVI system.The black area shows structures, such as shutters of beam emission spectroscopy (BES) and visible camera, support for the BES system inside the vacuum vessel, which are localized inside the viewing field of the VUVI system.For data analysis, the image is resampled by selecting the interesting area,which is defined by the red dashed square.The resampled image size is 256 (pixels)×256 (pixels), and the corresponding coordinates of the lower left and the upper right corners in the raw image are (39, 50) and (294, 305), respectively.However,only the effective plasma area of the image inside the blue dashed line is analyzed since the other area in the resampled image is still shielded by the support of the BES.It should be noted that the geometric center of the observation range of the VUVI system,i.e.the intersection of the primary optical axis and the target plane,is marked with a yellow asterisk symbol.

Figure 2.(a)A top view of the VUV imaging system,(b)a zoomed-in view(blue line in(a))of the target plane of the VUVI system at the pedestal region in the low field side, and (c) a raw image with 512×320 pixels (about 500 mm (toroidally)×360 mm (poloidally) at R=2.28 m).The corresponding real dimensions at the plasma(R=2.28 m)are shown at the top and right axes for reference,respectively.The red dashed square defines the resampled image with a size of 256(pixels)×256(pixels).Images inside the area defined by the dashed lines are selected for analysis in this work.
3.Quantitative characterization of filaments captured by the VUVI system
In the ELMy H-mode discharges, filament structures induced by ELMs are successfully captured by the upgraded VUVI system.Figure 3 shows an example of VUV imaging data obtained in one ELM cycle.Figure 3(a)shows the waveform of VUV emission intensity in one ELM cycle, which is measured by the VUVI system.Figures 3(b)-(d) show a subtracted image series of the VUV imaging data during an ELM burst.Each image is obtained by subtracting imaging data,Ei,at the previous time slice,ti,from the imaging data,Ei+1, taken at the next time slice,ti+1.The magnetic field line(the black solid line)is superposed in figure 3(c).In this work,the subtracted images taken close to the timing when the peak appears on the time evolution of the VUVI signal are selected for statistical analysis since the most distinguishable filamentary structures are generally observed on these images,as shown in figure 3(c).The different colors define the amplitude of the changes in the emission intensities,i.e.yellow and blue colors correspond to positive and negative values, respectively.It should be pointed out that the effective viewing field of the VUVI system is defined by the area inside the blue dashed lines due to the shielding of the wall and other structures inside the vacuum vessel, such as shutters and support of other diagnostics,as shown in figure 2(c).Here,an image size of 256×256 pixels is shown,and only structures inside the effective viewing field will be analyzed.
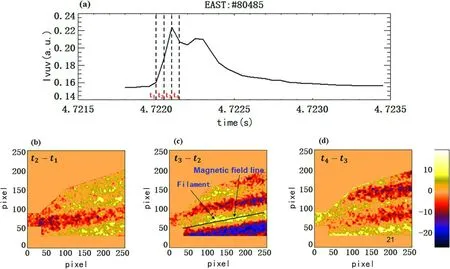
Figure 3.(a) The time history of the impurity emission intensity in one ELM cycle measured by the VUVI system, (b)-(d) a series of subtracted images during an ELM burst period for shot:#80485.The magnetic field line,i.e.the black solid line,is superposed in figure 3(c).
As mentioned in the previous section, the X axis and Y axis of the images roughly denote the toroidal and poloidal directions in the plasma area, respectively, and the measurement is line-integrated along each sightline.It is difficult to identify the radial structure of the filament.However, perturbations induced by ELMs have ballooning-like characteristics, which means that the perturbations are localized in the low field side.It is therefore assumed that perturbations captured by VUVI systems in an ELM cycle are mainly contributed by the emission from the low field side.In this study, only approximate toroidal and poloidal characteristics of the ELM-induced filament are discussed.
To quantitatively characterize the filament structures shown in the VUV imaging data, two parameters, i.e.the poloidal widthωwidthand pitch angleθ, are introduced.It is assumed that each filament is located in the same direction in the viewing field of the VUVI system,and the poloidal width of the filament does not change in this direction.The angleθis defined by the included angle of the central line of the filament and the X axis.In principle,the poloidal widthωwidthis defined by the shortest distance of the two edges (i.e.binormal direction) of the filament in this work, as shown in figure 4(a).However, it is difficult to identify the edge of the filament structure on the raw images due to the data quality.The noise mainly comes from the instrumental effect,such as shot noise, and the complex electromagnetic environment.Technically, the poloidal width is derived through several procedures as follows: (i) select a point (xi) on theXaxis of the image and obtain the corresponding column vector(yi) in the image, (ii) plot the column vector (yi) in figure 5.The widthωiin the vertical direction is derived using Gaussian fitting of the peak or the trough shape of the column vectoryiin the imaging data.The fitting function takes the form of equation (1),

where A represents the amplitude,yiis the position of the peak in the poloidal direction, and it corresponds to the center of the ELM filament structure.Theωirepresents the width of the fitted curve,which implies the width of the filament structure.Meanwhile, the corresponding position (yi) of the peaks or troughs can be recorded.The full width at half maximum(FWHM),ωF,i,of the fitted curve can be obtained by equation (2).
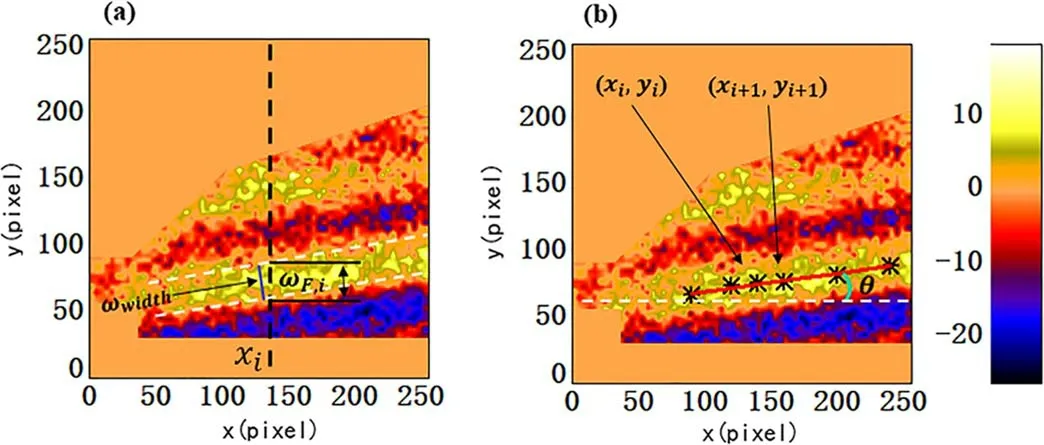
Figure 4.(a)The distance between two black solid lines represents ω F, i ,the distance between two white dashed lines roughly represents the poloidal width of the filament,i.e.ωwidth (the red solid line),and the black dashed line represents the column vector yi .(b)The black asterisk symbols shows a group of data points (x i ,yi), and the solid red line represents the central line of the filament.

Figure 5.Interpretation of the data fitting process.The black line with triangle markers shows the column vector yi ,i.e.the black dashed line in figure 4(a).The blue asterisk symbols denote the selected data points for fitting, and the red solid line represents the fitted curve.

(iii)Repeat steps 1 and 2,a group of data points(xi,yi)of the filament labeled by the black asterisk symbols can be obtained,and the central line of the filament presented by the red solid line can be obtained by fitting these data points, as shown in figure 4(b).Finally,the pitch angleθof the filament can be derived, and the poloidal width of the filamentωwidthcan be obtained by equation (3).

In equation(3),ωwidthrepresents the poloidal width of the filament structure,ωFis the averaged value of allωF,i,and theθrepresents the pitch angle of the filament structure.The specific procedure is summarized as a flow chart,as shown in figure 6.
4.Dependence of filament characteristics on plasma parameters
Following the data analysis method mentioned in section 3,the dependence of filament characteristics, i.e.poloidal width and pitch angle,on plasma parameters,such as heating power and plasma current, is analyzed.In the statistical process, a total of 117 ELM events were counted,and only one filament was selected for analysis during an ELM burst.Figure 7 shows the dependence of the filament poloidal width and heating power.In these discharges, the plasma current is about 0.5 MA, and the toroidal magnetic field is about−1.6 T.The total heating power ranges from 2.2 MW to 4.36 MW.It is shown that the filament poloidal width increases as the heating power increases.The error bar is defined by the standard deviation of the poloidal width data obtained under the same heating power.
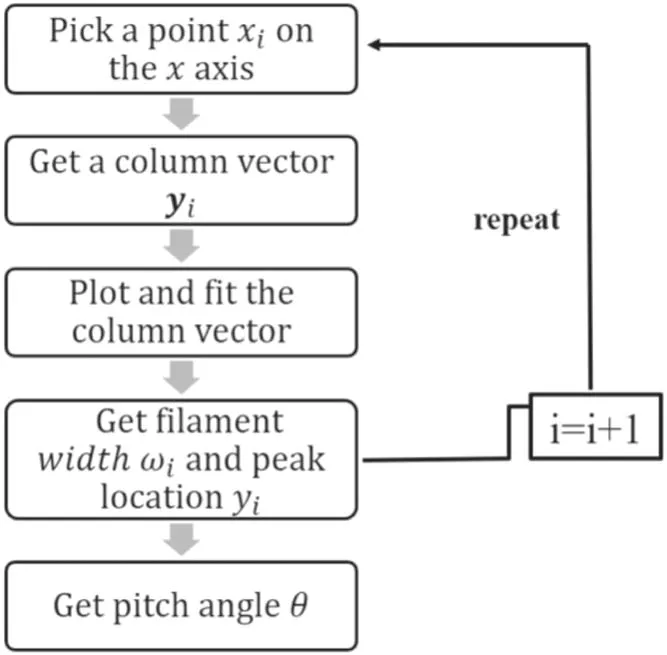
Figure 6.A flow chart for deriving the filament width and pitch angle of the filament structure.
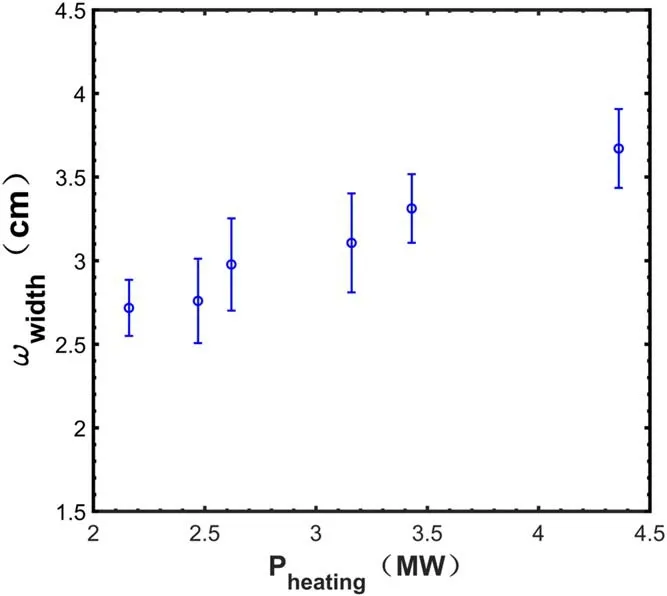
Figure 7.Dependence of the filament width on the heating power.
To investigate the dependence of the pitch angle of the filament on the edge safety factorq95, the toroidal magnetic field is fixed to be −1.6 T.The plasma current varies from 0.4 MA to 0.5 MA.Figure 8 shows the dependence of the fliament pitch angle on the edge safety factorq95.It indicates that the filament pitch angle is inversely proportional toq95when the toroidal magnetic field remains constant.The error bar is defined by the standard deviation of the pitch angle evaluated from the VUV imaging data with a constant toroidal magnetic field, and each error bar is calculated for about 20 filaments.
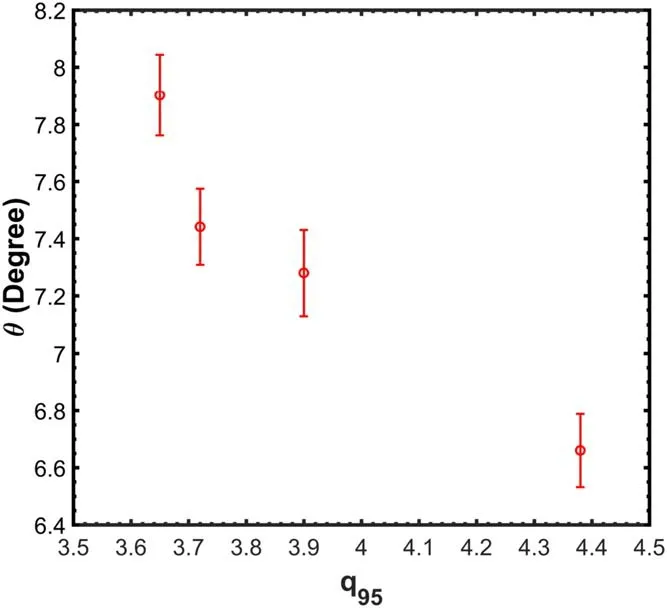
Figure 8.Dependence of the filament pitch angle on the edge safety factor q9 5.

Figure 9.The definition of energy loss in one ELM cycle.The evolution of the αD signal (a) and plasma stored energy (b).
In addition, the dependence of poloidal width on the ELM amplitude is investigated, and about 100 ELM-induced filaments are used for statistics.In the statistical process,there are different definitions of the ELM amplitude in the literature[26].In this work, ELM amplitude is defined as the energy loss, i.e.the relative change in plasma stored energy induced by an ELM, as shown in figures 9(a) and (b).For each individual ELM, the energy loss induced by an ELM burst(WELM(i)) is calculated from theWMHD.The start time of theithELM burst is defined asti.The end time,tend(i),at whichdecreases to exp( −3) of the peak value for theithELM burst, is also defined.For the calculation ofWELM[26], the energy loss due to theithELM,WELM(i),is calculated as the difference between the maximum value and the value ofWMHDattend(i)in a small time interval around theithELM event, i.e.WELM(i)=Wmax(i) −Wend(i).The result is shown in figure 10.The relationship between the poloidal width of the filament and the ELM-induced energy loss shows a certain positive trend.
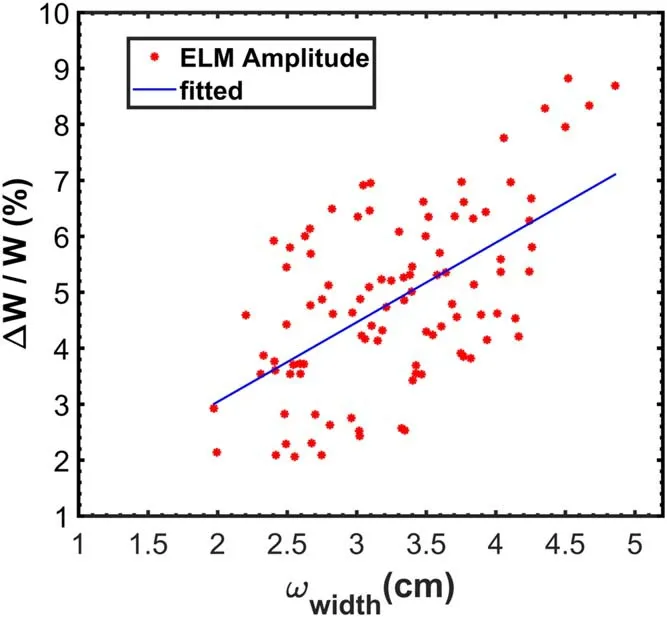
Figure 10.Correlation between ELM amplitude(relative energy loss caused by an ELM burst) and filament width derived by VUVI imaging data.
5.Conclusions and discussion
Filament structures induced by ELMs are successfully captured by the upgraded VUVI system on the EAST tokamak.The features of the filament are quantitatively characterized by poloidal width and pitch angles.Dependence of the filament width and pitch angles on heating power and edge safety factor is investigated,i.e.the poloidal width is proportional to the heating power and the pitch angle is inversely proportional to the edge safety factorq95.By comparing the filament width with the energy loss induced by ELMs, it shows a certain positive trend between the filament width and ELM amplitude.It indicates that the VUVI system developed on the EAST tokamak can be a good tool for studies of ELMrelated physics.However, analysis in this work is only performed on data captured with type-I ELMs.In addition, it should be noted that the analysis is performed under the condition that the ELM-induced perturbation is confined to a narrow layer in the plasma.Further analysis will be performed in different types of ELMs in future.
Acknowledgments
This work is supported in part by the National Key R&D Program of China (No.2017YFE0301205), National Natural Science Foundation of China(Nos.11975271,12075284 and 12075283) and partly supported by Chinese Academy of President’s International Fellowship Initiative (Grant No.2021 VMA0022).The authors are grateful to all collaborators of the EAST team for their contribution to the experiments.
猜你喜欢
政工学刊(2022年6期)2022-05-27
学校教育研究(2021年12期)2021-07-23
作文评点报·低幼版(2020年16期)2020-04-20
艺术评论(2018年3期)2018-05-16
金山(2016年10期)2016-11-25
学苑创造·A版(2014年6期)2014-08-04
故事会(2013年18期)2013-09-18
第二课堂(小学版)(2013年2期)2013-04-11
琴童(2009年4期)2009-04-21
 Plasma Science and Technology2021年3期
- Plasma Science and Technology的其它文章
- Numerical simulation of laser-induced plasma in background gas considering multiple interaction processes
- Kinetic-theory-based investigation of electronegative plasma-wall transition with two populations of electrons
- Investigation of the fast magnetosonic wave excited by the Alfvén wave phase mixing by using the Hall-MHD model in inhomogeneous plasma
- The theoretical study on intermittency and propagation of geodesic acoustic mode in L-mode discharge near tokamak edge
- Experimental study of sheath potential coefficient in the J-TEXT tokamak
- Nonlinear evolution and secondary island formation of the double tearing mode in a hybrid simulation