
Numerical investigation on photonic microwave generation by a sole excited-state emitting quantum dot laser with optical injection and optical feedback*
2021-05-24 02:25ZaiFuJiang蒋再富ZhengMaoWu吴正茂WenYanYang杨文艳ChunXiaHu胡春霞YanHongJin靳艳红ZhenZhenXiao肖珍珍andGuangQiongXia夏光琼
Chinese Physics B 2021年5期
关键词:艳红
Zai-Fu Jiang(蒋再富), Zheng-Mao Wu(吴正茂), Wen-Yan Yang(杨文艳), Chun-Xia Hu(胡春霞),Yan-Hong Jin(靳艳红), Zhen-Zhen Xiao(肖珍珍), and Guang-Qiong Xia(夏光琼),‡
1School of Physical Science and Technology,Southwest University,Chongqing 400715,China
2School of Mathematics and Physics,Jingchu University of Technology,Jingmen 448000,China
3School of Physics,Chongqing University of Science and Technology,Chongqing 401331,China
4College of Mobile Telecommunications,Chongqing University of Posts and Telecom,Chongqing 401520,China
Keywords: photonic microwave,quantum dot laser,optical injection,optical feedback
1. Introduction
Semiconductor lasers (SLs) with external optical perturbations can display rich nonlinear dynamics, such as periodone (P1), multi-period (MP), chaos (CO), switching, and bistability.[1–7]Among these dynamics,the P1 oscillation has been used to generate photonic microwave signals for the development of radio over fiber (ROF) communication networks, sensors and radar systems.[8–10]In particular, the P1 microwave signal generated by an optically injected SL has attracted considerable attention due to its promising advantages,such as a nearly single sideband(SSB)spectrum,which is helpful to mitigating the power penalty in fiber transmission,widely tunable microwave frequency far over the laser’s relaxation oscillation(RO)frequency,and low cost due to alloptical structure.[8]However, the P1 dynamics inherently include phase noise caused by the spontaneous emission noise of the SLs,which could broaden the microwave linewidth and restrict the practical applications of the microwave signals.[11]Therefore, a microwave stabilization scheme with optical feedback is employed to stabilize the P1 dynamics for narrowing the microwave linewidth.[12–16]For instance,Lo et al.numerically reported that the P1 microwave linewidth can be narrowed by up to more than three orders of magnitude for an optically injected distributed-feedback(DFB)laser with ultrashort cavity optical feedback.[13]Zhuang experimentally introduced two optical feedback loops in an optically injected DFB laser to narrow the P1 microwave linewidth, and found that dual-loop optical feedback can effectively reduce the linewidth by at least one order of magnitude.[14]Simpson et al. experimentally observed a feedback-induced reduction of the P1 microwave linewidth by more than two orders of magnitude for an optically injected DFB laser subject to polarization-rotated optical feedback.[15]Ji et al. experimentally explored the effects of single and dual optical feedback on the P1 microwave linewidth of a vertical-cavity surface-emitting laser(VCSEL)under optical injection, and found that both optical feedback structures can effectively compress the linewidth by at least an order of magnitude.[16]
Additionally,as one type of SLs,a self-assembled quantum dot (QD) laser has received extensive experimental and theoretical study interests.[17–22]Benefiting from the unique nanostructure, the QD lasers possess some excellent performances, such as low relative intensity noise,[23]low sensitivity to external optical perturbation,[24]and better temperature stability.[25,26]Relevant studies have reported the generation of photonic microwave signals through using P1 dynamics in an optically injected QD lasers,[27–30]and obtained a better SSB spectrum than that in a quantum well (QW) laser,[28,30]a large frequency tunable range,[29]a low second harmonic distortion,[30]and a narrowed microwave linewidth.[31]However,these studies are only focused on the case of QD laser operating at the ground-state(GS)emission.In fact,the QD laser is a nanostructured device,which has two lasing thresholds because of its discrete energy levels. As shown in Ref.[19],GS emission and excited-state(ES)emission appear successively with the increase of current. Whereas relevant research shows that,the QD lasers can emit exclusively on the ES versus GS emission is completely suppressed through doping the QD materials,coating the cavity facets,changing the cavity length,or using coupling gratings,[19,32–35]which is named as ES-QD laser in this study. Compared with general QD laser, the ESQD laser possess faster carriers capture rates and higher saturated gains,[35]which are helpful for enhancing the nonlinear dynamical performances.[32–35]However, to our knowledge,the research on the photonic microwaves generated by the ESQD lasers has not been reported. Our earlier work revealed that the ES-QD laser can exhibit rich nonlinear dynamic behaviors under external optical injection,in which a large area of P1 oscillation appears in the positive frequency detuning region.[36]Based on this work, we have studied the distributions of the P1 microwave frequency and microwave intensity within this region,and employed optical feedback technology to stabilize the microwave signal and narrow the microwave linewidth.
In this study, the photonic microwave generated by the P1 dynamics of an optically injected ES-QD laser is numerically studied.The microwave frequency and microwave intensity distributions in the injection parameter space are given.Considering that the generated microwave signal has a wide linewidth of about 2 MHz, an optical feedback loop is further employed to compress the linewidth. The effects of the feedback delay time and feedback strength on the linewidth compression are discussed. Through appropriately adjusting the feedback parameters, the linewidth can be reduced by up to more than one order of magnitude.
2. Theoretical model
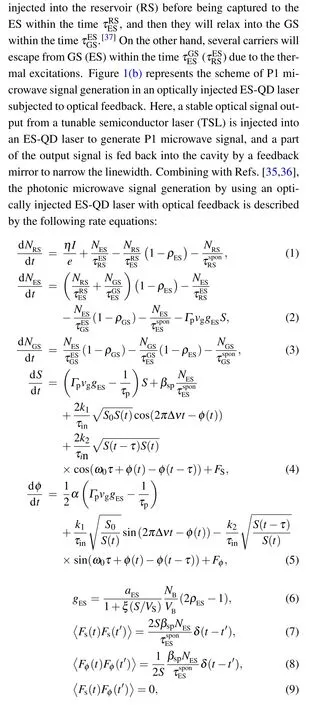
where N, S, φ are the carrier number, photon number, and phase, respectively. GS, ES, and RS represent the groundstate, excited-state, and reservoir, respectively. The superscript spon represents the spontaneous emission. I is the bias current,ρGS(=NGS/2NB)and ρES(=NES/4NB)denote occupancy probabilities in the GS and ES respectively. gESis the gain,τinis the round trip time in the cavity,ω0is the angular frequency of the laser,VSis volume of the laser field. k1and Δν denote injection strength and frequency detuning between the TSL and the solitary ES-QD laser,S0is the photon number output from solitary ES-QD laser. k2and τ represent the feedback strength and feedback delay time. Spontaneous emission noise is considered by adding Langevin noise sources FS(Fφ)in the photon number (electric field phase).[38]The physical meanings and values of other parameters are given in Table 1.The fourth-order Runge–Kutta algorithm with a time step of 1 ps is adopted for numerical simulation, and a time span of 0.5 ms is used to calculate the microwave linewidth.
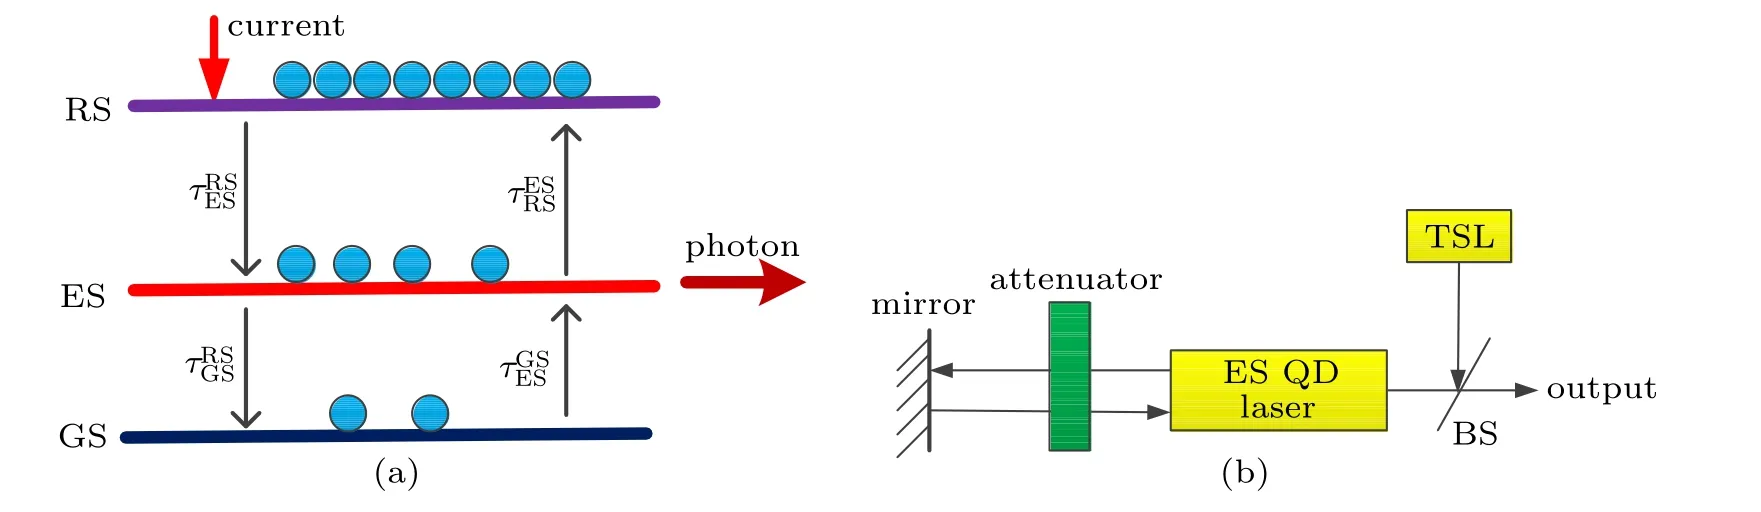
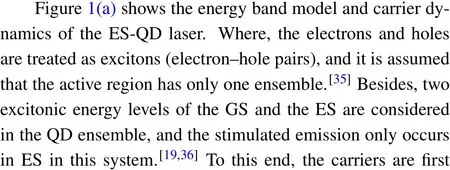
Fig.1. (a)Energy band model and carrier dynamics of the ES-QD laser and(b)scheme of an optically injected ES-QD laser with optical feedback. GS:ground-state;ES:excited-state;RS:reservoir;BS:beam splitter;TSL:tunable semiconductor laser.
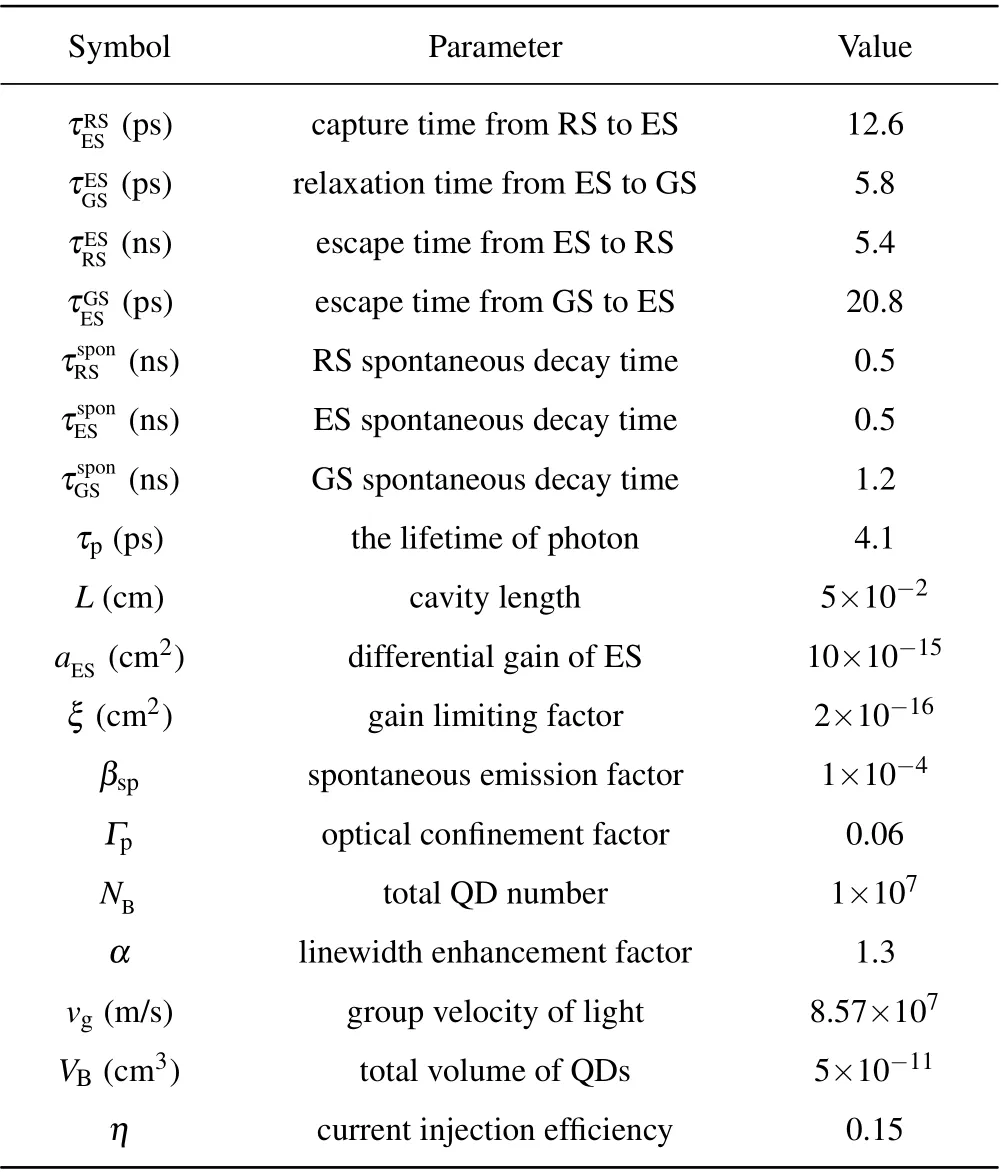
Table 1. Physical parameters of the QD lasers.[35]
3. Results and discussion
Figure 2 exhibits the power–current (P–I) curve and the variation of relaxation oscillation(RO)frequency with current for a solitary ES-QD laser. It can be seen from Fig. 2(a)that the threshold current of the laser is 92.0 mA, after exceeding this value the output power increases linearly with the increase of bias current. In Fig.2(b),the RO frequencies under different currents are obtained through small signal analysis,which increase nonlinearly with the increase of the bias current. In the following simulations,unless stated otherwise,the current is fixed at 184.0 mA,and corresponding RO frequency is 7.60 GHz.The dots in the figure mark the operation position of the ES-QD laser.
First,we discuss the variations of microwave frequency f and microwave intensity P with the injection parameters, the feedback strength k2is set to 0. Figure 3 shows the mappings of f and P as a function of the injection strength k1and frequency detuning Δν. The large colored region represents the P1 states,which are excited by the undamped relaxation oscillation when the laser passes through the Hopf bifurcation line by increasing the frequency detuning.[30]The white part represents other dynamic states. It can be seen from Fig.3(a)that the microwave frequency f is continuously tunable by adjusting the frequency detuning Δν and the injection strength k1.For Δν <22.00 GHz, the microwave frequency f gradually increases with the increase of the injection strength, which is caused by the gradually enhanced redshifting effect of the cavity resonance frequency.[12]However, for Δν >22.00 GHz,the microwave frequency is almost stable with respect to injection strength and approximately equal to the Δν, which is helpful to stabilize the f against injection strength fluctuations in practical applications.[30]As shown in Fig.3(b),for a fixed Δν,as the injection strength increases,the microwave intensity P gradually increases,but slightly decreases near the boundary of the Hopf bifurcation line. It is noted that in the following discussion,for a given Δν,the injection strength k1is selected as the optimal value to maximize the output microwave intensity P.[14]
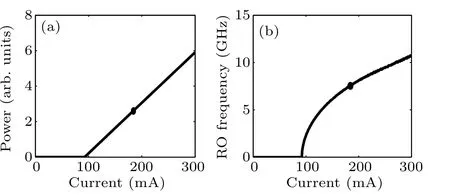
Fig.2. The P–I curve(a)and relaxation oscillation(RO)frequency as a function of current(b).
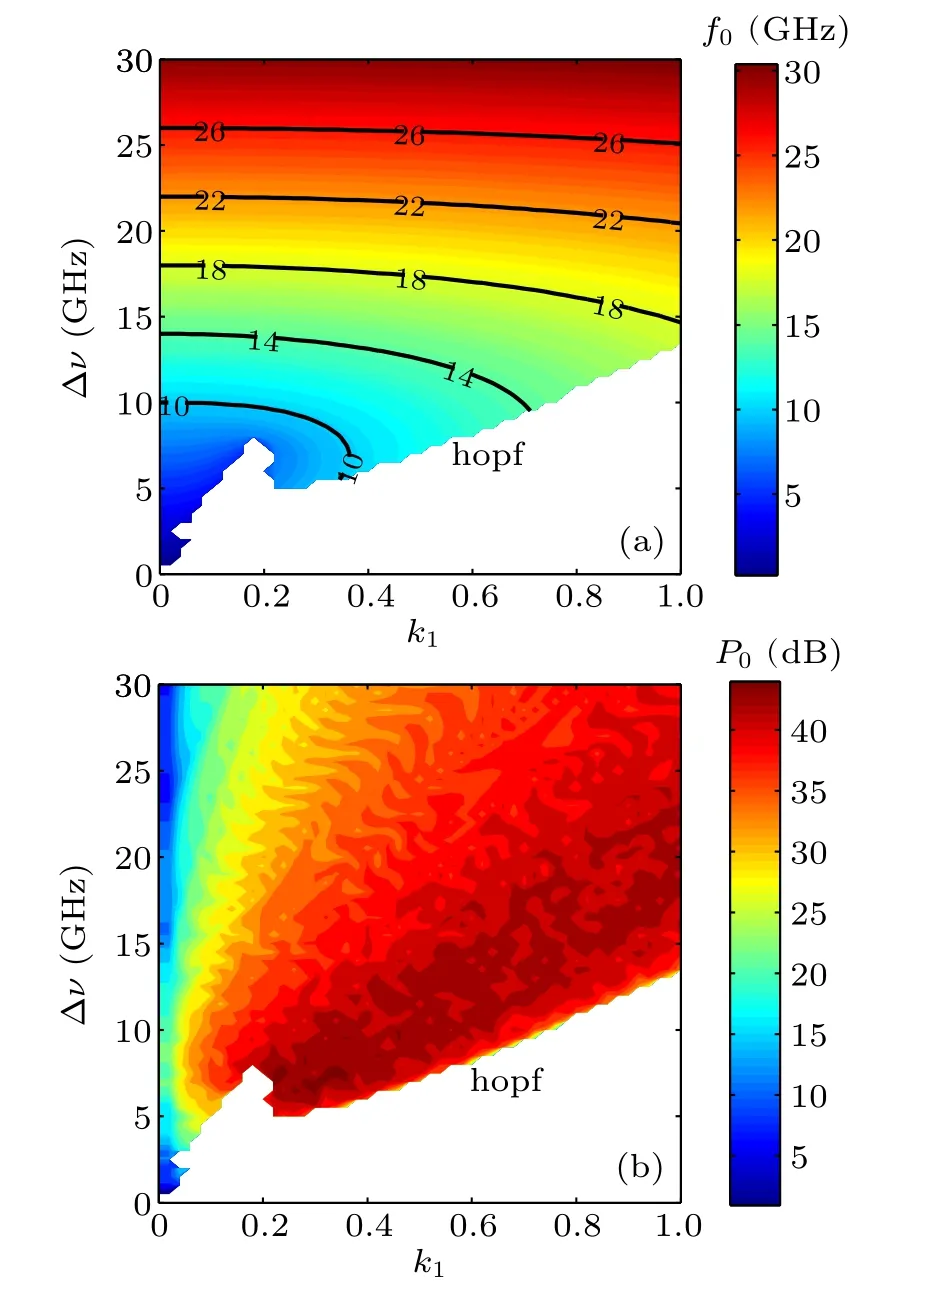
Fig. 3. Distributions of microwave frequency f (a) and microwave intensity P(b)in the parameter space of frequency detuning Δν against injection strength k1.
The above results exhibit the variations of f and P with the injection parameters. In addition,the microwave linewidth is another important indicator to quantify the quality of microwave signals.[12–16]Next, we will focus on the properties of microwave linewidth and further employ optical feedback technology to narrow the linewidth. Due to the randomness of the spontaneous emission noise,the power spectrum output from the optically injected ES-QD laser has irregular fluctuations. Therefore, we use the standard deviation of the frequency distributions with powers in the power spectrum to calculate the microwave linewidth[35]
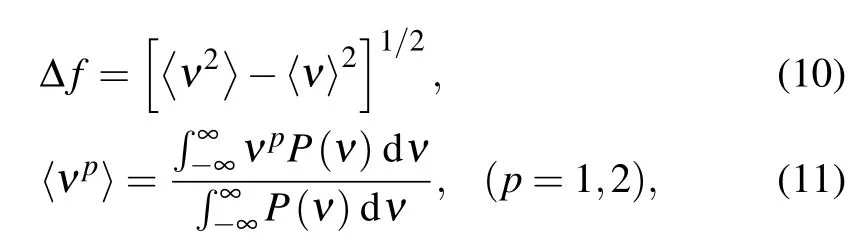
where Δf is the microwave linewidth, ν and P(ν)denote the frequency and corresponding power respectively.
Figure 4 shows the power spectra of the optically injected ES-QD laser operating at P1 dynamics without optical feedback (first column) and with optical feedback (second column) for different injection parameters. Here, the feedback delay time τ is fixed at 2.4 ns. Figure 4(a1)shows the scenario with(Δν, k1)=(10.00 GHz, 0.42), the microwave linewidth is about 2.0 MHz for optical injection only, which is wide.Similar to Ref. [16], we use the optical feedback technology to compress the microwave linewidth. As can be seen from Fig. 4(a2), the linewidth is reduced to 41.6 kHz when the feedback strength k2is equal to 0.022, which is evidently narrowed. It is indicated that the P1 dynamic generated from the optically injected ES-QD laser is locked by its own optical feedback signal.[13]For (Δν, k1)=(18.00 GHz, 0.71),as can be seen in Fig.4(b), the linewidth is compressed from 1.8 MHz to 37.7 kHz when k2is equal to 0.019. Moreover,for(Δν,k1)=(26.00 GHz,0.92),as can be seen in Fig.4(c),the linewidth is compressed from 2.1 MHz to 46.5 kHz when k2is equal to 0.021. These results indicate that the linewidth is effectively compressed by introducing optical feedback. Additionally,as shown in Figs.4(a2),(b2),and(c2),some strong sidebands can be observed around the microwave frequency f,which are attributed to the external cavity modes(ECMs)excited by the external optical feedback.[12,14,39]The frequency interval between two adjacent sidebands is about 416.7 MHz,which is approximately equal to the reciprocal of the feedback time τ (=2.4 ns).

Fig. 4. Power spectra of the optically injected ES-QD laser emissions in P1 dynamics without optical feedback (first column) and with optical feedback (second column). Here the parameters are set as (Δν, k1, k2)= (a)(10.00 GHz, 0.42, 0.022), (b) (18.00 GHz, 0.71, 0.019), (c) (26.00 GHz,0.92,0.021),and the feedback delay time is fixed at τ =2.4 ns.
In the following discussion,the effect of feedback parameters on the microwave linewidth is studied systematically.We first fix the feedback delay time τ to discuss the effect of feedback strength k2. It is worth noting that the relatively large feedback strength could destroy the stability of P1 oscillation and drive the laser to enter other dynamics.[12,13]Therefore,it is necessary to calculate the bifurcation diagram to determine the range of stable P1 oscillations. Figure 5 shows the bifurcation diagrams(first column)and the variation of microwave linewidths(second column)with feedback strength k2for different injection conditions when τ is equal to 2.4 ns. For(Δν,k1)=(10.00 GHz, 0.42), as can be seen from Fig.5(a1), the laser remains in the P1 oscillations when k2increases from 0 to about 0.60. Within this range, the microwave linewidth is calculated and displayed in Fig.5(a2). It can be seen that the linewidth gradually reduces from 2.0 MHz to 41.6 kHz when k2increases from 0 to 0.022. The mechanism of linewidth reduction is that the P1 dynamics is locked by its own optical feedback signal more strongly as the feedback strength increases.[13]Further increasing k2from 0.022 to 0.060, the microwave linewidth increases slowly accompanied by slight fluctuations. The reason is that the P1 dynamic is destroyed gradually with the increase of k2, when k2is over 0.060, the ES-QD laser starts to work in the other dynamics. In addition,according to the dotted line in the figure,one can observe that the linewidth of the P1 microwave is narrowed up to more than one order of magnitude as k2is within[0.012,0.060]. For(Δν,k1)=(18.00 GHz,0.71),as can be seen in Fig.5(b),the laser remains in the P1 oscillations when k2increases from 0 to about 0.080.Within this range,as k2increases from 0 to 0.019,the linewidth Δf gradually reduces from 1.8 MHz to 37.7 kHz,further increasing k2, Δf increases slowly. Moreover, the linewidth is narrowed up to more than one order of magnitude as k2is within[0.01,0.080]. For(Δν,k1)=(26.00 GHz,0.92),as can be seen in Fig.5(c),the ES-QD laser remains in P1 oscillation when k2is increased from 0 to 0.097. Within this range, the linewidth gradually reduces from 2.1 MHz to 46.5 kHz when k2is increased from 0 to 0.021, continue increasing k2,Δ f rises again. Additionally,from the dotted line in the figure, the linewidth is narrowed up to more than one order of magnitude as k2is within [0.011,0.076]. Therefore,the introduction of optical feedback has two effects on the linewidth. On the one hand, the P1 dynamics can be locked on to its own optical feedback signal, which is conducive to narrowing the microwave linewidth.On the other hand,for the relatively large feedback strength, the optical feedback could destroy the P1 dynamics and deteriorate the linewidth narrowing.

Fig. 5. Bifurcation diagrams (first column) and variation of microwave linewidths Δf with feedback strength k2 (second column) under different injection conditions(Δν,k1)=(a)(10.00 GHz,0.42),(b)(18.00 GHz,0.71),and(c)(26.00 GHz,0.92)for τ =2.4 ns. Where the dotted line denotes 1/10 of the Δ f of the microwave generated by optical injection only.
Besides the feedback strength k2,the feedback delay time τis another important parameter that affects the microwave linewidth Δ f.[12]Figure 6 shows the variation of Δf with τ for three different injection parameters (Δν, k1). It is worth mentioning that the injection strength k1is taken at the maximum microwave intensity for a fixed frequency detuning Δν, and the feedback strength k2is taken at the optimal microwave linewidth for the fixed τ =2.4 ns. Therefore, from Fig. 5, for the injection parameters (Δν, k1)=(10.00 GHz,0.5),(18.00 GHz,0.71),and(26.00 GHz,0.92),the feedback strength k2are taken as 0.022, 0.019, and 0.021 to obtain the optimal linewidths,respectively. As shown in Fig.6,for three different parameters, the microwave linewidth gradually decreases with the increase of the feedback delay time until it reaches the optimal value. After reaching the optimal value,it gradually increases as the feedback delay time increases. In order to explore the physical mechanism of the microwave linewidth variation with the feedback delay time, the power spectra for three different feedback delay times under the conditions of(Δν,k1,k2)=(18.00 GHz,0.71,0.019)are given in Fig.7. It can be seen from the figure that the employing of optical feedback can generate the ECMs close to the microwave frequency f,[39]and the mode interval is approximately equal to 1/τ. As the τ increases, the ECMs will become denser.Therefore, the P1 dynamics is locked on to its own optical feedback more strongly.[14]However, as shown in Fig. 7, for a relatively large τ, the intensity of the ECMs is increased,which will destroy the stability of the P1 oscillation and increase the microwave linewidth.

Fig. 6. Microwave linewidth Δf versus feedback delay time τ for the parameters(Δν,k1,k2)=(a)(10.00 GHz,0.42,0.022),(b)(18.00 GHz,0.71,0.019),and(c)(26.00 GHz,0.92,0.021),where the dotted line denotes 1/10 of the Δf of the microwave generated by optical injection only.

Fig.7. Power spectra of P1 microwave under different feedback delay times for the parameters(Δν,k1,k2)=(18.00 GHz,0.71,0.019).
Then, to fully understand the effect of optical feedback on the linewidth Δ f for different microwave frequencies f,figure 8 shows the variation of Δf with f. Where the black circle represents the Δf obtained by optical injection only,the blue square represents the minimum Δ f obtained by optimizing the feedback strength k2after introducing optical feedback,and the red asterisk represents the optimal value of k2to obtain the minimum linewidth. In addition, the parameters are determined by the following methods, the frequency detuning Δνis increased from 10 GHz to 30 GHz. The injection strength k1is selected as the optimal value to maximize the microwave intensity for each frequency detuning Δν,and the feedback delay time τ is fixed at 2.4 ns. The microwave frequency f is determined by the frequency at the optimum microwave linewidth corresponding to each frequency detuning.As can be seen in Fig.8,before introducing optical feedback,the microwave linewidths for different f vary in the range of 1.4 MHz to 2.1 MHz, which are wide. After introducing optical feedback,the microwave linewidths vary from 34.5 kHz to 46.9 kHz and are evidently narrowed. In addition,the optimal values of k2are different for different f,which are varied within the range of[0.017,0.033]. Therefore,the microwave linewidth can be narrowed by up to more than an order of magnitude by appropriately selecting the feedback parameters for different microwave frequencies.

Fig. 8. Linewidth Δf as a function of microwave frequency f 0 for optical injection only(black circle)and both optical injection and optical feedback(blue square)under τ=2.4 ns,where the red asterisk denotes the optimized feedback strength k2.
The above results are obtained under a fixed current value of 184.0 mA. Finally, we discuss the effect of laser current.Figure 9 shows the optimal values of k1and k2for different laser currents and the variation of microwave linewidth with the current when k1and k2take their optimal values. As shown in Figs.9(a)and 9(b),when the bias current varies from 138 mA to 276 mA, the optimal values of k1and k2are different for different laser currents, they vary within the ranges of 0.35–0.57 and 0.022–0.031, respectively. As shown in Fig. 9(c), before employing optical feedback, the microwave linewidth Δ f varies within the range of 1.3 MHz–3.6 MHz when the bias current changes from 138 mA to 276 mA. After employing optical feedback,the microwave linewidths under different laser currents can be compressed to 23.7 kHz–86.0 kHz.
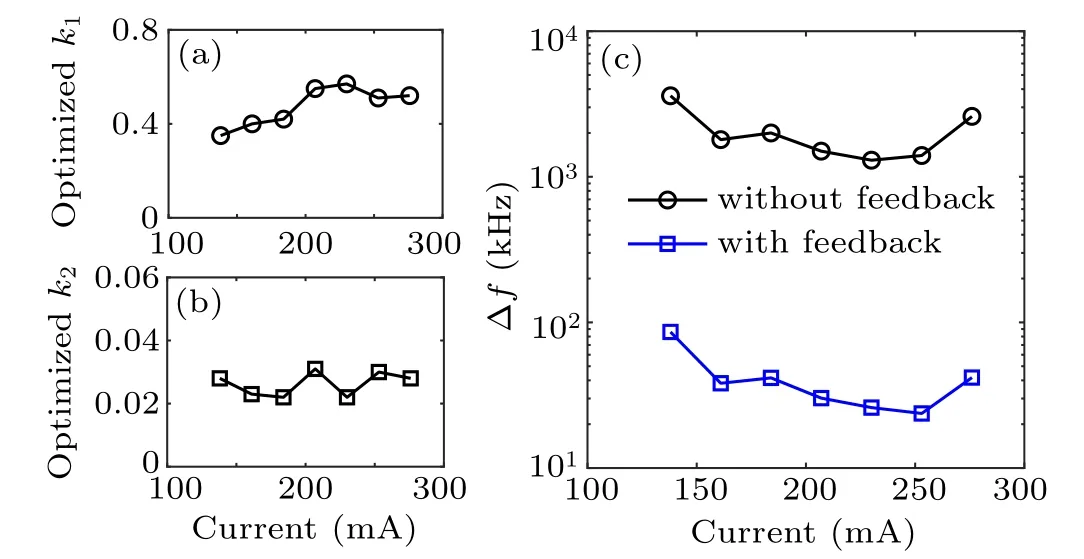
Fig.9.(a)Optimized injection strength k1 for different laser currents,(b)optimized feedback strength k2 for different laser currents,and(c)microwave linewidth Δf as a function of current under k1 and k2 taken their optimal values. Here,Δν =10 GHz and τ =2.4 ns.
4. Conclusion
In summary, the enhanced photonic microwave signal generated by an optically injected ES-QD laser operating at the P1 oscillation through optical feedback stabilization is numerically researched. Within the range of the P1 dynamics caused by the optical injection, the distributions of microwave frequency and microwave intensity in injection parameter space are exhibited. It is shown that the frequency of the microwave signal can be continuously tuned by changing the frequency detuning and injection strength. For a relatively large frequency detuning, the microwave frequency is almost stable with respect to the injection strength and it approximately equal to frequency detuning, which helps to prevent frequency fluctuations in practical applications. In addition,for a fixed frequency detuning,the microwave intensity can be enhanced by changing the injection strength,which increases with the increase of the injection strength and then slowly decreases close to the Hopf bifurcation line. Moreover, in order to narrow the linewidth of the microwave signal, an optical feedback loop is further employed to the system, and the effect of feedback parameters on the linewidth is discussed.The results show that, as the feedback strength or delay time increases, owing to gradually enhanced self-injection locking effect, the linewidth gradually decreases until it reaches the optimal value. After reaching the optimal value, it gradually increases because of the gradually destroyed P1 dynamics.Additionally,through selecting the suitable feedback parameters, the microwave linewidth can be reduced by up to more than an order of magnitude for different microwave frequencies. Besides, the microwave linewidths under different laser currents can also be evidently narrowed by employing optical feedback.This research can provide theoretical support for the generation of photonic microwave signals based on the ES-QD lasers.
猜你喜欢
参花(上)(2022年12期)2022-12-16
数学小灵通·3-4年级(2022年6期)2022-06-17
美与时代·美术学刊(2021年10期)2021-11-25
大众文艺(2021年20期)2021-11-10
音乐天地(音乐创作版)(2019年7期)2019-09-19
应用数学(2019年3期)2019-06-27
快乐作文·低年级(2016年4期)2016-04-25
文学与艺术(2010年1期)2010-04-22
中学生英语·中考指导版(2008年7期)2008-12-19

- Chinese Physics B的其它文章
- Corrosion behavior of high-level waste container materials Ti and Ti–Pd alloy under long-term gamma irradiation in Beishan groundwater*
- Degradation of β-Ga2O3 Schottky barrier diode under swift heavy ion irradiation*
- Influence of temperature and alloying elements on the threshold displacement energies in concentrated Ni–Fe–Cr alloys*
- Cathodic shift of onset potential on TiO2 nanorod arrays with significantly enhanced visible light photoactivity via nitrogen/cobalt co-implantation*
- Review on ionization and quenching mechanisms of Trichel pulse*
- Thermally induced band hybridization in bilayer-bilayer MoS2/WS2 heterostructure∗