
Setup of a dipole trap for all-optical trapping*
2021-05-24 02:25MiaoWang王淼ZhengChen陈正YaoHuang黄垚HuaGuan管桦andKeLinGao高克林
Chinese Physics B 2021年5期
关键词:王淼
Miao Wang(王淼),Zheng Chen(陈正), Yao Huang(黄垚),Hua Guan(管桦),and Ke-Lin Gao(高克林),†
1State Key Laboratory of Magnetic Resonance and Atomic and Molecular Physics,Wuhan Institute of Physics and Mathematics,
Chinese Academy of Sciences,Wuhan 430071,China
2Key Laboratory of Atomic Frequency Standar
ds,Wuhan Institute of Physics and Mathematics,Chinese Academy of Sciences,Wuhan 430071,China
3School of Physical Sciences,University of Chinese Academy of Sciences,Beijing 100049,China
Keywords: dipole trap,AC-Stark shift,trap depth,all-optical trapping
1. Introduction
Isolating ions and atoms from the environment often serves as the experimental key to great scientific advances.For several decades, this has been achieved by trapping ions with RF fields[1]and neutral particles with optical fields.[2]Trapping ions with RF fields features deep trapping potentials and comparatively long lifetimes and it has been widely used in many areas, such as optical frequency standards(OFSs),[3–7]quantum information(QI)[8–10]and quantum simulation (QS).[11–14]The motion of the ions in an RF field can be described by two oscillations differentiated by the amplitude. One of the oscillations is micromotion, which occurs when the ion is not positioned at the saddle point of the RF field, which could be caused by several reasons:stray electric fields, thermal motion and phase difference of trap potential.[15]For OFSs, micromotion induced by the RF field is one of the main contributors of systematic frequency shifts.[5,6,16]Although different strategies for mitigating these effects have been proposed,[17,18]trapping ions optically without any RF fields has the potential to provide a generic solution to the elimination of micromotion.This work was demonstrated in 2010[19]and the results can be seen as the starting point of combining the advantages of optical trapping and RF trapping. In that work,a single24Mg+was trapped in a dipole trap with the RF field switched off for several milliseconds,[19]which is essential for the elimination of RF-induced micromotion in the OFSs of a single40Ca+.
In this letter, we demonstrate the setup of a dipole trap with a highpower 532 nm laser for the all-optical trapping of a single40Ca+. The beam waist of the dipole laser is focused to 3–4 µm and the AC-Stark shift of the fluorescence spectrum line we directly measured is ~22 MHz at the dipole beam power of 1.2 W.Thus,we can deduce that the AC-Stark shift at the maximum power of 6.45 W would be ~118 MHz and the depth of the dipole trap would be deep enough to trap the ion without any RF fields. In our next work, we will try to achieve the all-optical trapping of a single40Ca+in the dipole trap.

Fig. 1. Schematic diagram of the experimental sequence: (a) single 40Ca+ is trapped in the RF field and the cooling and repumping beams are in the x–z plane,with an angle of 45° to the z-axis;(b)dipole beam is aligned with the trap center in the z-axis direction.
2. Experimental setup
The experimental sequence is illustrated in Fig. 1. First,the ion is loaded and cooled in a segmented linear RF trap.Then, we focus the 532 nm dipole beam to the beam waist of a few microns and align it with the center of the RF trap.Finally, we directly measure the AC-Stark shift of the fluorescence spectrum line at different power of the dipole beam and evaluate the potential depth of the dipole trap. The whole experiment apparatus is composed of an ion trap system and laser system.
2.1. Ion trap system
As illustrated in Fig. 2, the segmented linear ion trap used in our experiment is composed of four segmented electrode poles and two endcap electrodes. The radius of a single electrode pole is 4 mm and the center distance of two adjacent electrode poles is 10.6 mm,so the distance from the trap center to the electrode surface is r0= 3.5 mm. The single pole is separated into three segments: the RF field at a frequency of 2π×1.3086 MHz is loaded to the central part and the other two parts are connected to the two respective endcap electrodes. DC compensation voltage of 1.5 V is applied to the two endcaps separately to keep the40Ca+from escaping in the axial direction and the distance between the two endcaps is d=10.6 mm. By adjusting the compensating voltage,we can compensate the excess micromotion at a preliminary level. And in the next step,the compensation electrode should be fine-tuned to the order of a few 10 mV, resulting a residual force on the order of 10−19N at the position of the ion.From the simulation model, we can calculate the dipole trap force is on the order of 10−18–10−17N,which is a level larger than the residual force that is the prerequisite for the all-optical trapping of a single40Ca+. The segmented structure is beneficial to precisely control the position of a single ion or even a string of ions,[20–23]and the comparatively short length and wide pole distance are essential to align the dipole beam with the trap center for the Gaussian shape of the highpower laser,which is also helpful for increasing the numerical aperture of the imaging system. The whole trap is enclosed in a vacuum chamber with a background gas pressure of ~5×10⁻⁹Pa.

Fig.2. (a)Schematic diagram of the segmented linear trap used in our experiment and(b)photograph of the assembled trap.
2.2. The laser systems
The whole laser system consists of three parts: an ablation pulse laser system,a cooling and repumping laser system,and a dipole trap laser system(shown in Fig.3).

Fig.3. Schematic diagram of the whole laser system for all-optical trapping of 40Ca+.
2.2.1. Ablation pulse laser system
To our knowledge, the most widely applied method to produce Ca+is photoionization.[24,25]However, there are some disadvantages to this method,such as an uncontrollable number of loading ions and minute-level loading time. In this work, we use the pulse laser ablation (PLA) method, which features efficiency and simplicity,for ion loading.[26]
The 532 nm pulse laser we used in our experiment has a maximum average power of 1.5 W,maximum repetition rate of 10 kHz and measured pulse width of ~1.81 ns. After passing a beam expander and a focus lens, we observe a beam waist of ~30 µm in the trap center. Due to the small spot size of the laser, we need only very low power to obtain a comparatively high-intensity pulse. Different to the combination of the PLA and photon-ionization method,[26]we can generate a single40Ca+without any dark ions by precisely controlling the number of pulses.
2.2.2. Cooling and repumping laser system
To achieve the all-optical trapping of40Ca+, the ion should be cooled to a relatively low temperature, for example the Doppler cooling limit,[27,28]in the RF trap as a requisite. Two lasers are necessary to set up for Doppler cooling cycles,[29,30]as illustrated in Fig. 4. A 397 nm cooling laser is used to pump the ion from ground state 42S1/2to excited state 42P1/2,and an 866 nm repumping laser,which drives the 32D3/2–42P1/2transition,is used to keep the ion from staying in the 32D3/2metastable state, which would stop the cooling cycles.
The 397 nm and 866 nm lasers are generated by commercial laser diodes(DLC pro,Toptica)and frequency-stabilized to a 10-cm-long cavity. Subsequently, the linewidth of the 397 nm laser is within 0.5 MHz, which is narrow enough for laser cooling of40Ca+, since the natural linewidth of 42S1/2–42P1/2transition is ~22.3 MHz. The power of the 397 nm laser into the trap is 100µW,and that of the 866 nm laser is 500 µW. Before the lasers irradiate to the trap,they pass through acousto-optic modulators (AOM, MT200-UV/IR,AA)separately. By changing the working frequencies of AOMs, we can scan the frequencies of lasers for the fluorescence spectrum line and the scanning range is ~160 MHz.of ~34 mm. The expanded beam is focused with a lens objective(LINOS Focus-Ronar,Qioptiq)featuring a focal length of 77 mm,resulting in an expected minimal beam waist at the position of the ion of wmin= fλ/D ≈1.205µm according to the diffraction limit.
The lens objective is mounted inside a hollowed titanium tube and is positioned via a fine-tuning xz-piezo actuator(P-611XZ,PI).As the outer voltage changes in 10 V,the fine-tuning position with a resolution of 10 nm ranges from 100µm. The actuator is fixed on top of a manual xyz-motion stage(M-562-XYZ,Newport)allowing for coarse-tuning with a resolution of 0.1 mm. The optical axis of every optical element has to be carefully aligned with the laser beam propagation axis, which is essential to a stable dipole trap. The titanium tube housing the lens objective intrudes into one of the reentrant viewports to allow for a small working distance between the lens and the ion of 71.5 mm. On the other side of the chamber the diverging beam is refocused to another beam dump. The optical power entering the chamber decreases to Penter≤6.45 W for the loss of optical elements and AOM.

Fig.4. Relevant energylevel diagram for the Doppler cooling cycles of a trapped 40Ca+.

Fig.5. Schematic diagram of the dipole laser beam path.
2.2.3. Dipole trap laser system
To stably capture the ion in a dipole trap, increasing the laser power and minimizing the beam size are necessary to obtain a sufficiently strong trap potential.As shown in Fig.5,the dipole beam with a beam waist of ~3.4 mm is generated by a commercial laser diode (Verdi-V10) with a maximum output power of 10 W at λ =532 nm. Then, we use a special customized AOM with high power damage threshold and large clear aperture as an optical switch to split the beam mainly into two. The diffraction efficiency of the AOM is as high as 85%,and the response time is within 500 ns. Subsequently,the zerothorder beam is discarded at a beam dump and the firstorder beam is enlarged with a 1:10 beam expander to a beam waist
3. Experimental measurement
After the dipole trap is established,the ion is irradiated by the highpower dipole beam in the trap center. The interaction between the ion and laser beam leads to an intensitydependent shift,namely the AC-Stark shift,of its electronic energy levels,[31,32]which causes an obvious shift of the fluorescence spectrum line. By directly measuring the AC-Stark shift, we can improve the alignment of the dipole beam with the ion,measure the beam waist of the dipole beam and evaluate the trap depth of the dipole potential.

Table 1. Simplified time sequence for measuring the AC-Stark shift.
3.1. Time sequence
A simplified time sequence is depicted in Table 1.We operate two detection steps in a cycle: the first detection shows the original fluorescence signal and the second detection indicates the AC-Stark shifted signal due to the influence of the dipole laser. We then scan the frequency of the cooling laser in two detection steps and obtain two fluorescence lines separately. Comparing the peaks of the two lines,we can directly measure the AC-Stark effect.
3.2. AC-Stark shift and beam waist
The AC-Stark shift of a single energy level equals to the potential depth of the dipole trap, which is proportional to the spatially dependent intensity distribution of the dipole laser.[33]The intensity distribution of trap center I(r,z = 0)can be expressed as
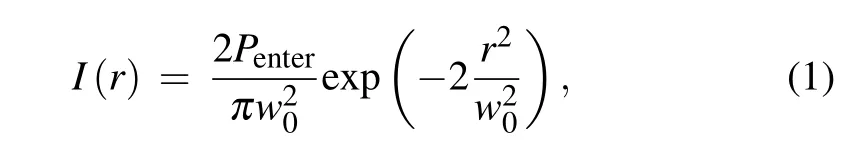
where r denotes the radial coordinate and the beam waist wois the minimum radius of the dipole beam. From the equation,one can find that the AC-Stark shift is proportional to the optical power if the position of the dipole laser is fixed. If we scan the dipole laser horizontally and vertically,the AC-Stark shift will have a maximum at the position of r=0, which means the laser is aligned with the ion perfectly.
By scanning the power of the 397 nm cooling laser from red detuning to blue detuning,we can obtain two fluorescence lines in the detection steps with and without the dipole beam,as shown in Fig. 6(a). By comparing the two lines at different powers of the dipole beam,we experimentally measure the AC-Stark shift depicted in Fig.6(b),where the calculated theoretical value is also shown.

Fig.6.(a)Two fluorescence spectra when measuring the 42S1/2–42P1/2 transition in detection steps with the dipole beam and without the dipole beam and(b)AC-Stark shift versus the power of the dipole beam into the chamber.
From Fig. 6, the AC-Stark shift for the 42S1/2–42P1/2transition is measured as ~22 MHz at a dipole beam power of 1.2 W.Thus,we can deduce from the experimental data fit that the AC-Stark shift at the maximum power of 6.45 W would be~118 MHz, which denotes a sufficiently strong dipole potential. The black line in Fig.6 denotes the theoretical upper bound to the experimental value and this can be explained by the thermal motion of the ion. As the optimal detuning of the 397 nm laser for Doppler cooling is only applied for a short time for the frequency shift effect of the dipole beam,the ion gets tremendously heated,which causes a higher thermal motional amplitude of 3–4µm.This is the same level of the beam waist of the dipole beam at the position of the ion and by averaging over the thermal motional cycles, we can explain the factor between the theoretical and experimental value.
As described in Subsection 2.2.3,the dipole beam can be fine-scanned in both horizontal and vertical directions separately by the objective lens,which is position-tuned via a finetuning xz-piezo actuator. The decrease in fluorescence count caused by the lightinduced AC-Stark shift is determined by the spatially dependent intensity distribution I(r,z),corresponding to the position of the dipole beam,as illustrated in Fig.7 when the power is definite. Therefore, the beam waist can be measured by scanning the position of the laser beam to the position of the ion.

Fig. 7. Beam waist measurements along the piezocontrolled horizontal(a) and vertical (b) axes. Beam position is varied by moving the focusing objective lens system with self-referenced piezo actuators perpendicular to the beam propagation.Red solid lines correspond to the results of a Gaussian model fit,yielding the relative position of the ion and beam waist of the laser beam.
The Gaussian fit (red line in Fig. 7) reveals beam waists on the order of several microns. Compared to the diffraction limit wmincalculated in Subsection 2.2.3,the measured beam waists are larger by a factor of about 2–3. The main limitation in this regard is the size of the beam at the position of the focusing objective,which is determined by the availability of suitable optical elements in the beam line of the dipole laser.However, the small beam waist at the position of the ion results in sufficiently high intensity to set up a dipole trap whose potential should be sufficiently strong.
3.3. Trap depth of the optical dipole trap
The interaction potential of a particle with the induced dipole moment of laser field, namely, the depth of the dipole trap,is expressed as[33]

where ω0and Γ are the transition frequency and natural line width of the energy level,respectively,and ω is the frequency of the dipole beam. According to the above parameters, we expect a trap depth of Udip=−kB×9.7 mK,where kBis the Boltzmann constant. For a single state,the dipole potential is equivalent to its AC-Stark shift,which means U=hΔν,where h is the Planck constant. The deduced 118 MHz shift from the above corresponds to a trap depth of U0=−kB×5.7 mK,which is nearly half of the calculation. This can be easily explained by thermally induced motion of the particle and the influence of stray static electric fields.[34]However,the potential depth is still larger than the Doppler cooling limit TD=0.5 mK of40Ca+by a factor of 11,which denotes the possibility of the all-optical trapping.
4. Conclusion and perspectives
In this paper, we present the setup of a dipole trap that is composed of a high-power 532 nm laser aiming to achieve all-optical trapping of40Ca+. We use a segmented linear trap to load and trap a single40Ca+ion by the RF field and then establish the whole laser system to align the ion with the center of the trap. By direct measurement,the AC-Stark shift for the 42S1/2–42P1/2transition is measured as ~22 MHz at a power of 1.2 W and the beam waist of the dipole laser is measured as less than 4 µm. From these parameters, we deduce the potential of the dipole trap as 5.7 mK, which would be strong enough for all-optical trapping of a single40Ca+. For many reasons, such as the drift of stray electric fields caused by charged particles in viewports, we have not achieved the all-optical trapping in our system to date and we will try to eliminate this effect by changing the viewports to the electric conducting ones in our next work. However,this is still essential to the OFSs of a single40Ca+for the elimination of RFinduced micromotion. More importantly, this method could be extended to several ions, which may be the starting point of experiments that focus on the OFSs of multi-ion and optical lattices. Furthermore,this work demonstrates the hybrid trapping technique of isolated particles,which could open new perspectives for QS and QI based on trapped ions and atoms.
Acknowledgments
The authors thank Xin Tong for the help with the trap design and Huanyao Sun for the help with the RF circuit design. The authors are also grateful to Christian Schneider,Julian Schmidt, Leon Karpa, Sebastian Knuenz, Chengbin Li,Zhaoyang Zhang and Chaohong Li for their helpful discussions and suggestions.
猜你喜欢
作文周刊·小学一年级版(2022年24期)2022-06-18
中国典型病例大全(2022年13期)2022-05-10
作文·小学低年级(2021年4期)2021-11-02
少儿科技(2021年3期)2021-01-20
作文周刊·小学二年级版(2021年44期)2021-01-05
创新作文(1-2年级)(2019年6期)2019-12-16
中学数学杂志(初中版)(2017年4期)2017-08-28
中学数学杂志(初中版)(2016年5期)2016-11-01
数学教学(2013年4期)2013-08-13

- Chinese Physics B的其它文章
- Corrosion behavior of high-level waste container materials Ti and Ti–Pd alloy under long-term gamma irradiation in Beishan groundwater*
- Degradation of β-Ga2O3 Schottky barrier diode under swift heavy ion irradiation*
- Influence of temperature and alloying elements on the threshold displacement energies in concentrated Ni–Fe–Cr alloys*
- Cathodic shift of onset potential on TiO2 nanorod arrays with significantly enhanced visible light photoactivity via nitrogen/cobalt co-implantation*
- Review on ionization and quenching mechanisms of Trichel pulse*
- Thermally induced band hybridization in bilayer-bilayer MoS2/WS2 heterostructure∗