
First-principles calculations of K-shell x-ray absorption spectra for warm dense ammonia*
2021-05-24 02:23ZiLi李孜WeiJieLi李伟节CongWang王聪DafangLi李大芳WeiKang康炜XianTuHe贺贤土andPingZhang张平
Chinese Physics B 2021年5期
关键词:张平
Zi Li(李孜), Wei-Jie Li(李伟节), Cong Wang(王聪),†, Dafang Li(李大芳), Wei Kang(康炜),Xian-Tu He(贺贤土),, and Ping Zhang(张平),,‡
1Institute of Applied Physics and Computational Mathematics,Beijing 100088,China
2Center for Applied Physics and Technology,Peking University,Beijing 100871,China
Keywords: first-principles,warm dense,x-ray absorption spectrum,ammonia
1. Introduction
Ammonia is one of the major constituents of the giant planets in our solar system. Specifically, in Uranus and Neptune, it is supposed that there is a thick layer of “hot ices”,predominantly made up of water,hydrocarbons,and ammonia in solar proportions (molar fractions: 56% H2O, 36% CH4,and 8% NH3).[1]From theoretical estimations, the pressure in this layer could reach 300 GPa, and the temperature is between 2000 K and 5000 K as evinced by the warm adiabatic model,[2–4]or between 7000 K and 14000 K as evinced by a model including a thermal layer.[4,5]The knowledge of the physico–chemical properties of ammonia in these extreme conditions is critical to the understanding of the observable properties (gravitational moments, atmospheric composition,and magnetic field)of the planets.[2,6–8]
At low temperature and ambient pressure,ammonia crystallizes in a proton-ordered cubic phase(phase I),[9,10]where each molecule forms six equivalent weak hydrogen bonds,bent through an angle of 160°. Within 20 GPa and 400 K,a total of five solid phases of ammonia have been discovered,where phase II[11]and phase III[12]are rotationally disordered(plastic) hexagonal close-packed (hcp) and face-centered cubic (fcc) structures, respectively, and phase IV[13,14]and phase V[15–18]are proton-ordered orthorhombic structures. At higher temperature and pressure, a new phase with superionic characteristics above 700 K and 57 GPa[19]was found experimentally, which coincides with the prediction made in a previous theoretical study;[20]however, another experiment could not identify this superionic phase at pressures reaching 60 GPa, and it is speculated that this new phase may only be realized at a higher pressure, due to the chemical dissociation of ammonia.[21]In most of these static experiments on the exploring of the phase diagram, diamond(or tungsten carbide) anvil cells are usually employed to achieve such high pressures,[12–19,21]and the techniques of neutron diffraction(for deuteroammonia ND3),[9,11,13,18]x-ray diffraction[12,16,19,21]and Raman spectroscopy[14,15,17–19,21]are applied to detect the atomic structure and to confirm the phase transitions.
Shock-wave experiments were also conducted on ammonia and mixtures containing ammonia, to establish the equation of states and salient conductivity data under warm dense conditions.[8,22–27]High-explosive techniques were first used to obtain the Hugoniot curve of ammonia up to 39 GPa,and no transition is observed therein within this pressure region.[22]A two-stage light-gas gun was used to reach a pressure of 64 GPa.[23]The first shock temperature measurement on ammonia was performed at pressures of up to 61 GPa to diagnose the behavior under these extreme conditions.[24]The conductivities of the ammonia and the “synthetic Uranus” (a mixture of water, isopropanol, and ammonia)were measured under shock-compressed conditions,[8,25,26]and the low-pressure conductivity was found to be dominated by conduction via hydrogen ions from the dissociation of the molecules.[26]A recent experiment employing laser-driven shock compression could achieve extreme conditions up to 260 GPa and 2.5×10⁴K for a mixture containing ammonia.[27]In these dynamic experiments,the pressure and density of the thermodynamic states are usually determined by measuring shock velocities and fluid velocities, and the temperature is identified by measuring the radiation of shock-heated samples.
On the theoretical side,first-principles molecular dynamics methods have been broadly utilized to examine the phase diagram,equation of states,and chemical reactions of ammonia under extreme conditions. A superionic phase of ammonia, characterized by highly-mobile hydrogen ions diffusing through a nitrogen lattice with hcp structure, was predicted above 1200 K and 60 GPa,[20]a decade before the experimental observation,[19]confirming the predictive power of theoretical methods. The equation of states and the phase diagram of ammonia were then determined up to 330 GPa and 1.0×10⁴K.[28]We investigated the thermophysical and transport properties of shocked liquid ammonia with the pressure and temperature reaching 1.3 TPa and 1.2×10⁵K,and found that liquid ammonia undergoes three structural changes of regime along the principal Hugoniot curve: molecular fluid, mixture,and plasma.[29,30]A combined experimental and theoretical study has examined the physical properties of “synthetic Uranus”, indicating the formation of large clusters of carbon and nitrogen under the thermal conditions deep within the interior of Uranus.[26]At zero temperature,an ionic crystal,characterized by alternate layers of NH+4and NH2ions, was suggested to exist at pressures greater than 90 GPa;[31]other possible zero temperature structures were also discussed.[32]
In order to detect warm dense matter in static and dynamic experiments,the x-ray absorption spectrum(XAS)provides high temporal and spatial resolution.[33–36]The XAS directly relates to the electron transition from the atomic inner shell to unoccupied states, which provides important information on electronic structures and atomic environments. Previous theoretical studies have shown that, under extreme conditions, the changes in the XAS could signal a phase transition,[37,38]nonmetal–metal transition,[39,40]magnetic ordering,[41]or temperature evolution.[42–44]Focusing on nitrogen, the x-ray spectrum has been employed to determine the chemical bonding properties of nitrogen atoms in organic molecules[45,46]and nano-materials;[47]however, there is little information about the XAS of ammonia under extreme conditions,which hinders the application of this powerful tool in relevant experiments. Here, to reveal the importance of XAS in matter detection and provide information for future experimental studies, we perform first-principles calculations to determine the nitrogen K-shell XAS for the ammonia under thermodynamic conditions along the principal Hugoniot curve. A correlation between the shape of XAS curves and the warm dense state is established,and a detailed analysis of atomic structures is undertaken to explain the XAS changes on these Hugoniot states.
2. Computational method and models
The simulations of first-principles molecular dynamics(MD)and the nitrogen K-shell XAS are performed on a series of 10 thermodynamic conditions along the principal Hugoniot curve of ammonia, which has been theoretically determined in our previous work.[30]The density of the conditions increases from 0.8 g/cc in condition 1, to 2.6 g/cc in condition 10, in increments of 0.2 g/cc for intermediate conditions; the corresponding temperature ranges from 250 K to 1.12663×10⁵K, as labelled in Fig. 1(a), with external pressures increasing from 1.2 GPa to 1.3 TPa.[30]The VASP code[48,49]is employed for the MD simulations with a canonical (or NVT) ensemble to achieve the corresponding temperature and density, with the projector augmented wave(PAW)pseudopotentials[50]and the Perdew–Burke–Ernzerhof exchange–correlation functional.[51]The calculations are performed at the gamma point only,and the energy cutoff of the plane-wave basis is 550 eV. Each MD simulation evolves for 8 ps,with a timestep of 0.5 fs–1 fs. A cubic supercell containing 64 ammonia molecules is considered in these calculations,except under conditions 9 and 10,where 32 and 27 molecules are considered,respectively,due to the large computational effort involved.A total of five randomly selected snapshots from each MD trajectory under thermal equilibrium are selected for the analysis of the atomic structure and the determination of XAS.
The K-shell XAS of the nitrogen atom in warm dense ammonia is determined by using the XSPECTRA package[52,53]supplied by the Quantum Espresso distribution.[54]The XAS corresponds to the electron transition from a core 1s orbital on a specified nitrogen atom (referred to as an absorbing atom) to the valance states of the whole system with a core hole on the absorbing atom. For the determination of the XAS, the Troullier–Martins form of norm-conserving pseudopotential[55]is employed and the 1s electron of the nitrogen atom is set as the frozen core. The gamma point is sampled in the Brillouin zone and the energy cutoff of the plane-wave basis is 120 Ry (1 Ry=13.605692312 eV). The calculation is conducted repeatedly by setting each nitrogen atom in the supercell as the absorbing atom at one time, and the final XAS curve(referred to as the total XAS)is an average over both atoms and snapshots. The better to describe the change of XAS under warm dense conditions, an additional all-electron calculation with a larger energy cutoff of 220 Ry is performed on each MD snapshot to determine the absolute energy position of the XAS curve (the eigenvalue of the nitrogen 1s orbital),and a pre-factor of Fermi–Dirac function is added to the XAS.Also,a rigid blue shift of 20 eV is made for all the XAS curves the better to reproduce the experimental results. All these procedures are the same as those described in our previous study on warm dense nitrogen.[56]
3. Results and discussion
The total XAS curves at the ten typical thermodynamic conditions are shown in Fig. 1(a). The main characteristic of the XAS curve is a peak structure located at around 400 eV, followed by a plateau above 420 eV, similar to the experimental results for nitrogen compounds under ambient conditions.[46,57]The position and shape of the peak change significantly with the conditions, making the XAS a good indicator of the warm dense states. According to the change of the XAS,the Hugoniot curve could be classified into three stages. The XAS peak is very sharp and high in conditions 1–4. While in conditions 5–7, the peak becomes broader and lower, and a shoulder structure could be observed at around 405 eV;in particular in condition 7,due to the peak broadening and the shoulder structure, the XAS curve is almost flat between 400 eV and 410 eV. Finally, under conditions 8–10,the peak is even lower and almost undistinguishable from the plateau in the higher energy region.
In Fig.1(b),the relative peak intensity(peak height)and the peak position for the XAS curves are illustrated. The peak intensity decreases monotonically from conditions 1–10, and the intensity of condition 10 is only one-third of that of condition 1. For the peak positions, from conditions 1–7, the peak of the XAS curve shifts slightly to higher energy (i.e., a blue shift), from 399.2 eV in condition 1 to 399.9 in condition 4,and 401.8 eV in condition 7.This shift relates to the shift of the nitrogen 1s energy level,due to the stronger binding between the nucleus and the inner 1s electron at higher temperatures,as pointed out in our previous work.[58]The larger position shift in conditions 5–7 is also related to the presence of the shoulder structure at around 405 eV.While in conditions 8–10,the peak position undergoes a red-shift. This is partially attributed to the uncertainty of the peak position due to the low XAS intensity, as well as the formation of new products under extreme conditions. The width of the XAS peak is shown in Fig.1(c).Here, the width is defined as the energy difference from the peak maximum to the position where the XAS intensity decreases to 1/e(with e the base of the natural logarithm)times the maximum; both the widths from the left and the right of the peak maximum are determined. The width increases from conditions 1–7,due to the increase of structural disorder. The fluctuation of the left-hand width in conditions 8–10 is related to the blue shift of the peak position; the right-hand width in conditions 9–10 could not be determined due to the low peak intensity.

Fig.1. The XAS in conditions 1–10 along the Hugoniot curve. (b)The peak position (black) and peak intensity (blue) of the XAS curves. (c) The XAS peak width from the left(black)and the right(blue)of the peak maximum.
We then examine the contribution of the total XAS curve by each nitrogen atom (referred to as the atomic XAS). For each atomic XAS, we determine its peak position and right width as done for the total XAS curve and demonstrate their distributions for typical conditions in Figs.2(a)and 2(b). Under conditions 1,3,and 5,the peak position is mainly located at around 400 eV and is slightly delocalized with increasing temperature and density. In condition 7,the positions are distributed at almost equal intervals from 400 eV to 410 eV.The peak width is distributed around 1.5 eV for the thermodynamic conditions considered, and the percentage of the peak widths exceeding 2 eV slightly increases from conditions 1–7.
The variety of peak positions and widths of the atomic XAS are attributed to different chemical environments of the nitrogen atoms. Here, we identify the local atomic structures at the Hugoniot conditions to understand the changes in the total XAS curves and deduce connections among XAS data,the atomic structure,and the thermodynamic conditions.Firstly,we examine the local atomic structures under Hugoniot conditions. In Fig. 3, the pair correlation functions (PCFs)of nitrogen–hydrogen (N–H), nitrogen–nitrogen (N–N), and hydrogen–hydrogen (H–H) in typical conditions are plotted,and changes in the nature of the bonding along the Hugoniot curve could be observed.In condition 3,clear peaks are shown in the PCF curves. The PCF of N–H peaks at 1.0 ˚A, corresponding to the N–H bond;the maximum of N–N PCF around 3.0 ˚A reflects the typical separation of NH3molecules;the H–H PCF shows a peak at 1.6 ˚A,related to the H–H separation in one NH3molecule. In conditions 5 and 7,an extra peak of N–N PCF at ~1.2 ˚A indicates the formation of N–N bond, and a shoulder character in H–H PCF at 0.75 ˚A indicates a small amount of H2molecules. In condition 10,no peak appears in the PCFs,indicating a disordered local structure at such a high temperature(105K).
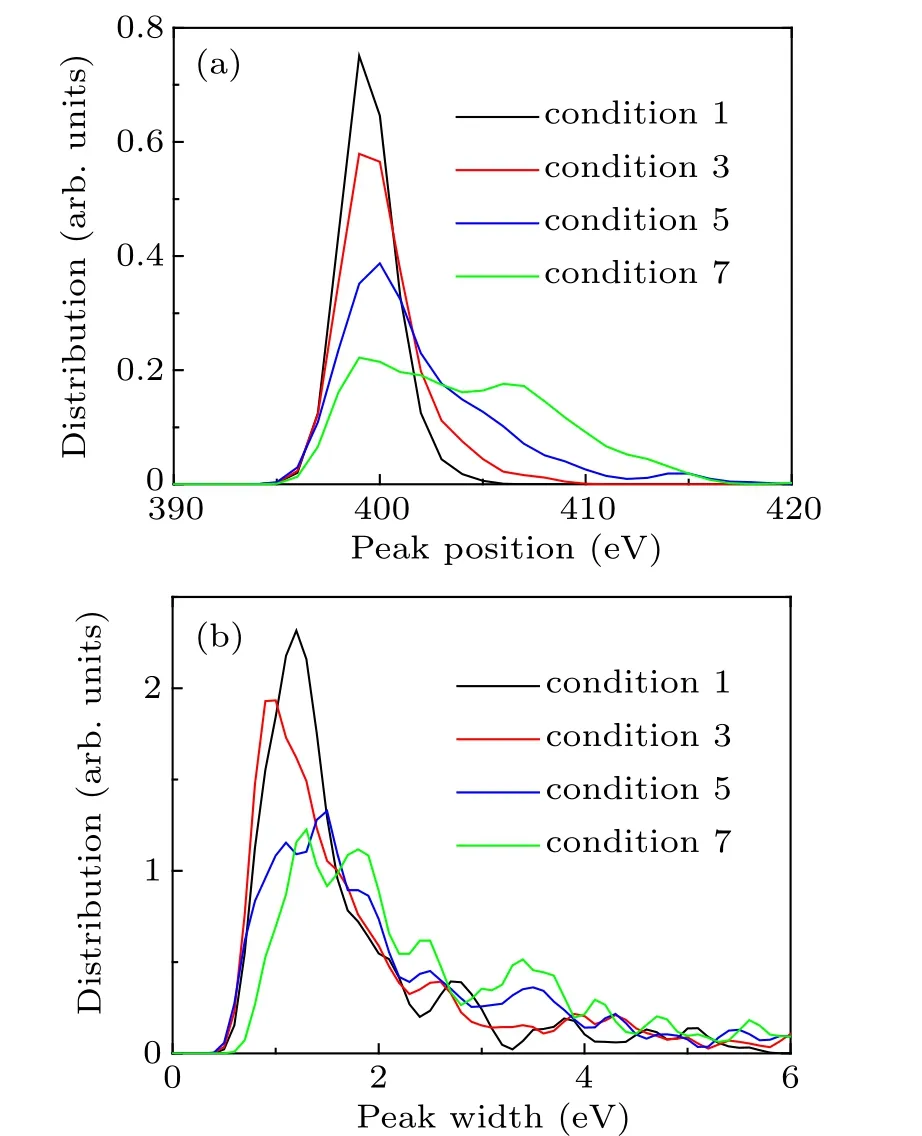
Fig. 2. The distributions of peak position (a) and peak width (b) for conditions 1,3,5,and 7.
The products under the thermodynamic conditions are assessed: the possible products are classified into three types:the pristine ammonia molecule NH3, a fragment NHx(with x=0, 1, or 2) from dissociation, and a nitrogen cluster (Ncluster), where two or more nitrogen atoms are bonded together (hydrogen atoms may also be present therein). Here,two atoms are recognized as being bound if the interatomic distance is smaller than a specified cutoff radius, which is set to 15% greater than the typical bond length. For the N–H bond, the cutoff radius is 1.15 ˚A, corresponding to typical bond lengths of 1.02 ˚A.For the N–N bond,two cutoff values of 1.7 ˚A and 1.4 ˚A are considered,corresponding to N–N single bond(1.46 ˚A)and double bond(1.2 ˚A).The value of 1.7 ˚A is used to justify if a nitrogen cluster is formed,and in a nitrogen cluster,if one of the N–N bond lengths is less than 1.4 ˚A,it is called a type-I nitrogen cluster(or N-cluster I),otherwise,it is called a type-II nitrogen cluster(or N-cluster II).

Fig. 3. The PCFs in (a) condition 3, (b) condition 5, (c) condition 7, and(d)condition 10. The black,red,and blue curves correspond to the PCFs of N–H,N–N,and H–H,respectively.
In Fig. 4(a), the percentage of nitrogen atoms in different types of products is demonstrated. The percentage of NH3is 100% in condition 1 and decreases to 67% in condition 4(while remaining dominant), and to 11% in condition 7; finally,in conditions 8–10,there is only a trace amount of NH3molecules (less than 3%). The fragment NHxappears from condition 2,reaching a maximum of 57%in condition 7,and then decreases from condition 8(42%)to condition 10(23%).The formation of N-clusters begins in condition 5, and the amount increases along the Hugoniot curve (39% for type-I and 36% for type-II in condition 10), with similar ratios for type-I and type-II N-clusters in each condition. With increasing temperature and density along the Hugoniot curve,firstly,the N–H bond breaks and the NHxfragment appears(in condition 2);then,the NHxfragments begin to form N-clusters in condition 5,leading to the proportional amount of NHxchanging slightly from conditions 5–7; finally, in conditions 8–10,the proportional amount of NHxfragments decreases due to the formation of more N-clusters. During the three stages representing change to the XAS curves, the dominant product is the molecule NH3(conditions 1–4), the fragment NHx(conditions 5–7)and the N-cluster(conditions 8–10), respectively. The three stages correspond to the three structural regimes pointed out in our previous work,[29]i.e., molecular fluid regime (dominated by NH3molecules), mixture regime(presence of NH3, NHx, and a small amount of N-clusters),and a plasma regime(characterized by an extremely high temperature and short-lived chemical bonds).

Fig. 4. The analysis of the atomic structure of the MD snapshots in thermodynamic conditions 1–10. (a) The percentages of NH3 molecules, NHx fragments, and N-clusters; (b) the distributions of the distance dNH in each ammonia molecule at typical conditions; (c) the percentages of isolated N atoms, NH, and NH2; (d) the percentages of N-clusters with different numbers of nitrogen atoms.
We then examine the structural deformation of NH3molecules under different thermodynamic conditions. Figure 4(b) shows the distribution of the distance dNHbetween the nitrogen atom and the hydrogen plane(the plane where the three hydrogen atoms of the molecule located), which is labelled as dNHherein. In conditions 1 and 2, dNHis mainly distributed around 0.4 ˚A, close to its value in the gaseous phase (0.38 ˚A, corresponding to the H–N–H angle of 107°).While from condition 3, the distance varies from 0.0 ˚A to 0.6 ˚A, indicating severe deformation of the NH3structure.Figure 4(c) shows the ratios of various types of fragments NHxfor x=0, 1, and 2. The NH2is first formed in condition 2 (2%) and reaches a maximum of 41% in condition 5;the maximum percentages of the NH fragment and isolated N atom are achieved at a higher temperature and density (conditions 7 and 8, respectively), implying that the NH and N atom should be formed from the decomposition of the NH2.In conditions 9 and 10, the NHxfragment-content decreases to 5%–10%, due to the formation of nitrogen clusters. Figure 4(d) shows the distribution of N-clusters with two to five nitrogen atoms, where the solid part and the empty part of the bar indicate the type-I and type-II clusters, respectively.In conditions 5–8,the N-clusters mainly contain two nitrogen atoms, while in conditions 9 and 10, larger N-clusters with three or more nitrogen atoms dominate, due to the formation of more N–N bonds at higher temperature and density;type-I and type-II clusters show similar distributions on the cluster size in each thermodynamic condition. Although the chemical bonds are short-lived in conditions 9 and 10 as pointed out in our previous work,[29]there should be still a significant number of N-clusters at each MD snapshot due to the extremely high temperature and density,which could affect the shape of the XAS curve.
Next, we construct the connection between the atomic structure and the XAS curve.In Figs.5(a)–5(d),the total XAS under typical conditions is decomposed into the contributions from the products of NH3, NHx, and N-clusters (referred to as the decomposed XAS), which is determined by the summation of the atomic XAS of the corresponding product type.In all these conditions,the decomposed XAS curves from the same type of product are similar;specifically,the XAS curves contributed to by NH3molecules show a sharp peak at around 400 eV; the peak widths of XAS curves from the NHxfragment are much larger than those of NH3;for the type-I cluster,the XAS peak is replaced by a broad plateau ranging from 400 eV to 410 eV;the XAS curves of type-II clusters are similar to those of NH3molecules (a sharp peak), but slightly shifted to a lower energy.We also examine the electron density of states(DOS)to show the correlation between the XAS and the electronic structure. In Figs. 5(e) and 5(f), we show the local DOS curves contributed by the products of NH3, NHx,and N-clusters, which are obtained by the summation of the corresponding atomic local DOS.Here,for a specified type of product,the characteristics of the DOS curves above the Fermi energy are very similar to those of the XAS curves: compared to the local DOS of the NH3molecule, the peak of the DOS from the NHxis broader and the peak of the DOS from the type-II cluster shifts to a lower energy;the plateau structure of XAS curves from the type-I cluster is also observed in its DOS curves.
The shape of the total XAS could be understood from the decomposed XAS curves. In conditions 1–4, NH3molecule is the dominant product,giving the total XAS a sharp peak at around 400 eV;the increase(decrease)of the peak width(intensity)is attributed to the deformation of the molecule,as illustrated in Fig.4(b).The broad peak in conditions 5–7 and the shoulder structure slightly above 400 eV is caused by the dominant contribution from the NHx, as well as from the plateau structure of type-I clusters in condition 7. In conditions 8–10,the large number of type-I clusters and the extremely high temperature smear out the peak of the XAS curves,and the presence of the type-II clusters slightly shifts the XAS to the lower energy region. The effects of N-clusters in warm dense ammonia are different from that in warm dense nitrogen, where the formation of the N-clusters induces multiple small XAS peaks at energies between 405 eV and 420 eV, as examined in our previous theoretical study.[56]This difference may be attributed to the presence of hydrogen atoms in warm dense ammonia,that could saturate the dangling bonds in N-clusters and thus eliminate the possible XAS peaks.

Fig. 5. The contributions to the total XAS curve from ammonia molecules NH3 (black), fragments NHx (red), type-I (blue), and type-II (green) Nclusters in (a) condition 3, (b) condition 6, (c) condition 7, and (d) condition 9;the total XAS is plotted as a black dotted curve in each figure,(e)and(f):the electron local DOS from various kinds of products in(e)condition 6 and(f)condition 7;the Fermi energy is set to zero.
Furthermore, the effects of the characteristic parameters(peak position, width, and intensity) of atomic XAS on the shape of the decomposed XAS are explored. Here,we reconstruct the decomposed XAS by replacing the atomic XAS with a model Gaussian function(GF).In model I,the center of the GF is located at the peak position of the atomic XAS,and the width and height are set to an averaged value of all the atomic XAS at each thermodynamic condition. In model II, all the characteristic parameters of GF are the same as those of the atomic XAS curve. The reconstructed XAS curves predicted by the two models are shown in Figs.6(a)–6(d)in conditions 7 and 9. Compared with the first-principles results in Figs.5(c)and 5(d), important characteristics of the XAS curves could be reproduced by model I, such as the broad peak of NHx,the plateau structure of the type-I cluster, and the red shift of the XAS peak for the type-II cluster. When including all of the characteristic parameters in model II, the resulting XAS curves are similar to those derived from first-principles calculations, except for the plateau structure in the high energy region above 420 eV, since the GF used in the models does not consider the long tail of the XAS curves in this region.Since the total XAS curve is the sum of decomposed XAS curves, it is concluded that the distribution of the peak position is the dominant factor affecting the shape of the total XAS curves,and inclusion of all parameters pertaining to peak position,width,and height could reproduce the total XAS curves with accuracy. The peak position is related to the energy level of valance states around the specified nitrogen atom. For the NHxfragment and type-I N-cluster, the presence of the unpaired electron or the nitrogen-nitrogen double bond renders the energy level very sensitive to the atomic structure, thus a broad energy distribution and a large peak width could be expected in the XAS curve.
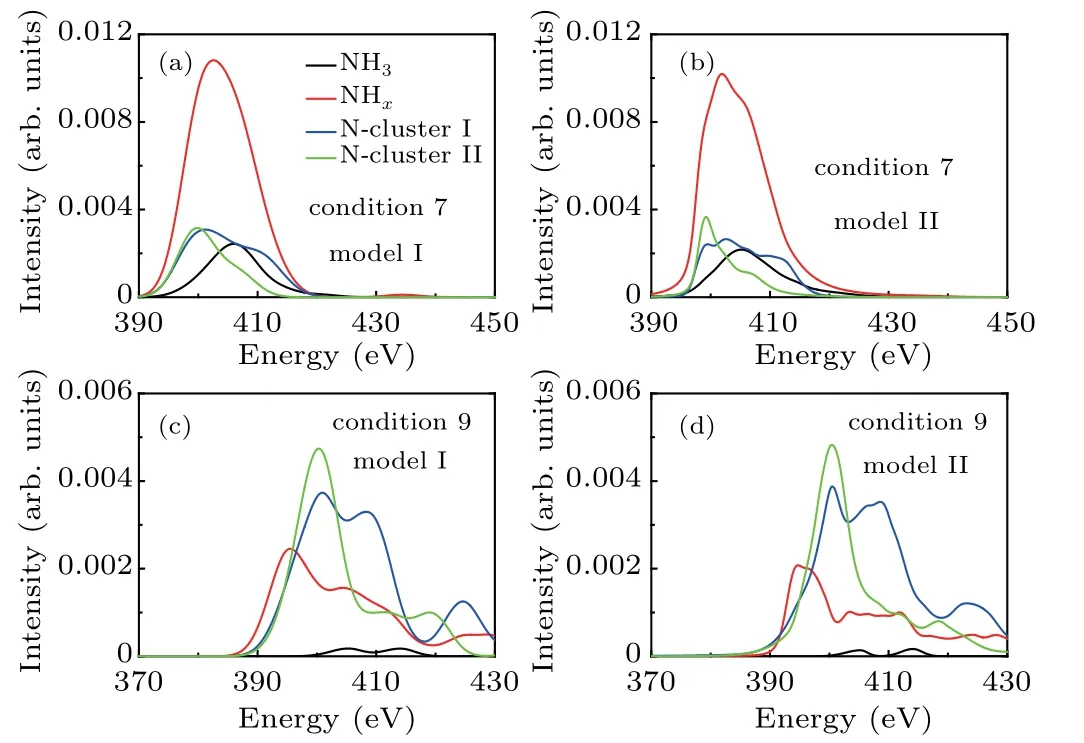
Fig. 6. The reconstructed XAS contributions from NH3 (black), NHx (red),N cluster-I(blue),and N cluster-II(green)based on modelling methods. (a)model I in condition 7;(b)model II in condition 7;(c)model I in condition 9;(d)model II in condition 9.
4. Conclusions
In summary, we have performed first-principles molecular dynamics and XAS simulations for warm dense ammonia along the Hugoniot curve. The calculated nitrogen Kshell XAS curves show a main peak at around 400 eV, and with increasing temperature and density,the peak has a lower intensity and it broadens. According to the changes in the XAS curves,the Hugoniot curve could be classified into three stages. The analysis of the atomic structures indicates that,along the Hugoniot curve,the NH3molecules could firstly dissociate to NHxfragments then form nitrogen clusters (type-I and type-II). At the highest temperature and density considered(condition 10),the preserved NH3molecules account for less than 3%of the total,and the amounts of type-I and type-II nitrogen clusters are 39% and 36% of the total, respectively.For the three stages of the Hugoniot curve,the dominant products (in descending order) are: NH3molecules, NHxfragments, and nitrogen clusters, respectively. The contributions of the three types of products to the total XAS are quite different, inducing the change of the XAS along the Hugoniot curve. By reconstructing the XAS curves by using Gaussian functions, the distribution of the peak position of the atomic XAS is found to be the dominant factor affecting and determining the shape of the total XAS curve.
猜你喜欢
Chinese Physics B(2023年2期)2023-03-13
Chinese Physics B(2022年4期)2022-04-12
雪豆月读·低年级(2021年12期)2021-12-23
金秋(2020年16期)2020-12-09
学校教育研究(2019年22期)2019-12-09
Chinese Physics B(2019年10期)2019-11-06
决策探索(2019年15期)2019-08-16
金秋(2019年2期)2019-04-16
微型小说选刊(2015年12期)2015-11-17

- Chinese Physics B的其它文章
- Corrosion behavior of high-level waste container materials Ti and Ti–Pd alloy under long-term gamma irradiation in Beishan groundwater*
- Degradation of β-Ga2O3 Schottky barrier diode under swift heavy ion irradiation*
- Influence of temperature and alloying elements on the threshold displacement energies in concentrated Ni–Fe–Cr alloys*
- Cathodic shift of onset potential on TiO2 nanorod arrays with significantly enhanced visible light photoactivity via nitrogen/cobalt co-implantation*
- Review on ionization and quenching mechanisms of Trichel pulse*
- Thermally induced band hybridization in bilayer-bilayer MoS2/WS2 heterostructure∗