
Empirical Equations of P-Wave Velocity in the Shallow and Semi-Deep Sea Sediments from the South China Sea
2021-06-25 11:13LIGuanbaoHOUZhengyuWANGJingqiangKANGuangmingandLIUBaohua
LI Guanbao, HOU Zhengyu, WANG Jingqiang, KAN Guangming, and LIU Baohua, 7)
Empirical Equations of P-Wave Velocity in the Shallow and Semi-Deep Sea Sediments from the South China Sea
LI Guanbao1), 6), HOU Zhengyu2), 3), 4), 5), *, WANG Jingqiang1), 6), KAN Guangming1), 6), and LIU Baohua1), 6), 7)
1),,,266061,2),,,,510301,3),,511458,4),,100190,5),511458,6),,266237,7),,266237,
Three-hundred and thirty-one sediment cores, including six sediment types (clayey- and sandy-silt, silty- and sandy-clay, clayey- and silty-sand) were collected from the shallow and semi-deep seas of the South China Sea, and the P-wave velocities and physical properties of core sediments were measured under standard laboratory conditions. To eliminate the influence of environmental factors, the empirical sound speed ratio equations were established. Compared with several equations from literature, the porosity and wet bulk density empirical equations established in this paper agree well with Richardson and Briggs (2004)’sequations, which implies that our empirical equations can be used in the similar region of world’s oceans under certain conditions and will be useful in areas lacking first-hand P-wave speed data. However, the mean grain size equations established in this study, similar to the previous studies, have low accuracy, which may be due to the different particle arrangements and degrees of compaction in sediments. The results also show that for different sediment types, the equation based on all sediment data is in good agreement with the measured data in the study area, as there are both siliciclastic and carbonate sediments on the studied seabed. It is suggested that appropriate empirical equations should be selected according to sediment types and sedimentary environment in future works, and the empirical equation of porosity or the two-parameter equation of porosity and grain size should be preferred.
seafloor sediment; geo-acoustic property; sound speed; empirical equation; South China Sea
1 Introduction
In the waveguide of the shallow and semi-deep sea (SSD),the seabed is a dominant factor controlling underwater acoustic propagation by bottom reflection and scattering losses (Zhou and Zhang, 2010). Sediment geo-acoustic pa- rameters, such as P-wave speeds, and their relationships with physical properties are important in many marine- geophysical applications (Liu., 2019), such as seismic exploration, seismic inversion and marine engineering. The geo-acoustic properties of SSD sediments are affected by many factors, such as sediment source, ocean current, water column and benthic organisms. Successful estimation of geo-acoustic properties in seabed sediments, such as the P-wave speed (hereafter called sound speed or SS), has been the goal of many studies involving inverse techniques (Zou and Kan, 2011; Suzuki., 2015; Mi- chalopoulou and Gerstoft, 2019). Core sediments are the primary samples for obtaining geo-acoustic parameters, which provide valuable insight into physical properties of the seabed (Konno., 2015; Ballard., 2019).
Both empirical and physical models have been used to predict the relationships between seafloor geo-acoustic parameters and physical properties; however, the former has significant advantages since some of parameters required by physical models are either very difficult or nearlyimpossible to be obtained (Jackson and Richardson, 2007). To acquire the accurate sound speed data, many researchers have established several empirical equations based on the sediment cores from different regions. In the last century, Hamilton and co-workers (Hamilton, 1970; Hamilton and Bachman, 1982; Bachman, 1989) studied the acoustic characteristics of marine sediment worldwide and established empirical relationships between sound speed and physical properties for various topographical regions (con- tinental terrace, abyssal hill, and abyssal plain). Consi- derable efforts have been made to develop empirical equations (Richardson., 2002; Goff., 2004; Endler., 2016) that can be used to predict the acoustic behavior of marine sediments. Few studies concerning the geo-acoustic and physical properties of sediments in the South China Sea (SCS) have been published. Basic characteristics and general distribution of sediments in the southeast offshore sea area off the Hainan Island were analyzed by Lu. (2008), and the regional empirical equations for sediments were established based on the data. Wang. (2018) used thesystem to measure seafloor sediment acoustic properties in SCS, and com- pared the results with several empirical equations, and found that the measured data were closed to the results calculated by the equation of Richardson and Briggs (2004). Hou. (2015, 2018a, 2018b) investigated the vertical and planar distribution of acoustic parameters of sediments in the southern and central areas of SCS and studied the effects of ocean currents and sediment source on the sound speed of sediments. Geo-acoustic parameters are influenced by multiple factors, and different seabed environments have different sediment acoustic properties. Due to the limited number of sediment samples and no standard measurement methods, the empirical equations for SCS given in many of these studies, which are based on variety of techniques (different measurement methods or frequencies), are limited in practical application. In this study, the same measurement method and frequency were used to measure the geo-acoustic parameters for more than 300 different types of core sediment samples collected in the SSD of the SCS at the same batch. Empirical equations between sediment geo-acoustic and physical parameters were established and compared with several equations from the literature.
2 Materials and Methods
Sediment cores were collected by a gravity corer in the SSD area in the north and west of SCS (water depth less than 1500m), among which the shortest sediment core was only 25cm long, and the longest core was 3m long. There was a plexiglass hard tube in the gravity corer and the two ends of sediment cores were sealed, which was conducive to the preservation of moisture and transport of cores. The sediment acoustic parameters were measured by the coaxial differential distance method under the standard laboratory conditions (23℃, salinity 35, and atmosphe- ric pressure). Details about the measurement method are described in Hou. (2018a, 2018b). The transmitting waveform was produced from a signal generator, and the waveform was received by the receiving transducer and recorded by a digital recorder at a sample rate of 10MHz. The long cores are cut into sections every 25cm and each section is acoustically measured. The transducer frequency was 100kHz, and the compressional sound speed was cal- culated by using the sediment length and the propagation time of the acoustic signals. The speed in pore-water was reported under the standard laboratory conditions favored by Hamilton (23℃, salinity 35, and atmospheric pressure). These conditions correspond to a water sound speed of 1529.4ms−1and a water density of 1024kgm−3, as calculated by the Del Grosso equation (1974). The sound speed ratio (SSR) is defined as the ratio of the measured sediment sound speed to the pore-water sound speed at same temperature, salinity, and pressure.
All sections were sub-sampled at their tops and ends, and additional samples were taken at depths with special interests. The porosity and water content were determined from the weight loss of sediments. Grain density was determined using a pycnometer. Sediment bulk density is calculated from the porosity and densities of pore water and sediment particles (Jackson and Richardson, 2007). The sediment particle size parameters were analyzed by the British Mastersizer 2000 laser diffraction particle size analyzer, and according to the percentage of each fraction in the sediment, the sediment type can be determined.
3 Results
The sediments collected in this study consisted of clay- ey-silt, sandy-silt, silty-clay, sandy-clay, clayey-sand and silty-sand (based on Shepard ternary diagrams, 1954). The geo-acoustic and physical parameters measured in this study included sound speed (SS), wet bulk density (ρ), meangrain size (Mz), and porosity (n). Three-hundred and thirty- one samples were examined in the study area, with 135 silty-clay, 131 clayey-silt, 37 silty-sand, 15 clayey-sand, 8 sandy-silt, and 5 sandy-clay. The statistical acoustic and physical parameters for different sediment types are listed in Table 1. The results show that the SS of sandy sediments (clayey-sand and silty-sand) was the highest, with the average larger than 1600ms−1, and the sandy sediments had higher wet bulk densities, particle sizes, and lower porosity. The lowest SS occurred in the clayey sediments (silty-clay and sandy-clay), with the average of about 1500ms−1, and the clayey sediments had lower wet bulk density, particle size, and higher porosity. The SS of silty sediment (sandy-silt and clayey-silt) was between clayey and sandy sediments. The results also show that the SS was closely related with physical properties, and the SS was proportional to the wet bulk density and particle size but was inversely proportional to porosity, which is consistent with previous studies (Hamilton, 1972; Hamilton and Bachman, 1982). Sound speed in sediments varies with seabed environment (temperature, pressure, and pore water salinity), and the laboratory environment is usually different from theenvironment. In order to eliminate the influence of the environment on the speed of sediments, Hamilton proposed the term ‘sound speed ratio (SSR)’, which was defined as the ratio of SS of sediments to the SS of water at the same temperature, salinity, and pressure (Jackson and Richardson, 2007). We used a least squares method to perform regression analysis on all data and established empirical equations for the SSR and some physical parameters (,and). The empirical equations are listed in Table 2.
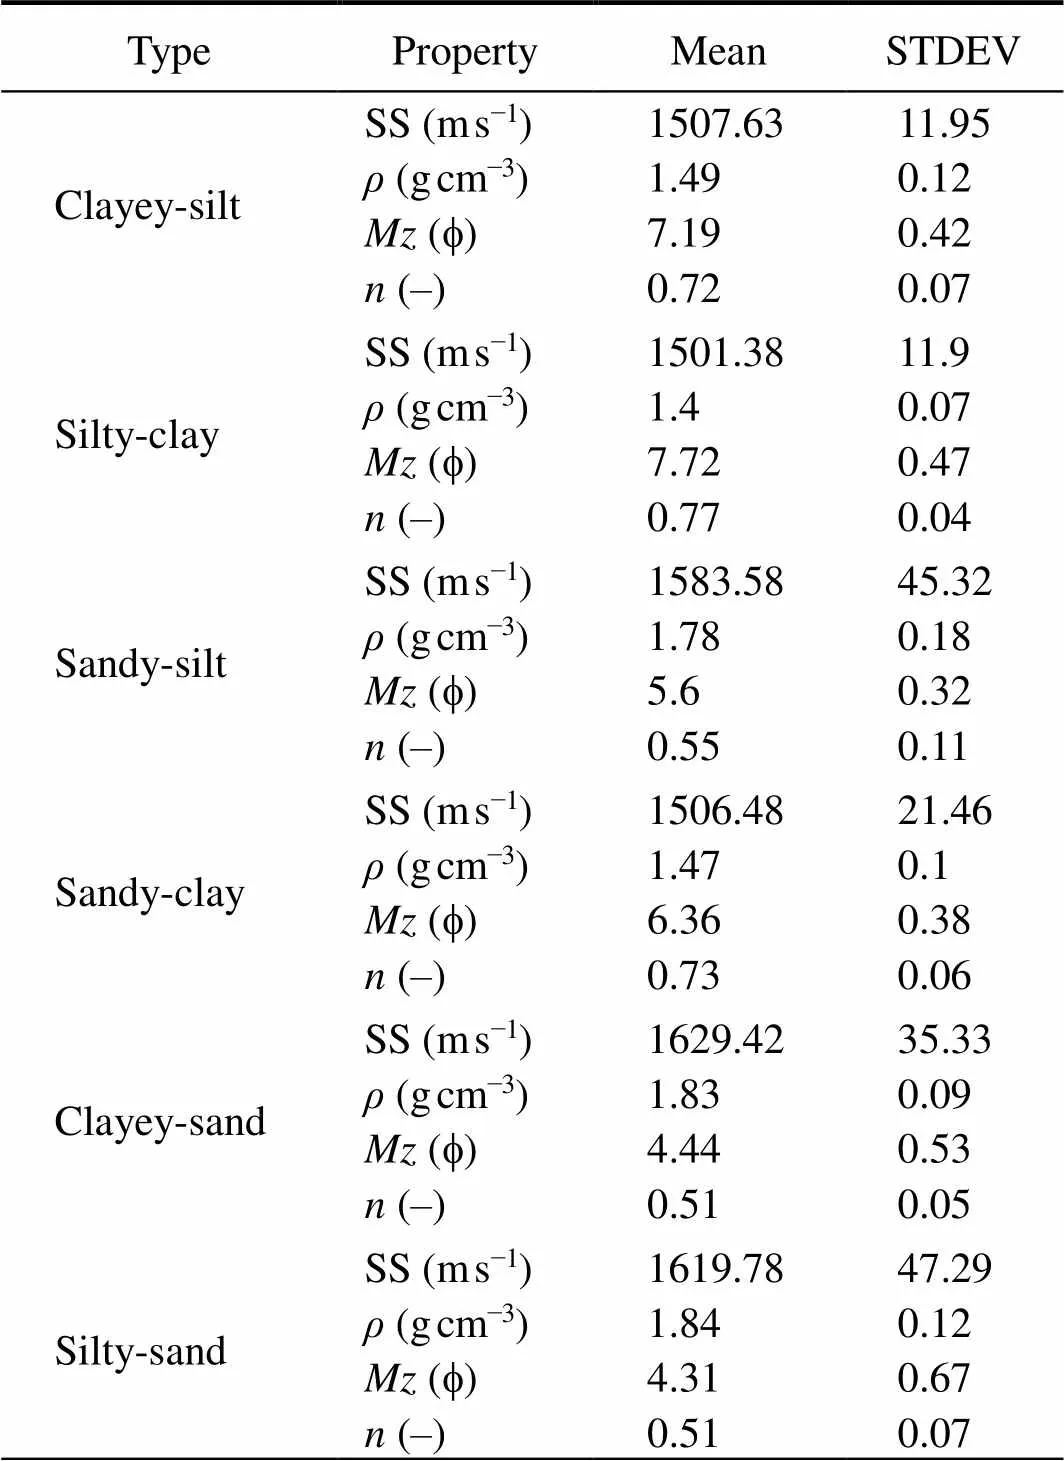
Table 1 The acoustic and physical parameters of six types of sediments
4 Discussion
As previous studied, SS exhibits strong inverse relation- ship with(Fig.1). Also shown in Fig.2, SSR decreased with the increase of. Whenwas approximately 75%, an inflection was encountered, and SSR began to increase with. The differences between this paper and other stu- dies (Bachman, 1989; Richardson and Briggs, 2004; Jack- son and Richardson, 2007) are plotted in Fig.2, and the equations used in this paper are listed in Table 2. The curve of this study fit well with the datameasured by using ISSAMS (Jackson and Richardson, 2007). The curve of Bachman (1989) is much higher than our curve, especially for high SS sediments. The curves of Richardson and Briggs (2004) are slightly higher than ours, while the one determined by all sediment equation was closer to the measured data. These results agree well with the work done by Wang. (2018) in the same sea area. The results obtained from the carbonate equation were only a bit less than those of all sediment equations when porosity wassmaller than 75%. However, when the porosity was greater than 75%, the prediction accuracy of carbonate equation was less than all sediment equations, which demonstrates that sediment type is an important factor influencing the SS.

Table 2 Regression equations used in this paper
Fig.3 illustrates the relationship between SSR andfor sediments from the SSD of SCS. It can be seen that the SSR has a positive relationship with. Whenwas larger than 1.40gcm−3, SSR began to increase with. As in the case of Fig.3, the curve of Bachman equation is higher than other studies, while the curve of this study is basically consistent with theone. After comparing Fig.2 with Fig.3, we can see that the trends ofandwere basically inverse becauseandhad a negative linear relationship (Fig.1). Just as the relationship ofand, thealso had a linear relationship with, which was more dispersed (Fig.1). The relationship between SSR andis display- ed in Fig.4. Generally, SSR increased with increasing. Kim. (2012) suggested that grain size affects sound speed through its influence on porosity, density, and other factors. The relationship between SSR andis sometimes important when grain size analyses can be made on dried sediments, on which density, porosity and sound speed measurements cannot be made (Hamilton and Bachman, 1982). In Fig.4, the curve of this study was not close to the curve of the Bachman equation or the curve of themeasurement (ISSAMS). Whenwas between 3 and 5.5f, the measured SS were relatively scattered. In this case, the Bachman equation had the highest predicted SS, and the equation established in this paper and ISSAMS equations give the results in the middle of the scattered points. When thewas between 5.5 and 9f, the measured SS was relatively concentrated. Our equation was con- sistent with the measured data; however, the predicted SS of other equations were higher than the measured data, and the siliciclastic equation has the highest predicted SS. Due to the uncertain relationship between the SSR and, the equation of the SSR based onof the sediment often has a low prediction accuracy for the data in SCS, especially whenis small. This may be due to the different particle arrangement and compaction degree in se- diments. The mean grain size (Mz) alone cannot express the characteristics of the particles (Wang., 2019). The different measuring methods of mean grain size used in these studies, which bring different errors, may be one of the reasons for not being able to use thealone.

Fig.1 Scatter plots of acoustic and physical parameters of different type sediments.

Fig.2 Sound speed ratio vs. porosity for sediments from the SSD of SCS. The empirical equation in this paper is: VSSR=1.587−1.591n+1.042n2, with n ranging from 0.43 to 0.82. The root mean square error (RMSE) for this equation is 0.0135, the sum of squared estimate of errors (SSE) is 0.05982 and R-square is 0.8232.

Fig.3 Sound speed ratio vs. wet bulk density for sediments from the SSD of SCS. The empirical equation of this paper is: VSSR=1.692−1.011ρ+0.3591ρ2, in which ρ ranges 1.30 to 1.97gcm−3. The RMSE for this equation is 0.0144, the SSE is 0.06798 and R-square is 0.7991.

Fig.4 Sound speed ratio vs. mean grain size for sediments from the SW of SCS. The empirical equation of this paper is: VSSR=1.307−0.07763Mz+0.004578Mz2, in which Mzranges 3.04 to 8.60f. The RMSE for this equation is 0.01377, the SSE is 0.06215 and R-square is 0.8163.
Richardson and Briggs (2004) collected nearly 800 cores from 67 shallow-water sites worldwide (12 carbonate and 55 siliciclastic sediment sites), and they obtained nearly 4500 data points resulting from measurements or calculations (3922 siliciclastic and 621 carbonate) to yield the SSR regression equations (Table 2). From Fig.2, we can see that the SSR curve calculated by the equation for sili- ciclastic sediments was nearly parallel to the curve of this paper, and the maximum difference was about 0.0216. In Fig.3, the equations for siliciclastic and all sediments almost coincided, and both had a maximum difference of about 0.0212. We found in Fig.4 that the equations for siliciclastic and all sediments had a large difference in our study area with the maximum up to 0.0405. However, the discrepancy between the equations for all sediments and those in this paper is smaller, and for the low SS sediments, their curves almost coincided. The results calculated by the regression equations between SSR and physical properties are similar for carbonate and siliciclastic sediments, and Richardson and Briggs (2004) suggest a universal applicability of the SSR regression equations for all sediments. The sediments in the shallow and semi-deep areasof the SCS are mostly siliciclastic sediments and often con- tain more than 30% CaCO3(Li., 2004). Therefore, all sediment equations fit better with the data for the SSD in SCS than the siliciclastic equation, especially for porosity. All sediment equations were based on data for both siliciclastic and carbonate sediments. They have a wide range of applications and are suitable for all sediment types.
Another probable reason for the differences among equations may be the differences in instrumentation and computation. Data from Bachman (1989) were measured at a frequency of 200kHz, whereas data from Richardson and Briggs (2004) were measured at a single high frequency (400kHz) and may not be compared with our lower frequency data (100kHz). According to dispersion characteristics, the sound speed decreases with decreasing fre- quency. It is reasonable that the values we measured could have been smaller than their measurement values. The data for theequations was measured by ISSAMS at frequency of 38 or 58kHz, and therefore have higher accuracy. Until now, no systematic analysis has been con- ducted to yield standardized sediment sound speed data. This process is out of the scope of this study, but a standard measurement procedure or anmeasuring me- thod should be developed for geo-acoustic databases.
Hamilton and Bachman (1982) believed that marine sediments consist of only a few common mineral species, and there are few variations in the physical properties of bottom water. So, for a given sediment type (in a given environment), the bulk elastic properties should be almost the same worldwide. The common geo-acoustic relationship could be used to estimate the sound speed for unknown regions with similar porosity. We also confirmed that for given the same sediment types, the porosity-SSR equation can be used to estimate SSR for different regions. However, when the SSR of sediments was relatively low (SSR<1), there was an apparent envelope for sediments within the range from 1.30 to 1.76gcm−3,of 0.57 to 0.82, andof 5.78 to 8.60f(Phi), indicating that the SSR was relatively insensitive to changes of sediment phy- sical parameters. When the SSR of sediments was relatively high (SSR>1), there is an apparent envelope for se- diments within the range from 1.68 to 1.97gcm−3,of 0.43 to 0.58, andof 3.04 to 5.93f, which indicates that the SSR was relatively sensitive to changes of sediment physical parameters. The sound speed can be affected by multiple physical parameters although porosity is the primary one, given that the porosity may not produce an accurate speed. With the same porosity, the sediments may still have different grain sizes, resulting in different sound speeds. For example, in Fig.5, when the porosity was about 0.55 to 0.58, the different mean grain sizes (or different sediment types) account for the different sound speeds of sediments.

Fig.5 Sound speed ratio vs. mean grain size and porosity. The red cross is for samples with Mz ranging from 3 to 5f, the yellow diamond is for Mz ranging from 5 to 7f, and the blue hollow circle is for Mz ranging from 7 to 9f.
In order to yield a creditable equation that takes into account both porosity and sediment types, we recommend adding a parameter, mean grain size, in the above formula because the grain size can not only represent the sediment type, but also is invariant for measurements both in the seabed and in the laboratory. The two-parameter equation (SSR--equation) in our study was that:

in whichranged from 0.43 to 0.82, andranged from 3.04 to 8.60f. The RMSE for this equation was 0.01024, the SSE was 0.03529 and-square was 0.8957. This equa- tion has a higher-square and a smaller RMSE than the single parameter equations (SSR-, SSR-equation). How- ever, it can generate an accurate estimate of speed for dif- ferent regions and sediment types when porosity and mean grain size data are available.
5 Conclusions
Seafloor sediments from the SSD of SCS were collected to study the relationship between geo-acoustic parameters and physical properties. The results show that the empirical equations established in this paper accord well with theequations. This study confirms the sound speed is more correlated with wet density and porosity than with mean grain size. The discrepancy among different equations may be caused by the different carbo- nate contents, the various measured frequency for sound speeds, and different measurement methods for physical properties.
Due to the limitations of samples, the empirical equations given in this study are more suitable for the fine sediments in shallow and semi-deep sea. This study suggests that moredata should be measured, and it is necessary to strengthen the comparative study between sampling measurements andmeasurements since the sound speed of sediments is affected by many factors, such as sediment source, ocean current, and sediment types. In the next stage, we will compare and study the geo- acoustic properties of seafloor sediments in other sea areas of China, such as the South China, Yellow, and East China Seas. The applicability of empirical equations established in different areas, and the influence mechanism of sedimentary environment on geo-acoustic properties will be investigated.
Acknowledgements
This study was funded by the State Key Laboratory of Acoustics, Chinese Academy of Sciences (No. SKLA202 007), the National Natural Science Foundation of China (Nos. 41706045, 42076082, 41706062), the Director Fund of Qingdao National Laboratory for Marine Science and Technology (No. QNLM201713), the Guangdong Natural Science Foundation (No. 2017A030313237), the Taishan Scholar Project Funding (No. tspd20161007), the Strategic Priority Research Program of the Chinese Academy of Sciences (No. XDA13010102), and the Key Special Project for Introduced Talents Team of Southern Marine Science and Engineering Guangdong Laboratory (Guangzhou) (No. GML2019ZD0104).
Bachman, R. T., 1989. Estimating velocity ratio in marine sediment.,89: 2029-2032.
Ballard, M. S., Lee, K. M., McNeese, A. R., Wilson, P. S., Chay- tor, J. D., Goff, J. A., and Reed, A. H., 2019.measurements of compressional wave speed during gravity coring operations in the New England mud patch., 45 (1): 26-38.
Del Grosso, V. A., 1974. New equation for the speed of sound in natural waters (with comparisons to other equations)., 56 (4): 1084-1091.
Endler, M., Endler, R., Wunderlich, J., Bobertz, B., Leipe, T., Moros, M., Jensen, J., and Arz, H., 2016. Geo-acoustic mo- delling of late and postglacial sedimentary units in the Baltic Sea and their acoustic visibility., 376: 86- 101.
Goff, J. A., Kraft, B. J., Mayer, L. A., Schock, S. G., Sommerfield, C. K., Olson, H. C., and Nordfjord, S., 2004. Seabed cha- racterization on the New Jersey middle and outer shelf: Correlatability and spatial variability of seafloor sediment pro- perties., 209 (1-4): 147-172.
Hamilton, E. L., 1970. Sound velocity and related properties of marine sediments, North Pacific., 75 (23): 4423-4446.
Hamilton, E. L., 1972. Compressional-wave attenuation in marine sediments., 37 (4): 620.
Hamilton, E. L., and Bachman, R. T., 1982. Sound velocity and related properties of marine sediments., 72 (6): 1891-1904.
Hou, Z., Chen, Z., Wang, J., Zheng, X., Yan, W., Tian, Y., and Luo, Y., 2018a. Acoustic characteristics of seafloor sediments in the abyssal areas of the South China Sea., 156: 93-100.
Hou, Z., Chen, Z., Wang, J., Zheng, X., Yan, W., Tian, Y., and Luo, Y., 2018b. Acoustic impedance properties of seafloor se- diments off the coast of southeastern Hainan, South China Sea., 154: 1-7.
Hou, Z., Guo, C., Wang, J., Chen, W., Fu, Y., and Li, T., 2015. Seafloor sediment study from South China Sea: Acoustic & physical property relationship., 7 (9): 11570- 11585.
Jackson, D. R., and Richardson, M. D., 2007.. Springer Science & Business Media, New York, 1-605.
Kim, D. C., Kim, G. Y., Yi, H. I., Seo, Y. K., Lee, G. S., Jung, J. H., and Kim, J. C., 2012. Geoacoustic provinces of the South Sea shelf off Korea., 263: 139-147.
Konno, Y., Jin, Y., Yoneda, J., Kida, M., Egawa, K., Ito, T., and Nagao, J., 2015. Effect of methane hydrate morphology on compressional wave velocity of sandy sediments: Analysis of pressure cores obtained in the eastern Nankai Trough., 66: 425-433.
Li, X., Chen, F., Liu, J., and Huang, X., 2004. Distribution and its dissolution of carbonate in seafloor surface sediment in the western South China Sea., 33 (3): 35-41 (in Chinese with English abstract).
Liu, J., He, Z. L., Liu, X. W., Huo, Z. Z., and Guo, P., 2019. Usingfrequency-dependent AVO inversion to predict the ‘sweet spots’ of shale gas reservoirs., 102: 283-291.
Lu, B., Li, G., Liu, Q., Huang, S., and Zhang, F., 2008. Sea floor sediment and its acouso-physical properties in the southeast open sea area of Hainan Island in China., 26 (3): 129-144.
Michalopoulou, Z. H., and Gerstoft, P., 2019. Multipath broadband localization, bathymetry, and sediment inversion., 45 (2): 92-102.
Richardson, M. D., and Briggs, K. B., 2004. Empirical predictions of seafloor properties based on remotely measured se- diment impedance. In:. Porter, M. B., and Siderius, M., eds., AIP, Melville, NY, 12-21.
Richardson, M. D., Briggs, K. B., Bentley, S. J., Walter, D. J., and Orsi, T. H., 2002. The effects of biological and hydrodynamic processes on physical and acoustic properties of sediments off the Eel River, California., 182 (1): 121-139.
Shepard, F. P., 1954. Nomenclature based on sand-silt-clay ratios., 24: 151-158.
Suzuki, K., Schultheiss, P., Nakatsuka, Y., Ito, T., Egawa, K., and Holland, M., 2015. Physical properties and sedimento- logical features of hydrate-bearing samples recovered from the first gas hydrate production test site on Daini-Atsumi Knoll around eastern Nankai Trough., 66: 346-357.
Wang, J., Hou, Z., Li, G., Kan, G., and Liu, B., 2019. A new compressional wave speed inversion method based on granularity parameters., 7: 185849-185856
Wang, J., Li, G., Liu, B., Kan, G., Sun, Z., Meng, X., and Hua, Q., 2018. Experimental study of the ballastsediment acoustic measurement system in South China Sea., 36 (5): 515-521.
Zhou, J. X., and Zhang, X. Z., 2010. Physical parameters for four seabed geoacoustic models from low-frequency measure- ments., 1272 (1): 163-172.
Zou, D., and Kan, G., 2011. Application study onacoustic measurement system of seafloor sediments., 9 (4): 1507-1510.
February 7, 2020;
May 6, 2020;
July 24, 2020
© Ocean University of China, Science Press and Springer-Verlag GmbH Germany 2021
. E-mail: zyhou@scsio.ac.cn
(Edited by Chen Wenwen)
 Journal of Ocean University of China2021年3期
- Journal of Ocean University of China的其它文章
- Case Study of a Short-Term Wave Energy Forecasting Scheme:North Indian Ocean
- Temporal and Spatial Characteristics of Wave Energy Resources in Sri Lankan Waters over the Past 30 Years
- Vibration Deformation Monitoring of Offshore Wind Turbines Based on GBIR
- Dependence of Estimating Whitecap Coverage on Currents and Swells
- The Variation of Microbial (Methanotroph) Communities in Marine Sediments Due to Aerobic Oxidation of Hydrocarbons
- 3-Aminopropyltriethoxysilane Complexation with Iron Ion Modified Anode in Marine Sediment Microbial Fuel Cells with Enhanced Electrochemical Performance