
Influence of Environmental Conditions on the Sound Velocity Ratio of Seafloor Surficial Sediment
2021-06-25 11:17ZOUDapengZENGZiwenKANGuangmingLIUWeiandXIAOTibing
ZOU Dapeng, ZENG Ziwen, KAN Guangming, LIU Wei, and XIAO Tibing
Influence of Environmental Conditions on the Sound Velocity Ratio of Seafloor Surficial Sediment
ZOU Dapeng1), *, ZENG Ziwen1), KAN Guangming2), *, LIU Wei1), and XIAO Tibing1)
1),,510006,2),,,266061,
In this work, we investigated the influences of salinity, temperature, and hydrostatic pressure on the acoustics of seafloor surficial sediment by theoretically and experimentally analyzing the sound velocity ratio of the seafloor sediment to the bottom seawater in typical environmental conditions. Temperature- and pressure-controlled experiments were conducted to examine the characteristics of the sound velocity ratio, the results of which agree with the theoretical analysis using the effective density fluid model. Of the three environmental factors considered, the sound velocity ratio was found to be sensitive to temperature and pressure but not to salinity, with the sound velocity ratio decreasing with temperature and hydrostatic pressure. With respect to surficial sediments, pore water plays a key role in the sound velocity ratio of sediment influenced by different environmental factors. The sound velocities of different types of sediments (sandy, silty, and clayey) change similarly with temperature, but change slightly differently with hydrostatic pressure. The influence of environmental factors on the sound velocity ratio of seafloor sediment is independent of the detection frequency. The results show that the sound velocity ratio can change up to 0.0008 per ℃ when the temperature ranges from 2℃ to 25℃ and up to 0.00064MPa−1when the seawater depth pressure ranges from 0MPa to 40MPa.
sound velocity ratio; environmental factors; seafloor; sediment; geoacoustics
1 Introduction
Three main acoustic techniques are currently used to measure, invert, and forecast the acoustic properties of seafloor sediments under different environmental conditions. Geoacoustic inversion measurementmethods (Li and Li, 2010;De and Chakraborty, 2011; Buckingham., 2012; Williams., 2015; Chapman, 2016) detect underwater and geoacoustic properties by the sound gradients of the seawater and sediment, which are affected by the spatial distributions of temperature and pressure in the propagation path.acoustic measurementmethods(Richardson and Briggs, 1996; Buckinghamand Richardson, 2002; Tao., 2009; Kan., 2013; Ballard.,2016) directly measure theacoustic properties of sediment inenvironmental conditions. In contrast, samplingacoustic measurementmethods (Hamilton, 1971; Hoffman and Tobin, 2002; Richardson and Briggs, 2004; Lu., 2007; Meng., 2015; Wang., 2016) are applied to sediment core samples under laboratorial pressure and temperature conditions, which are quite different from those in theenvironment. Thus, environmental factor have the primary impact on the acoustical, physical, and mechanical properties of seawater and sediment by geo- acoustic inversion measurement at different water surficial levels,acoustic measurements at different seafloor depths,and sampling acoustic measurements in different laboratory environments. The empirical equations of Hamilton (Hamilton, 1970,1971; Hamiltonand Bach- man, 1982) are widely used and referenced by researchers in different marine regions using different measurement methods (Gorgas., 2002; Buckingham, 2005; Lu., 2006; Jackson and Richardson, 2007; Endler., 2015; Wang., 2016; Kan., 2019). Less consi- deration is given to the environmental influences on acoustic characteristics.
A solution to the abovementioned problems, which was proposed by Hamilton (1971), was to assume that the sound velocity ratio between the seafloor sediment and bottom seawater was constant. With the sound velocity ratio held constant, the sound speeds of sediments measured using different methods have been calculated and applied to correct or eliminate the influence of different temperatures and pressures (Hamilton and Bachman, 1982; Bachman, 1989; Wang., 2016). However, recent experimental results (Kim., 2018; Kan., 2019; Zou., 2019) have reported the influence of temperature and hydraulic pressure on both the sound speed of seafloor sediment and the sound velocity ratio, and that the sound velocity ratio can vary in different environmental conditions. However, the above research mostly focused on experimental analysis. Factors such as salinity, acoustic detection frequency, and sediment type must also be considered together. With the help of generally accepted theoretical models, further analysis and interpretation of experimental results is needed, along with exploration of the influence mechanisms of environmental factors.
In this study, we examine the influence of environmentalconditions, including temperature, pressure, and salinity, on the sound velocity ratio of different types of seafloor sur- ficial sediments (., less than 3m beneath the surface of the ocean bottom), analyze the relationship between the sound velocity ratio and the influence of environmental conditions using the effective density fluid model (EDFM), and describe the measurement results obtained in temperature- and pressure-controlled laboratory acoustic experiments to verify conclusions obtained by theoretical analysis.
2 Theoretical Analysis of the Environmen- tal Influence on the Sound Velocity Ratio in Surficial Sediment
2.1 EDFM Considering the Influence of Environmental Factors
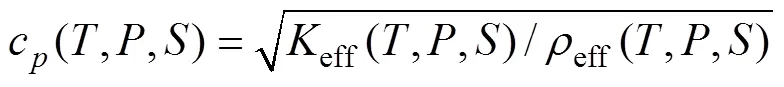
Widely employed theories,such as fluid, elastic, and poroelastic theories, focus on analysis of the influences of physical parameters of the seafloor sediment and acoustic frequency on the acoustic properties of sediment (Jackson and Richardson, 2007). These theories can also be used to analyze the influences of environmental factors. The EDFM(Williams, 2001)simplifies the parameters of the Biot– Stoll model for two-phase media at low frequencies and uses the effective bulk moduluseffand effective densityeffto model a general expression for the properties of sound speed in sediment. The EDFM can explain the relationship between the compressional wave velocity and the detection frequency. With consideration ofthe effectsof temperature, pressure, and salinity on the physical parameters, the sound speedcin the EDFM can be expressed as follows:
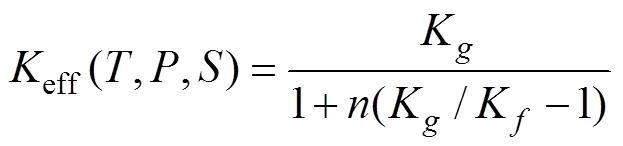
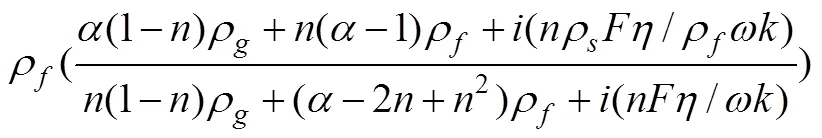
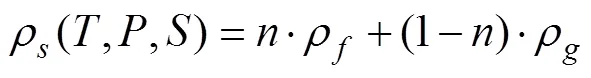
where,, andare the temperature, pressure, and salinity, respectively. Kand Kare the bulk modulus of solid grains and the bulk modulus of pore water, respectively, andis the porosity of the sediment.,,are the bulk densities of the pore water, solid grains, and sediment, respectively.is the viscosity of the pore water andis its permeability.is a dynamic viscosity correction factor,is the detected angular frequency, andis the tortuosity. Generally speaking, the above parameters all vary with changes in temperature and pressure, albeit with different scales.
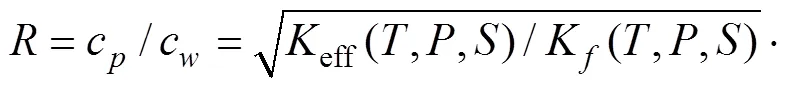
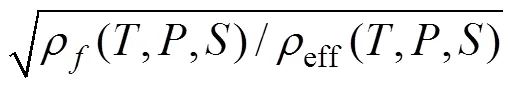
With consideration of the environmental influence on the bottom seawater (equal to the pore water in the sediment), the sound velocity ratioof the surficial sediment to the bottom seawater can be written as:
where theK(,,) and(,,) can be calculated us- ing the seawater state equation (Jackson and Richardson, 2007).
Eqs. (1) and (5) can be used to study both the sound speedcin sediment and the sound velocity ratioof the surficial sediment to the bottom seawater in different environmental conditions. These applications may lead to the discovery of the mechanism underlying the influence of temperature and pressure on the acoustic properties of se- diment.
According to Eq. (1), even if the texture and grain com-position of sediment do not change, the sound speed in the sediment will change due to the influence of different salinities, temperatures, and pressures on the sediment’s physical parameters. This mechanism can be described as the influence of salinity, temperature, and pressure on the effective elastic modulus and effective density of the se- diment. For surficial sediment, analysis based on a general model of the sound velocity ratio indicates that the series texture is dominant in two-phase structures of unconsolidated sediments (Zou, 2018). In other words, most solid particles are suspended in pore water or separated by a liquid film, with the solid and liquid phases subject to equal stress. Therefore, filling with seawater weakens the effect of the shear modulus of the solid grains. Thus, to study compressional waves with the EDFM, we use the Wood equation, as shown in Eq. (2), to express the effective bulk modulus. Changes in the environmental factors will result in variations in both the seawater and sediment, and thus the sound velocity ratio according to Eq. (5).
The equivalent bulk modulus and equivalent density of solid grains are expected to be influenced much less by environmental factors compared to their effect on those of pore water. Therefore, variations in the acoustic properties of surficial sediment can mainly be attributed to changes in the acoustic properties of pore water. This assumption has been verified and elucidated by experimental and theoretical analyses of the influence of temperature on sediment(Shumway, 1958; Rajan and Frisk, 1992; Eastwood, 1993; Zou., 2015).That is, changes in the bulk modulus and density of pore water with changing environmental factors determine the variations in the effectivebulk modulus and effective density of the sediment. This determination, in turn, affects the trend and extent of the acoustic variation.
2.2 Analysis of the Environmental Influence on the Sound Velocity Ratio of Surficial Sediment Based on EDFM
Typical sandy sediment was selected for this study, the representative physical parameters of which are listed in Table 1. The changes in the bulk modulus, bulk density, and viscosity of seawater can be calculated using the sea- water state equationwith temperature, pressure, and salinity (Jackson and Richardson, 2007).
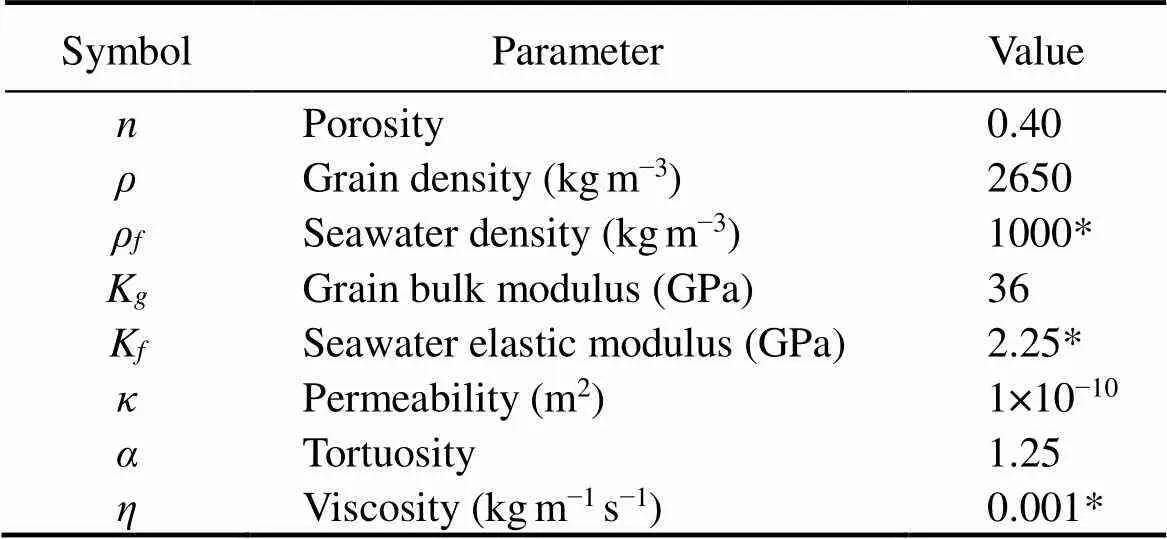
Table 1 Representative physical parameters of sandy seafloor sediment (Williams, 2001)
Notes: Values with the ‘*’ symbol change with variations in temperature and pressure, and are calculated using the seawater state equation.
Changes in the sound velocity ratio were calculated by the EDFM using Eqs. (1) to (5) at 200Hz, 40kHz, and 1MHz in different environmental conditions. These three typical frequencies were chosen for comparison to represent different acoustic measurement methods. The calculations were performed using Matlab software and the results are shown in Fig.1 and Table 2. Although different detection frequencies show a notable influence on the sound velocity ratio, the changes in the sound velocity ratio were found to be similar to the changes in the environmental factors. Table 2 presents the mean value of each factor’s influence on the sound velocity ratio. The difference between the maximum and minimum values (Vdmax−min) and its division by the mean value (Vd/mean), which is referred to as the relative rate, are used to observe the change in the sound velocity ratio and the change rate. An absolute change rate (abs) is obtained to represent the change in the sound velocity ratio with respect to the range of a given factor. This parameter provides a reference value for changes in the sound velocity ratio for different environmental factors. In Fig.1 and Table 2, it is evident that the influence of salinity is obviously less than that of the other two factors. Considering the fact that the variation range in the salinity of seawater is small and the absolute and relative change rates are also small, the influence of salinity is ignored in the following analysis.

Fig.1 Theoretical relationship between the sound velocity ratio of sandy sediment and environmental influence factors: (a) different temperature at a pressure of 1atm and salinity of 34.5, (b) different seafloor depths at a temperature of 23℃ and salinity of 34.5, and (c) different salinities at a pressure of 1atm and a temperature of 23℃.
Fig.2 shows a three-dimensional profile of the changes in the sound velocity ratio with temperature and hydrostatic pressure, which indicates the acoustic attributes of seafloor surficial sediment for mostand laboratorial environmental conditions. The theoretical calculations show that the sound velocity ratio decreases with increases in both temperature and hydrostatic pressure. With variations in the temperature and hydrostatic pressure, the sound velocity ratio does not remain constant. As salinity has only a slight impact on the velocity ratio, its effect is omitted. The theoretical analysis indicates that the sound velocity ratio of surficial sandy sediment changes by up to 0.0006 per ℃when the temperature ranges from 1℃ to 30℃, and by up to 0.00054MPa−1when the hydrostatic pressure ranges from 0 to 40MPa, which is equal to that of the sea bottom at 4km depth, in bothand laboratory distributions.
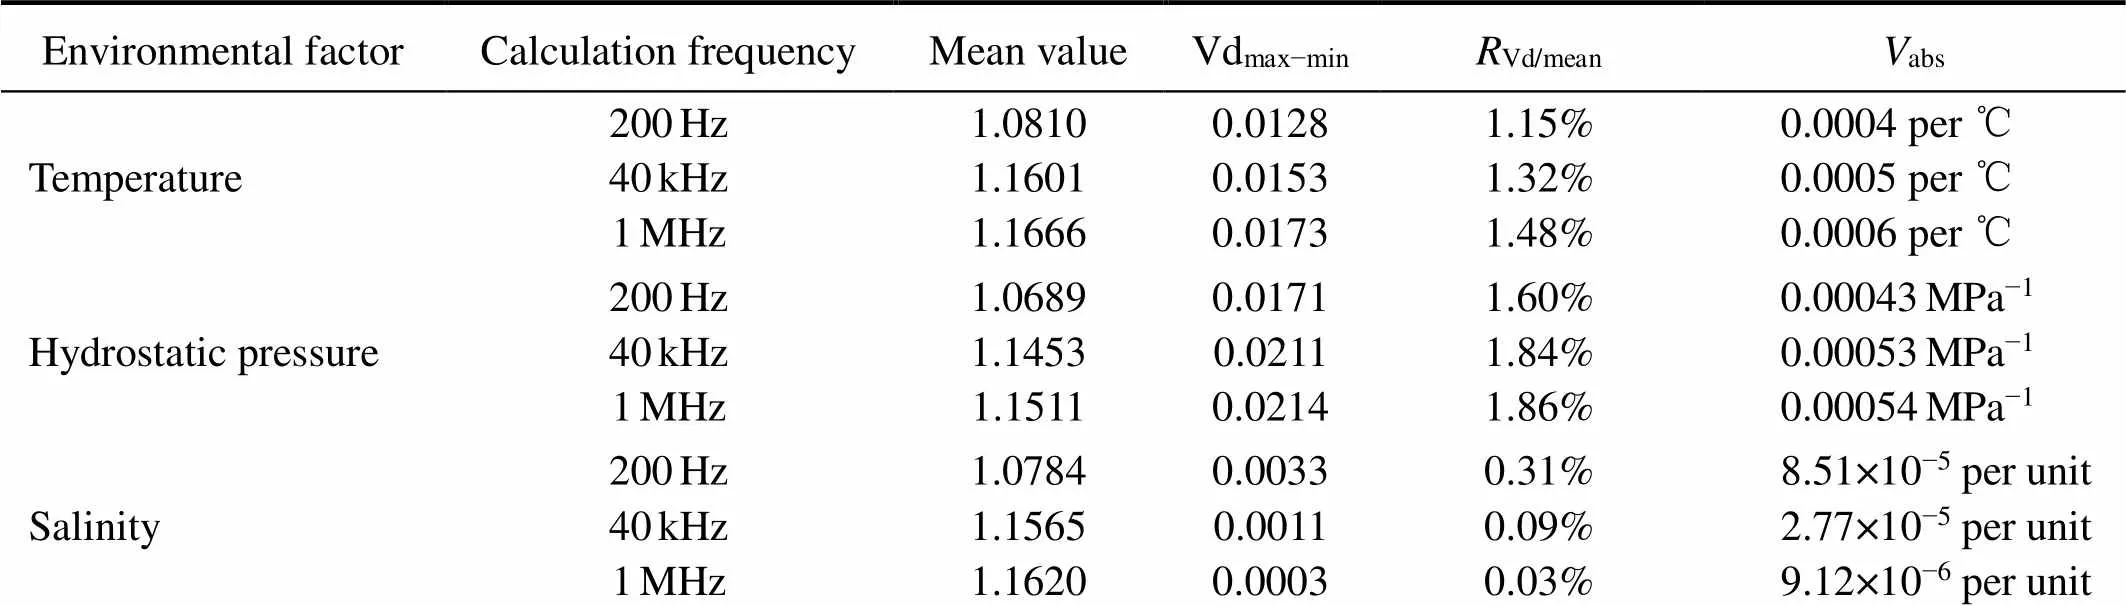
Table 2 Variations in the sound velocity ratio due to the influence of environmental factors as determined by EDFM analysis

3 Experimental Relationships Betweenthe Sound Velocity Ratio and the Temperature and Hydrostatic Pressure
Due to the minor effect of salinity, as determined by theoretical analysis, experiments were conducted to deter- mine only the influences of temperature and hydrostatic pressure. Changes in the sound velocity ratio of the seafloor sediment were systematically investigated in experi- ments with respect to the actual sediment distribution in any possible environmental state.
Table 3 and Fig.3 show the representative relationships between the physical properties and the depth of seawater in the Yellow Sea and the South China Sea, respectively. Theseawater temperatureand sound-speed profile were measured using SBE-9CTD probes.The Yellow Sea is shallow, with an average depth of about 40m, which means its temperature changes significantly and has a strong influence on the sound speed of the seawater. As a result, the sound speed of the seafloor sedimentis apt to be affected by seasonal variations in temperature. The South China Sea is much deeper, with an average depth of about 1200m, and its temperature decreases with increasing water depth as the hydrostatic pressure increases. Initially, the seawater temperature decreases rapidly and then slows,whereas the pressure continues to increase linearly. There-fore, the sound speed of seawater first decreases with decreasing temperature,and then increases at depths exceeding approximately 1000m due to the effect of the con- tinuous increase in hydrostatic pressure (Fig.3).
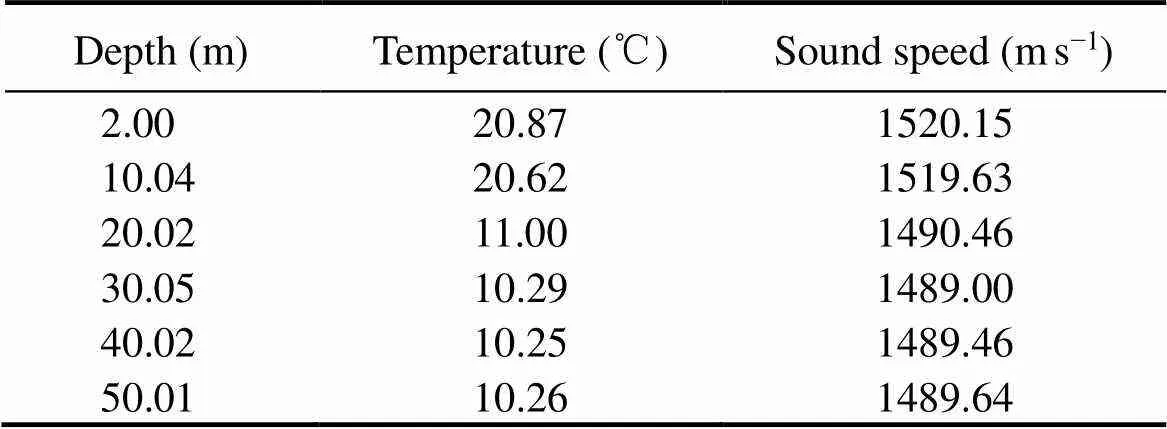
Table 3 Seawater properties in the Yellow Sea in June
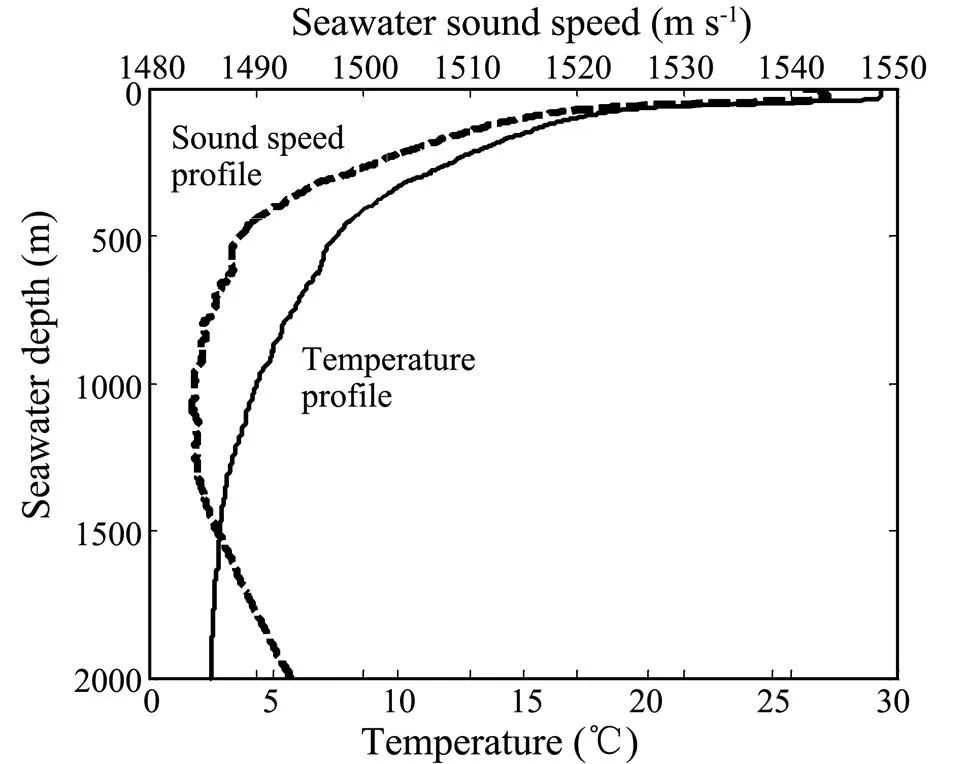
Fig.3 Typical temperature and sound-speed profiles of the northern South China Sea in September (provided by 2011 South China Sea Open Cruise by R/V Shiyan 3, South China Sea Institute of Oceanology, CAS).
3.1 Sample Attributes and Experimental Processes
The sediments were sampled using the gravity sampling method at different sites and times from the Yellow Sea (YS) and South China Sea (SCS). These samples were stored in a PVC tube to protect their structures and maintain their seawater contents. Most of the samples utilized in these experiments were surficial sections approximately 300mm in length. Table 4 lists the properties of the representative samples.
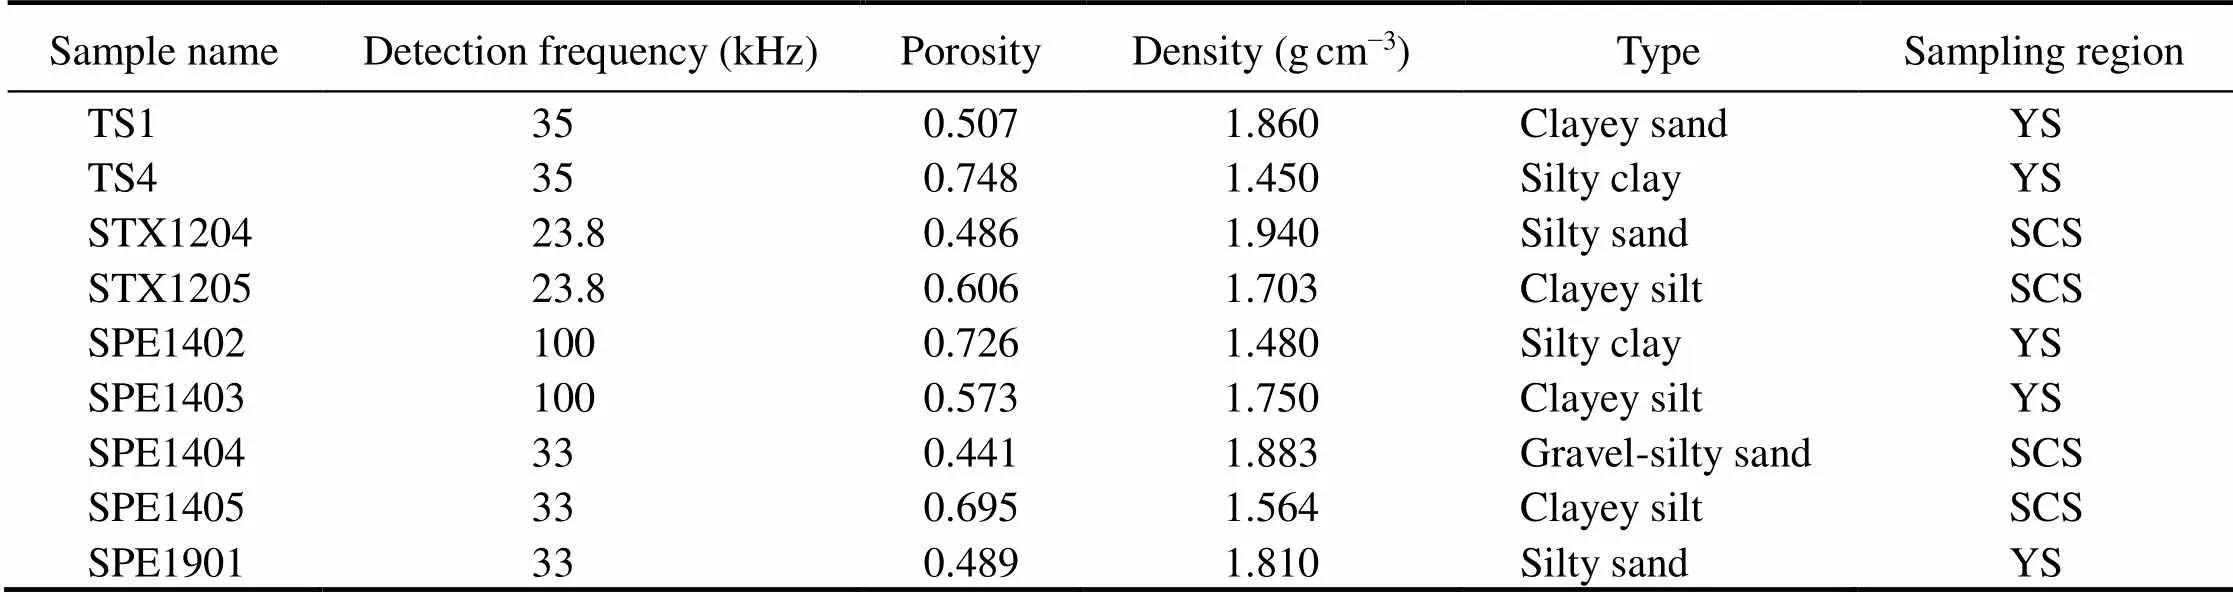
Table 4 Properties of the representative samples measured in the experiments
Using laboratory equipment, experiments were conducted to examine the change in the sound speed while controlling for temperature and pressure, respectively. In the experiments, the environmental conditions were recreated to reflect the most likely state of the seafloor surficial sediment. The experimental system mainly consisted of a measurement bench, a digital sonic meter (WSD-3 or DB4), and a pair of planar transducers. The experimental principles and equipment are described in greater detail in Kan. (2019). In the temperature-controlled experiments, the equipment was filled with air at 1atm, and the temperature of the sediment sample was controlled at in- crements of 1℃. In the pressure-controlled experiments, the pressure chamber was filled with seawater, and the hydrostatic pressure of the sediment sample was controlled at increments of 2MPa. The temperature during the pressure measurement process was 25.6℃±0.5℃. At each controlled temperature or pressure, the sound speed of the sediment was measured using an acoustic pulse detection technique and the time-of-flight method. To compare theand laboratory acoustic detection approaches used in different methods and by different researchers, several representative detection frequencies, as shown in Table 4, were chosen in the ultrasonic range. The degree of uncertainty of the sample length measurement was approximately 0.5mm. The total uncertainty of the sound velocity measurements was approximately±1.8ms−1.
3.2 Experimental Results of the Temperature-Dependent Sound Velocity Ratio
For comparison, a sandy sample measured at 1MHz was provided (Carbó and Molero, 2000), which consisted of fine sand with a porosity of 42% and a density of 1.97gcm−3. Its sound velocity ratio was found to decrease with increases in temperature. The sound velocity ratios of samples TS1, TS2, STX1204, and STX1205 in Fig.4 show a similar decreasing trend even with different sediment types, different acoustic detection frequencies, and sediments from different sea areas. The uneven variation in the sound velocity ratio indicates the anisotropy and non-unifor- mity of the sediment. Table 5 lists the relative and absolute change rates of the sound velocity ratio with tempe- rature.
The theoretical EDFM calculation can explain the decreasing trend of the sound velocity ratio (Fig.4), verifying that the temperature mainly affects the acoustic properties of the seafloor sedimentchanges in the elastic modulus, density, and viscosity of the pore water. The de- creasing trend and fluctuation of the sound velocity ratio in this experiment imply that the sound velocity ratio should not be regarded as a constant when the temperature changes.
3.3 Experimental Results of the Hydrostatic-Pre- ssure-Dependent Sound Velocity Ratio
As shown in Fig.5, the sound velocity ratios of sandy samples SPE1404 and SPE1901 decreased with the hydrostatic pressure, and those of samples SPE1402, SPE- 1403, and SPE1405 also showed a decreasing trend. Table 5 lists the relative and absolute change rates of the sound velocity ratio with hydrostatic pressure. The decreasing trend and fluctuation in the sound velocity ratio with hydrostatic pressure in this experiment imply that the sound velocity ratio must not be regarded as a constant.

Fig.4 Dependence of the sound velocity ratio in different sediments on temperature: STX1204 (), STX1205 (), TS1 (), TS4 (), and Carbó’s sand sample () (Carbó and Molero, 2000) denote the experimental results, and the solid lines represent the calculated EDFM results.
The theoretical EDFM calculation can explain the decreasing trend of the sound velocity ratio. The hydrostatic pressure was found to mainly affect the acoustic properties of the seafloor sedimentchanges in the elastic modu- lus, density, and viscosity of the pore seawater. This well explains the influence of hydrostatic pressure on the sound velocity of sandy sediment, with slight deviations for silty and clayed sediments, as shown in Fig.5.
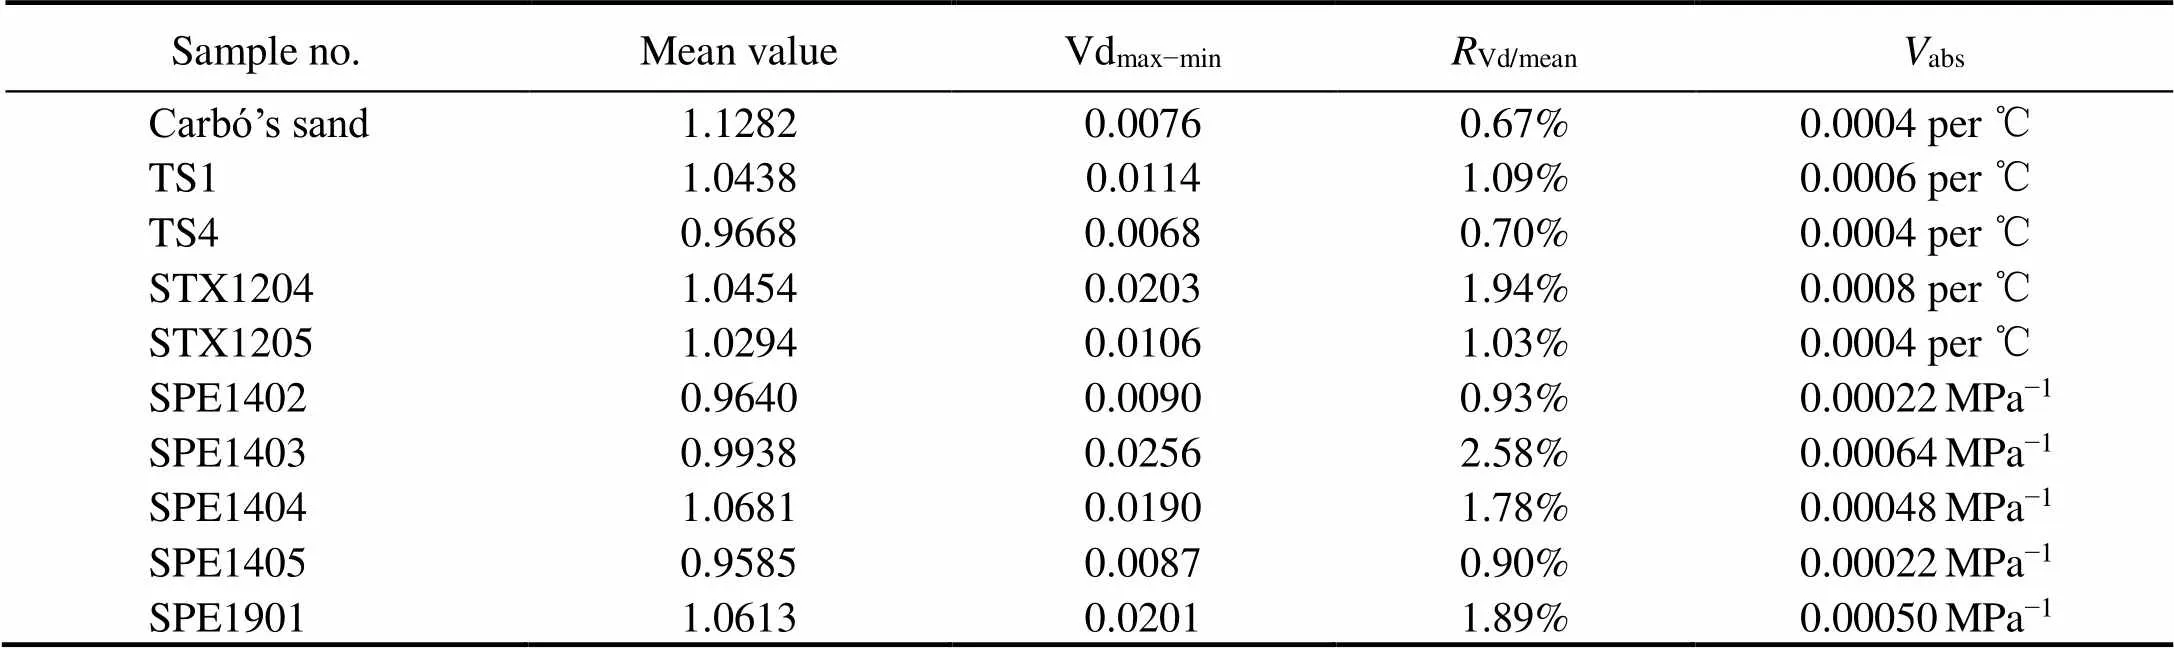
Table 5 Variations in the sound velocity ratio with temperature and hydrostatic pressure, as determined by analysis of the experimental results
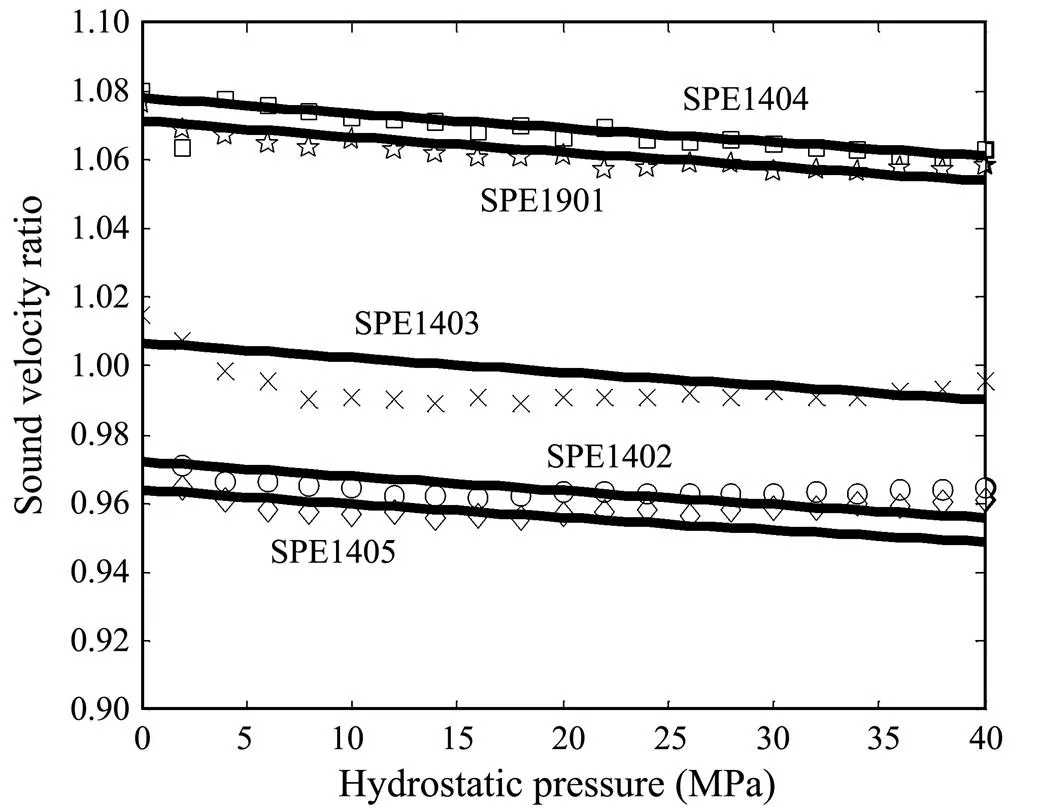
Fig.5 Dependence of the sound velocity ratio on hydrosta- tic pressure in different sediments: SPE1402 (○), SPE14- 03 (×), SPE1404 (□), SPE1405 (◇), and SPE1901 (☆) denote the experimental results, and the solid lines represent the calculated EDFM results.
4 Discussion
Sandy sediments have good porous connections, with the inside pore water being well-connected and easily ba- lancing changes in temperature and pressure. The physical state of pore water rapidly changes and evenly affects the solid grains of the sediment due to the good porous connections. Because of the relatively minor changes in the solid grains within the experimental temperature and pressure ranges, changes in the physical properties of the pore water was determined to dominate changes in the acoustic properties of the sediments. This finding was ve- rified in both the temperature experiment (Carbó’s sand sample, STX1204, and TS1 in Fig.4) and pressure expe- riment(SPE1404 and SPE1901 in Fig.5), and shows good agreement with the theoretical analysis. However, the porous connections are complex. In sediments with more clay and silt, the pores are smaller and the pore channels are narrower, although the pore water retained its dominant role in the experiments. However, reconstruction of tortuous pore channels by changes in the environmental conditions becomes increasingly complex, due to the enhanced capillary action and blockage effect of more finely grained particles. Fluctuations occur with changes in the physical properties of the sediment, followed by changes in the sound speed of the sediment. Due to heat conduction, the silty sample STX1205 and the clayey sample TS4 in the temperature experiment showed the same change phenomenon as the sandy samples. However, in the hydrostatic pressure experiment, effects such as capillary action and the blockage effect lead to more complex influences on the sediment. These effects may increase the non-uni- formity and weaken the effect of the pore water, which was found in the clayey sample SPE1202 and the silty sam- ples SPE1203 and SPE1205 at high pressure. The sound velocity ratios of the silty and clayey samples seemed to first rapidlyand then slowly decrease, whereas the sound velocity of the sandy sample decreased almost immediately. This phenomenon merits further study.
In Table 5, the uneven variation in the sound velocity ratio indicates anisotropy and non-uniformity in the sedi- ment. The inhomogeneous distribution of the sediment-grain composition and the loosely packed pore structure can lead to a micro-reconstruction of the texture under the action of thermal or hydrostatic stress, which then causes a slight fluctuation in the sound speed of the sediment (Zou., 2015, 2019).
The sound-speed dispersion in samples SPE1402 and SPE1403 slightly increased in by approximately 10ms−1, whereas the acoustic frequency increased from 25kHz to 250kHz (Kan., 2018).This dispersion is smaller than the result obtained by Buckingham and Richardson (2002) of approximately 17ms−1, with the acoustic frequency increasing from 25kHz to 100kHz. The difference may be due to the different types of seafloor sedimentin the two studies. It indicates that the dispersion of seafloor sediments hadno significant effect on the detection frequency in this experiment (in Table 4). Although the acoustic detection frequencies were different and dispersion was evident in the datasets, the experimental results showed that the influence of environmental factors on the sound velocity ratio resulted in almost the same change trend at different detection frequencies. As shown in Fig.4, the sound velocity ratios changed similarly with increases in temperature at 1MHz, 23.8kHz, and 35kHz, which agrees with the EDFM analysis shown in Fig.1a. As depicted in Fig.5, the sound velocity ratios changed similarly with increases in the hydrostatic pressure at 33kHz and 100kHz, which substantially agrees with the EDFM analysis shown in Fig.1b.
The experimental results showed that the sound velo- city ratio decreased with increases in both temperature and hydrostatic pressure. Compared with the theoretical calculations, the experimental results showed fluctuations in the decreasing trend due to the complex texture and composition of the actual samples. The experimental ana- lysis showed that the sound velocity ratio changed up to 0.0008per℃ when the temperature ranged from 2℃ to 25℃ and up to 0.0064MPa−1when the hydrostatic pressure ranged from 0 to 40MPa. The experimental results were slightly larger than those obtained by theoretical analysis. The change rate of the sound velocity due to changes in hydrostatic pressure was slightly higher than that due to changes in temperature for the examined environmental conditions.
Therefore, use of the sound velocity ratio method(Ha- milton, 1971), wherein the sound velocity ratio is consi- dered to be constant, can incur errors when it is applied to correct the variation in sound speed caused by variations in temperature and hydrostatic pressure under different environmental conditions (.,, laboratory, and different depths below the seafloor). The expected errors can be estimated, as shown in Table 5.
5 Conclusions
Various compositions and textures are major factors that determine the acoustic properties of seafloor sediments. However, temperature and hydrostatic pressure are also key factors that impact the acoustic properties of seafloor surficial sediments in different sedimentary environmental conditions. By comparing the results obtained by experimental measurements and theoretical calculations, the re- lationship between the sound velocity ratio and environmental factors was investigated with consideration of boththe sediment types and different detection frequencies. These analyses yielded some meaningful results, from which the following conclusions can be drawn:
1) Among the three environmental factors considered, the sound velocity ratio is sensitive to temperature and pressure but not to salinity.
2) In surficial sediments, pore water plays a key role in the sound velocity ratio of sediment influenced by environmental factors.
3) The sound velocities of different types of sediments (sandy, silty, and clayey sediments) change in similar ways with temperature, but change slightly differently with hy- drostatic pressure.
4) The influence of environmental factors on the sound velocity ratio of seafloor sediments is independent of different detection frequencies.
5) The sound velocity ratio decreases with both temperature and hydrostatic pressure.
6) The results obtained by experimental measurements regarding the influence of temperature and hydrostatic pressure on the sound velocity ratio agree with those obtained by the EDFM.
Acknowledgements
This work was financially supported by the National Natural Science Foundation of China (Nos. 41676055 and 41776043), the Natural Science Foundation of GuangdongProvince (No. 2019A1515011055), and the Foundation of Qingdao National Laboratory for Marine Science and Te- chnology (No. MGQNLM-KF201805). The authors wish to thank the staff at Guangdong University of Technology, the First Institute of Oceanography of Ministry of Natural Resources, and the South China Sea Institute of Oceanology of Chinese Academy of Sciences for performing mea-surements, conducting experiments, analyzing the datasets, and discussing the findings for this research. The authors also wish to thank the reviewers and Pro. Guoliang Ye for providing so much valuable advice regarding this paper.
Bachman, R. T., 1989. Estimating velocity ratio in marine sediment., 86 (5): 2029-2032, DOI: 10.1121/1.398585.
Ballard, M. S., Lee, K. M., McNeese, A. R., Wilson, P. S., and Goff, J. A., 2016. Development of a system formea- surements of geoacoustic properties during sediment coring.of, 139: 2125.
Buckingham, M. J., 2005. Compressional and shear wave pro- perties of marine sediments: Comparisons between theory and data., 117 (1): 137-152, DOI: 10.1121/1.1810231.
Buckingham, M. J., and Richardson, M. D., 2002. On tone-burst measurements of sound speed and attenuation in sandy marine sediments., 27 (3): 429-453, DOI: 10.1109/joe.2002.1040929.
Buckingham, M. J., Giddens, E. M., Simonet, F., and Hahn, T. R., 2012. Propeller noise from a light aircraft for low-frequency measurements of the, speed of sound in a marine se- diment., 10 (4): 445-464, DOI: 10.1142/s0218396x02001760.
Carbó, R., and Molero, A. C., 2000. The effect of temperature on sound wave absorption in a sediment layer., 108 (4): 1545-1547, DOI: 10.1121/1.1289360.
Chapman, N. R., 2016. A critical review of geoacoustic inversion: What does it really tell us about the ocean bottom?, 140 (4): 3023, DOI: 10.1121/1.4969376.
De, C., and Chakraborty, B., 2011. Model-based acoustic remote sensing of seafloor characteristics., 49 (10): 3868-3877, DOI: 10.1109/ tgrs.2011.2139218.
Eastwood, J., 1993. Temperature-dependent propagation of P- and S-waves of Cold Lake oil sands: Comparison of theory and experiment., 58 (6): 863-871, DOI: 10.1190/1. 1443470.
Endler, M., Endler, R., Bobertz, B., Leipe, T., and Arz, H. W., 2015. Linkage between acoustic parameters and seabed sediment properties in the south-western Baltic Sea., 35 (2): 145-160, DOI: 10.1007/s00367-015-0397-3.
Gorgas, T. J., Wilkens, R. H., Fu, S. S., Neil Frazer, L., Richardson, M. D., Briggs, K. B., and Lee, H., 2002.acoustic and laboratory ultrasonic sound speed and attenuation mea- sured in heterogeneous soft seabed sediments: Eel River shelf, California., 182 (1): 103-119, DOI: 10.1016/ S0025-3227(01)00230-4.
Hamilton, E. L., 1970. Sound velocity and related properties of marine sediments, North Pacific., 75 (23): 4423-4446, DOI: 10.1029/JB075i023p04423.
Hamilton, E. L., 1971. Prediction ofacoustic and elastic properties of marine sediments., 36 (2): 366-377, DOI: 10.1190/1.1440168.
Hamilton, E. L., 1985. Sound velocity as a function of depth in marine sediments., 78 (4): 1348-1355, DOI: 10.1121/1.392905.
Hamilton, E. L., and Bachman, R. T., 1982. Sound velocity and related properties of marine sediments., 72 (6): 1891-1904, DOI: 10.11 21/1.388539.
Hoffman, N. W., and Tobin, H. J., 2002. An empirical relationship between velocity and porosity for underthrust sediments of the Nankai Trough accretionary prism., 190/196: 1-23, DOI: 10.2973/odp.proc.sr.190196.355.2004.
Jackson, D. R., and Richardson, M. D., 2007.. Springer-Verlag, New York, 1-605.
Kan, G., Liu, B., Wang, J., Meng, X., Li, G., Hua, Q., and Sun, L., 2018. Sound speed dispersion characteristics of three typesof shallow sediments in the southern Yellow Sea.y, 36 (7): 853-860, DOI: 10.1080/ 1064119X.2017.1392659.
Kan, G., Su, Y., Li, G., Liu, B., and Meng, X., 2013. The correlations betweensound speeds and physical parameters of seafloor sediments in the middle area of the southern Huang- hai Sea., 35 (3): 166-171, DOI: 10. 3969/j.issn.0253-4193.2013.03.019.
Kan, G., Zou, D., Liu, B., Wang, J., Meng, X., Li, G., and Pei, Y., 2019. Correction for effects of temperature and pressure on sound speed in shallow seafloor sediments., 37 (10): 1217-1226, DOI: 10.1080/ 1064119X.2018.1545812.
Kim, S., Lee, G. S., Kim, D., Hahn, J., and Ryang, W., 2018. Variation of temperature-dependent sound velocity in unconsolidated marine sediments: Laboratory measurements., 36 (3): 280-287, DOI: 10.1080/1064119X.2016.1277442.
Li, Z., and Li, F., 2010. Geoacoustic inversion for sediments in the South China Sea based on a hybrid inversion scheme., 28 (5): 990- 995, DOI: 10.1007/s00343-010-9117-z.
Lu, B., Li, G., Huang, S., and Li, C., 2006. Physical properties of sediments on the northern continental shelf of the South China Sea., 24 (1): 47- 60, DOI: 10.1080/10641190600559523.
Lu, B., Li, G., Liu, Q., Huang, S., and Zhang, F., 2007. A study on seafloor sediment and its acouso-physical properties in the southeast offshore sea area of Hainan Island in China., 29 (4): 34-42, DOI: 10.3321/j.issn:02 53-4193.2007.04.004.
Meng, X., Li, G., Han, G., and Kan, G., 2015. Sound velocity and related properties of seafloor sediments in the Bering Sea and Chukchi Sea., 34 (5): 75-80, DOI: 10.1007/s13131-015-0669-9.
Rajan, S. D., and Frisk, G. V., 1992. Seasonal variations of the sediment compressional wave-speed profile in the Gulf of Me- xico., 91 (1): 127-135, DOI: 10.1121/1.402760.
Richardson, M. D., and Briggs, K. B., 1996.and laboratory geoacoustic measurements in soft mud and hard-packed sand sediments: Implications for high-frequency acoustic pro- pagation and scattering., 16 (3): 196-203, DOI: 10.1007/BF01204509.
Richardson, M. D., and Briggs, K. B., 2004. Empirical predictions of seafloor properties based on remotely measured se- diment impedance.. La Jolla, CA, 12-21, DOI: 10.1063/1.1842992.
Shumway, G., 1958. Sound velocity. temperature in water- saturated sediments., 23 (3): 494-505, DOI: 10.11 21/1.1930017.
Tao, C. H., Deng, X. M., Li, H. X., Zhou, J. P., Jin, X. B., Fu, S. S., Wilkens, R. H., Gu, C. H., and He, Y. H., 2009. Development ofmarine sediment geo-acoustic measurement system with real-time and multi frequencies (the second ge- neration)., 23 (4): 769-778, DOI: 10. 1016/j.oceaneng.2008.10.004.
Wang, J., Guo, C., Liu, B., Hou, Z., and Han, G., 2016. Distribution of geoacoustic properties and related influencing factors of surface sediments in the southern South China Sea., 37 (4): 1-12, DOI: 10.1007/s11001-0 16-9294-z.
Williams, K. L., 2001. An effective density fluid model for acoustic propagation in sediments derived from Biot theory., 110 (5): 2276- 2281, DOI: 10.1121/1.4776930.
Williams, K., Ewart, T., Jackson, D., Thorsos, E., Dahl, P., and Tang, D., 2015. Six decades of evolution in underwater acoustics at the Applied Physics Laboratory-University of Washington (APL-UW).,23: 1-15, DOI: 10.1121/1.4920514.
Zou, D., 2018. Relationship between the sound velocity ratio of the compressional wave and the physical characteristics of seafloor sediments., 43 (1): 41-51, DOI: 10.159 49/j.cnki.0371-0025.2018.01.005 (in Chinese with English abs- tract).
Zou, D., Kan, G., Long, J., and Xiao, T., 2019. Influence of hydrostatic pressure on the sound speed of surficial seafloor se- diments., 37 (3): 277- 281, DOI: 10.1080/1064119X.2017.1409300.
Zou, D., Williams, K. L., and Thorsos, E. I., 2015. Influence of temperature on the acoustic sound speed and attenuation of sand sediment., 40 (4): 969-980, DOI: 10.1109/JOE.2014.2365072.
June 11, 2020;
October 9, 2020;
December 8, 2020
© Ocean University of China, Science Press and Springer-Verlag GmbH Germany 2021
E-mail: anthonyzou@gdut.edu.cn E-mail: kgming135@fio.org.cn
(Edited by Chen Wenwen)
 Journal of Ocean University of China2021年3期
- Journal of Ocean University of China的其它文章
- Case Study of a Short-Term Wave Energy Forecasting Scheme:North Indian Ocean
- Temporal and Spatial Characteristics of Wave Energy Resources in Sri Lankan Waters over the Past 30 Years
- Vibration Deformation Monitoring of Offshore Wind Turbines Based on GBIR
- Dependence of Estimating Whitecap Coverage on Currents and Swells
- The Variation of Microbial (Methanotroph) Communities in Marine Sediments Due to Aerobic Oxidation of Hydrocarbons
- 3-Aminopropyltriethoxysilane Complexation with Iron Ion Modified Anode in Marine Sediment Microbial Fuel Cells with Enhanced Electrochemical Performance