
The investigation of quasi coherent mode on EAST using Doppler reflectometry
2021-09-10 09:26JiaxuJI季佳旭AdiLIU刘阿娣ChuZHOU周楚XiFENG冯喜ShouxinWANG王守信HaiqingLIU刘海庆HailinZHAO赵海林YongLIU刘永JinZHANG张津ZhaoyangLIU刘朝阳XiaomingZHONG仲小明HongruiFAN范泓锐GeZHUANG庄革JinlinXIE谢锦林TaoLAN兰涛WenzheMAO毛文哲WeixingDING丁卫星HongLI李弘
Plasma Science and Technology 2021年9期
Jiaxu JI (季佳旭),Adi LIU (刘阿娣),Chu ZHOU (周楚),Xi FENG (冯喜),Shouxin WANG (王守信),Haiqing LIU (刘海庆),Hailin ZHAO (赵海林),Yong LIU (刘永),Jin ZHANG (张津),Zhaoyang LIU (刘朝阳),Xiaoming ZHONG (仲小明),Hongrui FAN (范泓锐),Ge ZHUANG (庄革),Jinlin XIE (谢锦林),Tao LAN (兰涛),Wenzhe MAO (毛文哲),Weixing DING (丁卫星),Hong LI (李弘),Zixi LIU (刘子奚) and Wandong LIU (刘万东)
1 School of Nuclear Sciences and Technology,University of Science and Technology of China,Hefei 230026,People’s Republic of China
2 Institute of Plasma Physics,Chinese Academy of Sciences,Hefei 230031,People’s Republic of China
Abstract An electrostatic Quasi coherent mode has been observed in density fluctuations and perpendicular velocity fluctuations with the frequency range of 3–80 kHz on the Experimental Advanced Superconducting Tokamak using multi-channel Doppler reflectometry.It appears in the edge localized mode(ELM)-free period after L-H transition or in the inter-ELM period.The mode rotates almost together with the plasma with the poloidal wave number around 0.6cm− 1,and its frequency chirps with plasma poloidal velocity.The mode can exist in a large radial coverage(ρ=0.75–0.98),and peaks near the top of pedestal,suggesting that it might be excited in the steep gradient pedestal region,and spread into the core area.
Keywords: H-mode,turbulence,quasi coherent mode,doppler reflectometry
1.Introduction
The high-confinement mode (H-mode) operation,characterized by a large transport barrier in edge plasma[1,2],always accompanied with the edge localized modes (ELMs).The ELM is a kind of periodic magnetohydrodynamics (MHD)instability,which may generate large transient heat loads on plasma facing component from plasma.It occurs when the pressure and/or current at pedestal exceed the critical value,meanwhile,the pedestal will collapse and then rebuild after the ELMs burst.So it is important to investigate the nature of pedestal for ELM control and optimizing plasma operation.In the plasma edge,many kinds of instabilities can arise because of the free energy from the high gradient.Nowadays,QCMs have been observed at the pedestal of plasma in different tokamak devices.In Alcator C-Mod tokamak,the Quasi coherent mode(QCM)in density and magnetic fluctuations at the pedestal of enhancedαD (EDA) H-mode plasma was investigated [3,4].It reported that the QCM is a kind of resistive ballooning mode,and can enhance the particle and impurity transports.In DIII-D [5],a set of high frequency coherent modes with the frequency range of 80–250 kHz in high density quiescent H-mode plasma were observed.They belong to the kinetic ballooning mode,and play an important role in pedestal saturation.In HL-2A [6],a kind of electromagnetic QCM with a frequency range of 50–100 kHz has been observed using Doppler reflectometry(DR).It appears at the pedestal during the ELM free period after L-H transition or inter ELM period,and is driven by the density gradient.
In Experimental Advanced Superconducting Tokamak(EAST),the coherent mode (CM) exists in the H-mode operation widely,and different types of CM have been reported [7–17].In the 2012 campaign,an electrostatic edge coherent mode (ECM) with 20–90 kHz has been observed at the high steep-gradient pedestal region of H-mode plasmas firstly.It drives the outflow of particles and heat,and the simulations shows that it is dissipative trapped electron mode(DTEM)dominated[7].Later in the 2014 campaign,the CM with a frequency from 80–100 kHz down to 40–50 kHz has been investigated.It reported that the ECM’s behavior is related to the pedestal pressure,and may affect the outward transport in the pedestal region [8].Simulations of CMs during the inter-ELM phase in EAST have also been achieved using BOUT++,and it showed that the density profile can provide more energy than electron temperature to drive the turbulence [9].However,the investigations mainly focused on the edge plasma,and the relationship between the poloidal rotation and the coherent mode is still unknown.In this paper,the radial distribution of QCM and the evolution of the QCM’s frequency as the poloidal rotation are investigated by the multi-channel DR system [18].The multi-channel DR system is installed at the K-port of EAST,and it can provide the turbulence measurements at eight different radial locations simultaneously by launching eight different probing beams into plasma at the same time.
The paper will be organized as follows.In section 2,the experimental arrangement and the main diagnostic are introduced.Section 3 details the experimental results of QCM.In section 3.1,the recognition of QCM by DR is introduced.The evolutions of the poloidal velocity,the frequency and the amplitude of QCM are performed.In section 3.2,the radial distribution of QCM has been demonstrated,and the discharges in which the QCM may exist in the regions inside the pedestal are displayed.Section 4 is the summary of the experimental results.
2.Experimental arrangement
EAST is a medium-sized full superconducting tokamak,with the parametersR0~1.85 m,a~0.45 m,IP≤1 MA,BT≤3.5 T[19].DR is a powerful turbulence diagnostic,which can provide measurements of the poloidal rotation and local fluctuations with medium wavenumber.The main diagnostics in this paper is the eight-channel DR,which can launch eight different frequencies (55,57.5,60,62.5,67.5,70,72.5,75 GHz) into the plasma simultaneously [18].Since the probing beam is oblique to the cutoff layer,the Doppler shift caused by the movement of the fluctuations around the cutoff layer can be written asfD=k⊥u⊥/2π,hereu⊥is the perpendicular velocity of the measured fluctuation around the cutoff layer,and⊥kis the measured perpendicular wavenumber.The measured perpendicular wavenumber and radial locations of the cutoff layer are calculated by the raytracing[20].In the experiments,the incident angle is 5°− 12° ,and the measured wavenumber coverage is 2–15cm−1.In the laboratory frame,the perpendicular velocity is the sum of theE×BvelocityvE×Band the phase velocity of turbulencevphase,which can be written asu⊥=vE×B+vphase.In most tokamak and stellarator plasmas,the phase velocity at the edge plasma is much smaller than the ×E Bvelocity,so we can calculate the radial electric fieldErfrom the expressionEr~u⊥B[21].
In the experiments,the received backscattered signals of DR are obtained from the in-phase signal (I(t)=A(t)cosφ(t)),and quadrature signal(Q(t)=A(t)sinφ(t))ofI/Qmixer.It can be rewritten as a complex signal:Aeiφ=A(t)cosφ(t)+iA(t)sinφ(t)=I+iQ.Then,the amplitude and the phase of the signal can be expressed asTwo different methods are commonly used to calculate the Doppler shift: the phase derivation methodand the center of gravity method.For turbulence measurements,the amplitudeAis proportion to the fluctuation level,and the phase derivation dφ/ dtfluctuation corresponds to the perpendicular velocity(radial electric field) fluctuations.
3.Experimental results
3.1.The identification of QCM by DR
Figure 1 shows a typical upper single null H-mode discharge with QCM in EAST,with the parameters: the plasma currentIP~500 KA,the toroidal magnetic fieldBT~2.4 T,the edge safety factorq95~5.2.It is an RF-dominating discharge,with LHCD~1.5 MW and ECRH ~0.4 MW,as shown in figure 1(a).The H-mode is achieved by LHCD.Around 2.68 s,the Dα radiation decreases abruptly,the lineaveraged density and the stored energy increase quickly,indicating the L-H transition,as shown in figures 1(b)and(c).In the spectrum of the perpendicular velocity of DR(figure 1(d)),a QCM appears a moment after L-H transition,and the frequency changes from 65 kHz to 21 kHz.As the increase of the density during L-H transition,the detecting radius moves fromρ~ 0.83 in the L-mode toρ~ 0.96 in H-mode,as shown in figure 1(d).The QCM is strong in the density fluctuation and the perpendicular velocity fluctuation.As shown in figure 2,obvious peaks corresponding to the QCM can be found both in the spectra of density fluctuation and perpendicular velocity fluctuation.However,we cannot find a corresponding peak in the magnetic fluctuation and the cross coherence coefficient between magnetic probe and DR signals is also quite weak,suggesting that QCM is a predominantly electrostatic mode.
The evolutions of perpendicular velocity at pedestal,the QCM’s frequency and intensity during L-H transition are exhibited in figure 3.It is also an RF-dominating discharge(LHCD~1.5 MW and ECRH ~0.8 MW) with the parameters: the plasma currentIP~400 kA,the toroidal magnetic fieldBT~2.4 T,and the edge safety factorq95~6.2.The spectrum of density fluctuation and the perpendicular velocity detected by DR aroundρ~ 0.95 (in H-mode) are shown in figures 3(a) and (b).The L-H transition occurs around 2.35 s,and the perpendicular velocity increases rapidly in the electric diamagnetic direction,indicating the formation of the pedestal.It is noted that the QCM appears a moment later than the L-H transition (in keeping with that in figure 1),and it is aroused when the perpendicular velocity almost achieves the maximum value.After the appearance of QCM,its intensity increases and then keeps almost immobile,as shown in figure 3(d).Its frequency decreases from 60 kHz to around 20 kHz,and is consistent with the decreases of the perpendicular velocity in figure 3(c).

Figure 1.QCM identification (discharge #93358).Time traces of the discharge: (a) LHCD and ECRH heating power; (b) the lineaveraged density and the stored energy; (c) Dα radiation; (d) the spectrum of the perpendicular velocity detected by DR.
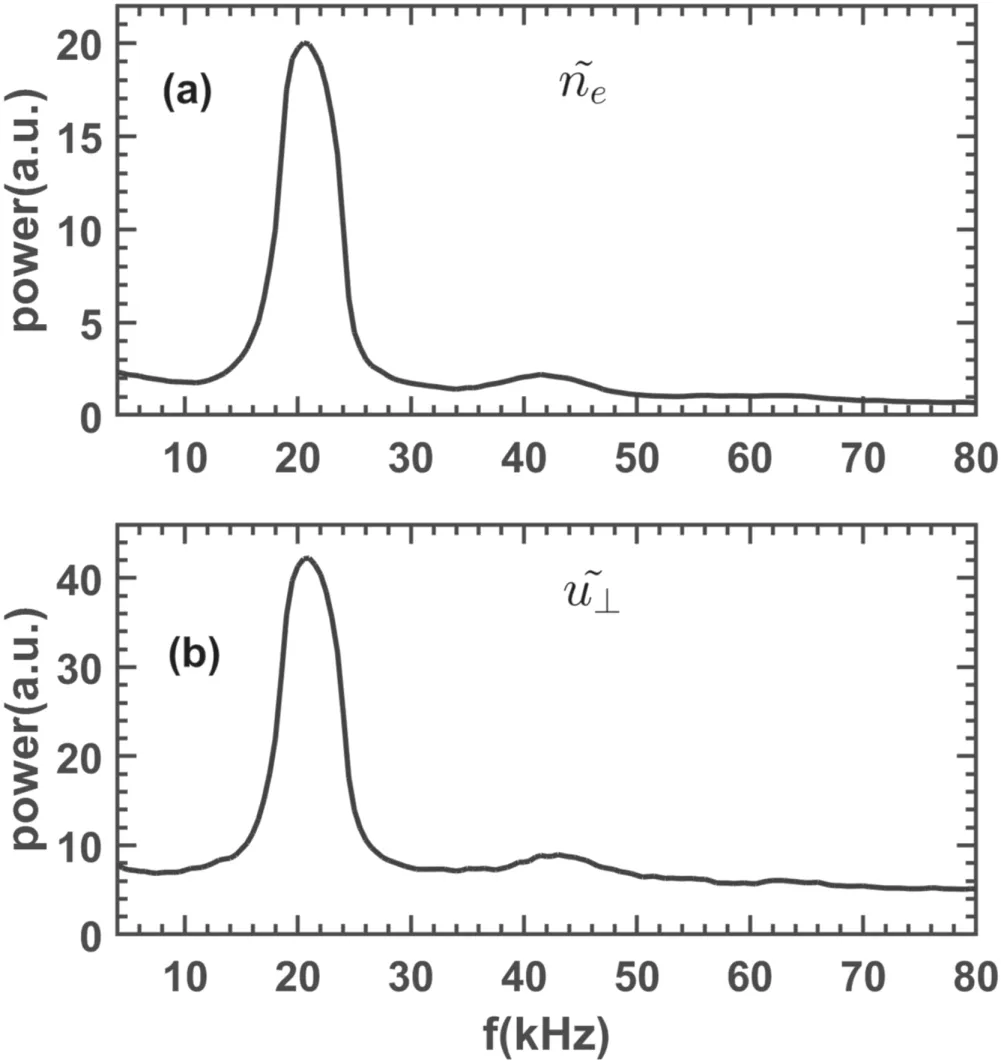
Figure 2.The power spectra of (a) the density fluctuation,(b) the perpendicular velocity fluctuation for discharge #93358.

Figure 3.(a) The spectrum of QCM,(b) poloidal rotation velocity,(c) the evolution of QCM frequency,(d) the evolution of QCM intensity for discharge #90507.
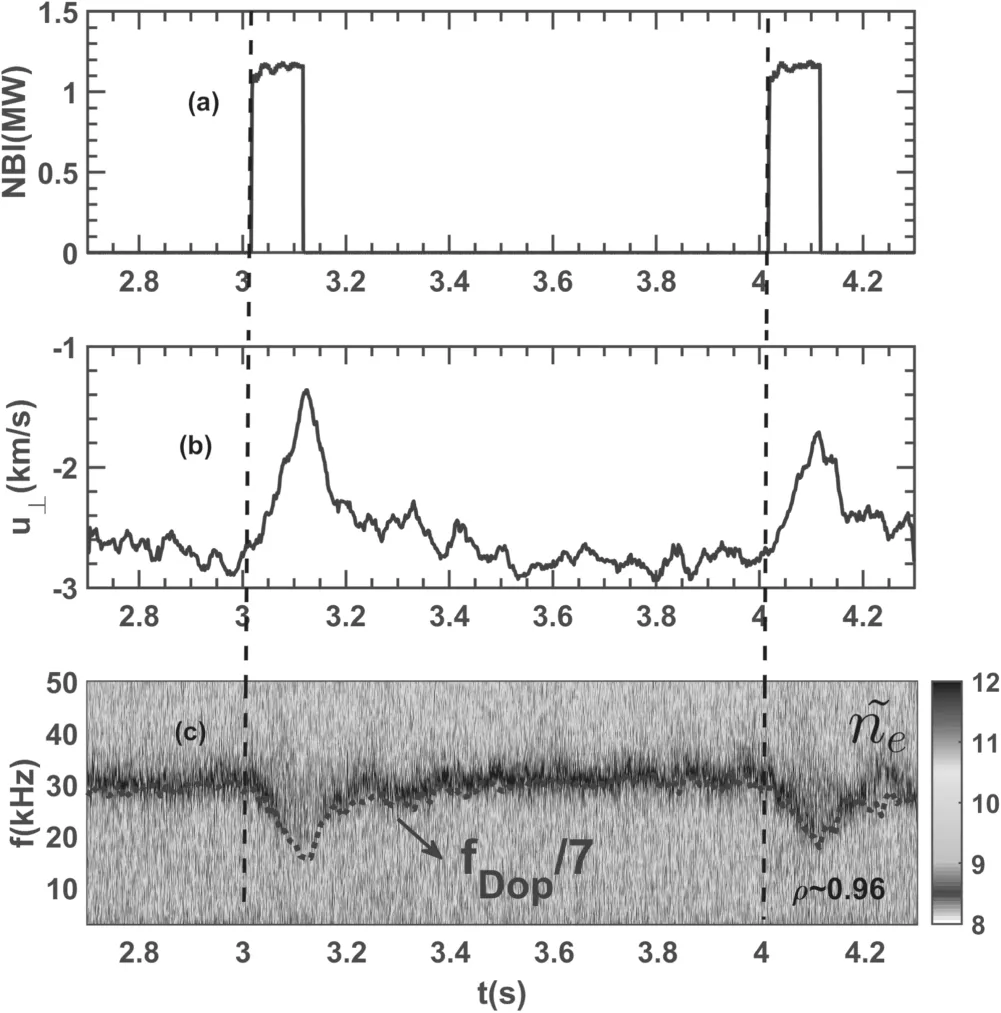
Figure 4.(a) NBI heating power,(b) poloidal velocity measured by DR,(c) spectrum of density fluctuation measured by DR,and the dashed line is the measured Doppler shift fDop/7,for discharge#94234.
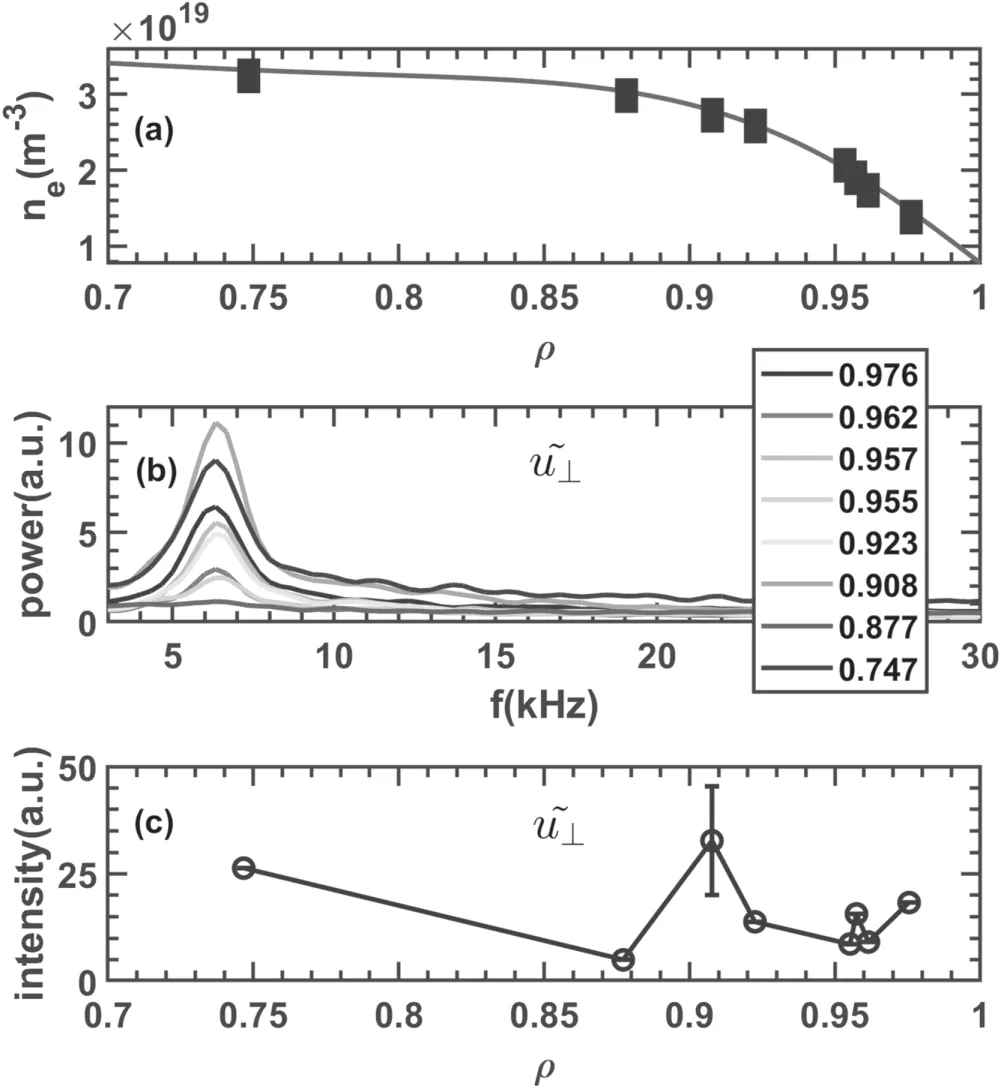
Figure 5.(a)The density profile and the detected location of incident microwave beams,(b) the power spectra of perpendicular velocity measured by DR,(c) the radial distribution of QCM intensity on perpendicular velocity fluctuation for discharge #91297.
To further study the relationship between the QCM’s frequency and the perpendicular velocity,evolutions of the perpendicular velocity and the QCM’s frequency during neutral beam injection (NBI) are investigated,as shown in figure 4.During the NBI blips,the power of LHCD and ECRH are constant (LHCD~3 MW and ECRH ~0.9 MW)with the plasma currentIP~500 kA,the toroidal magnetic fieldBT~2.4 T,and the edge safety factorq95~6.5.There are two NBI pulses in figure 4(a),and after the injection of the neutral beam,the perpendicular velocity decreases from about−3 km s−1to −1.5 km s−1atρ~ 0.96.Here,the positive direction is the ion diamagnetic direction.As the decrease of the perpendicular velocity,the QCM’s frequency decreases from 31 kHz to around 19 kHz.After NBI injection,the mode frequency increases to 31 kHz again,along with the increase of perpendicular velocity,as shown in figures 4(b) and (c).The blue dotted line in figure 4(c) is the measured Doppler shift divided by a constant number 7,which can be expressed byfDop/ 7.It is almost entirely consistent with the evolution of QCM’s frequency,indicating that the mode rotates with the plasma,and its frequency is mainly affected by the poloidal rotation.In the experiments,the wavenumber of DR systemk⊥is~4cm−1,and the wavenumber of QCM can be calculated bykQCM=2πfQCM/v⊥=2πfDop/7v⊥=k⊥/7 ≈0.6 cm−1.It should be pointed out that the QCM’s wavenumber is too small to be measured directly by DR system,and here the QCM is measured through the modulation of the cutoff layer caused by QCM [6,22].
3.2.Radial distribution of QCM
The QCM can be observed in the perpendicular velocity fluctuation by all the eight channels of eight-channel DR system,as shown in figure 5.It is a relatively low toroidal magnetic field(BT~1.6 T)discharge with the plasma currentIP~400 kA,and the edge safety factorq95~4.3.A benefit from this low magnetic field is that the eight-channel DR system can cover a large radial range from the bottom of pedestal to the inner locations of pedestal,which makes it possible to compare the intensity of QCM at different radial locations.Figure 5(a) shows the density profile,and the blue rectangles represent the measured locations of the eight channels of the DR system,indicating that the DR system can cover the whole pedestal and the inner regions.The perpendicular velocity power spectra of the eight channels are exhibited in figure 5(b),and the peaks corresponding to the QCM are obvious in all the channels.This means that QCM exits not only in the pedestal,but also in the inner regions(ρ~0.75).The radial distribution of QCM is calculated by the DR system,as shown in figure 5(c),and it peaks near the top of the pedestal,suggesting that QCM may be aroused at the high steep-gradient pedestal region,and then spreading to the inner and outer locations [23].However,the reason why the intensity of QCM aroundρ~0.75 is significant strong is still unknown,and needs a further investigation.

Figure 6.Discharges in which QCMs exist inside the pedestal area.
The QCM exists widely in the ELM-free operation after L-H transition and the inter-ELM periods,and in previous works on EAST,the investigation of this mode mainly focused on the edge region of plasma.Through the analysis of a large number of discharges on EAST,we found that in most cases it can also be observed in the regions inside the pedestal.In figure 6,the discharges in which the QCM can be observed in the inside pedestal regions were exhibited.One can note that the plasma parameters cover a large range: the edge safety factorq95from 3.5 to 6,the line-averaged densitynefrom 3× 1 019m−3to 5.5× 1 019m−3,and the toroidal magnetic fieldBTfrom 1.60 T (the blue stars in figure 6) to 2.47 T (the blue,red and magenta circles in figure 6) with different kinds of auxiliary heating methods,such as LHCD+NBI heating (blue circles,squares,diamonds and stars in figure 6),LHCD+ECRH heating (red circles in figure 6),and LHCD+NBI+ECRH heating (magenta circles in figure 6).This means that QCM existing in the inside pedestal area is a ubiquitous phenomenon,and is irrelevant to the plasma parameters and auxiliary heating methods.
4.Summary
In conclusion,an electrostatic QCM has been observed in density and perpendicular velocity fluctuations in EAST ELM-free operation after L-H transition and inter-ELM periods using the multi-channel DR system.The mode frequency range is 3–80 kHz,and is mainly affected by the poloidal rotation.It rotates together with the plasma with the poloidal wave numberkQCM~0.6cm−1.The QCM can exist in the whole pedestal and the inner regions,and peaks at the high steep-gradient pedestal region,suggesting that QCM might be aroused at the pedestal and then spreads to the inner and outer locations.The statistical discharge result shows that QCM existing in the inner pedestal regions is a universal phenomenon,and it can be observed widely in EAST H-mode operations.However,how the mode spreads to the inner locations and what determines the mode intensity in the inner locations requires further investigation.
Acknowledgments
The present work is supported in part by the National MCF Energy R&D Program of China (Nos.2018YFE0311200,2017YFE0301204 and 2017YFE0301700),and National Natural Science Foundation of China (Nos.11635008,U1967206 and 11975231).We acknowledge the EAST team for the support of these experiments.
ORCID iDs
 Plasma Science and Technology2021年9期
- Plasma Science and Technology的其它文章
- Recent results of fusion triple product on EAST tokamak
- Suppression and mitigation of inter-ELM high-frequency Alfvén-like mode by resonant magnetic perturbation in EAST
- Simulations of NBI fast ion loss in the presence of toroidal field ripple on EAST
- Reconstructions of velocity distributions from fast-ion D-alpha (FIDA) measurements on EAST
- Tomography of emissivity for Doppler coherence imaging spectroscopy diagnostic in HL-2A
- Comparison of natural grassy ELM behavior in favorable/unfavorable Bt in EAST