
Ultrabroadband mid-infrared emission from Cr2+:ZnSe-doped chalcogenide glasses prepared via hot uniaxial pressing and melt-quenching∗
2021-09-28 02:17KeLunXia夏克伦GuangJia贾光HaoTianGan甘浩天YiMingGui桂一鸣XuShengZhang张徐生ZiJunLiu刘自军andXiangShen沈祥
Chinese Physics B 2021年9期
Ke-Lun Xia(夏克伦),Guang Jia(贾光),Hao-Tian Gan(甘浩天),Yi-Ming Gui(桂一鸣),Xu-Sheng Zhang(张徐生),Zi-Jun Liu(刘自军),†,and Xiang Shen(沈祥)
1Ningbo Institute of Oceanography,Ningbo 315832,China
2Laboratory of Infrared Materials and Devices,Advanced Technology Research Institute,Ningbo University,Ningbo 315211,China
3Key Laboratory of Photoelectric Detection Materials and Devices of Zhejiang Province,Ningbo 315211,China
Keywords:mid-infrared emission,glass-ceramics,hot uniaxial pressing,melt-quenching
1.Introduction
MIR incoherent and coherent light sources are in great demand for a variety of applications in environmental testing,bioengineering,gas sensing,medical,and military industries.[1–3]Transition metal-doped II–VI semiconductors(TM2+:II–VI)[4]have emerged as an excellent gain medium for MIR femtosecond pulses[5,6]or continuously tunable lasers[7,8]owing to their ultrabroad emission and absorption bands,large emission cross-sections,and high quantum efficiency.Cr2+-doped ZnSe is the most representative and widely studied gain media in the TM:II–VI family.Since the first report of a SESAM mode-locked Cr2+:ZnSe laser around 2.5µm,[9]Cr2+:ZnSe femtosecond lasers based on mode-locked techniques with higher output powers and repetition rates have been reported.[10,11]However,the output power upscaling and laser beam quality were limited by the thermal lensing effect of Cr2+:ZnSe(thermo-optic coefficient of ZnSe~70×10−6K).[12,13]
Up to now,considerable research has been devoted to the development of Cr2+:ZnSe fiber laser.[14]The structure of the fiber determines that it has a larger specific surface area to reduce the thermal lens effect.Furthermore,the fiber laser has higher pumping and conversion efficiency.[15]However,crystals have no glass transition temperature,so it is impossible to prepare crystal fiber by drawing process.Researchers have proposed a variety of preparation methods,but no ideal Cr2+:ZnSe fiber has been prepared.Among them,glass-ceramics fiber is one of the effective ways to realize crystal fiber laser.Cr2+:ZnSe-doped MIR glass can combine the advantages of easy process ability of glass and high emission efficiency of active crystal.Therefore,it is an effective way to make crystal gains-doped fiber by drawing glass-ceramics,which has potential application for the high-efficiency tunable MIR fiber lasers.
For such“crystal-in-glass”,the light scattering characteristics of glass-ceramics have a decisive influence on its optical properties.According to the Rayleigh–Gans model,the extinction coefficient(α)is expressed by the following formula:[16]
where N is the density number of crystallites,V is the volume of crystallites,k=2π/λ,R is the radius of crystallites,n is the refractive index of crystallites,Δn is the refractive index difference between the matrix glasses and crystallites.The parameters such as N,V,and R need to be further analyzed based on the results.Note thatΔn is the most important factor of light scattering,so it must be minimized.Therefore,glasses with a refractive index close to that of Cr2+:ZnSe crystal can be used as the matrix material of glass-ceramics.In this respect,ChGs is an ideal choice of matrix material owing to its tunable refractive index,excellent MIR transparency,chemical stability,and low phonon energy.[17]Furthermore,MIR passive fiber technology based on ChGs has matured.[18,19]By the way,the As–S–Se glass systems have been demonstrated to match the refractive index of Cr2+:ZnSe crystals.[20]
Glass-ceramics are usually prepared from the matrix glasses by controlling the crystallization behavior.[21,22]However,the target crystal can only be precipitated in a specific glass composition,which limits the choice of glass composition.Generally,the refractive index of the precipitated crystal phase is very different from that of the remaining glass phase,which will increase the Rayleigh scattering coefficient.And for TM2+:II–VI crystal,it is difficult to keep the transition metal ions in bivalent state(TM2+),especially after high temperature melting.Moreover,for ChGs,although ZnS/Se grains can be precipitated after heat treatment,the concentration of ZnS grains is not more than 1 mol%in As2S3glasses.[23]
In view of the low melting point and good hot-pressing performance of ChGs,two methods of introducing II–VI crystal into ChGs were developed.The first method is low temperature melt-quenching.Although the melting point of ChGs is low,there are still the possibility of disintegrate and atomic replacement for II–VI crystal.For example,when ZnSe is doped into ChGs by low temperature melting method,additional ZnS will be produced due to atom replacement at a relatively high temperature.[24]The refractive index of ZnS crystals(n=2.26 at 2.45µm)is significantly lower than that of ZnSe(n=2.44 at 2.45µm),and this refractive index difference will increase the scattering of light.The second method is to hot press the mixed powders of II–VI crystal and ChGs in vacuum.The HUP method based on the principle of glass powder sintering has advantages in the uniformity of composite dopants.[25,26]In addition,the low sintering temperature ensures that the crystal grains do not react with the matrix glasses.
In this study,we prepared glass-ceramics with fluorescence characteristics of Cr2+:ZnSe crystals and fiber-drawing ability of ChGs via HUP and melt-quenching,respectively.In the beginning,Cr2+-doped ZnSe crystals were prepared by thermal diffusion method,and their MIR fluorescences were characterized.Then the variation of refractive index of As–S–Se series glasses were studied,and the best composition matched with the refractive index of ZnSe was selected.Furthermore,Cr2+:ZnSe/As40S57Se3composite glasses with excellent infrared transparency and MIR emission properties were successfully prepared.The occurrence state and fluorescence characteristics of crystals in glass-ceramics prepared by different methods were studied.
2.Sample preparation
Cr2+:ZnSe polycrystalline was prepared by thermal diffusion of ZnSe bulk(99.99%purity)and CrSe powders(99.5%purity).CrSe powders were the diffusing agent of Cr2+ions,and ZnSe targets were placed in independent positions in the quartz ampoule to allow gas convection.After heating and vacuuming for 2 h,the quartz ampoule was sealed with an acetylene flame,diffused in a heating furnace at 930°C for 30 h,and cooled to RT for 10 h.As–S–Se ChGs were synthesized by As(5N),S(5N),and Se(5N).The weighed raw materials were heated and vacuumed in a quartz ampoule,melted at 650°C for 10 h,quenched in water,and annealed near the transition temperature.
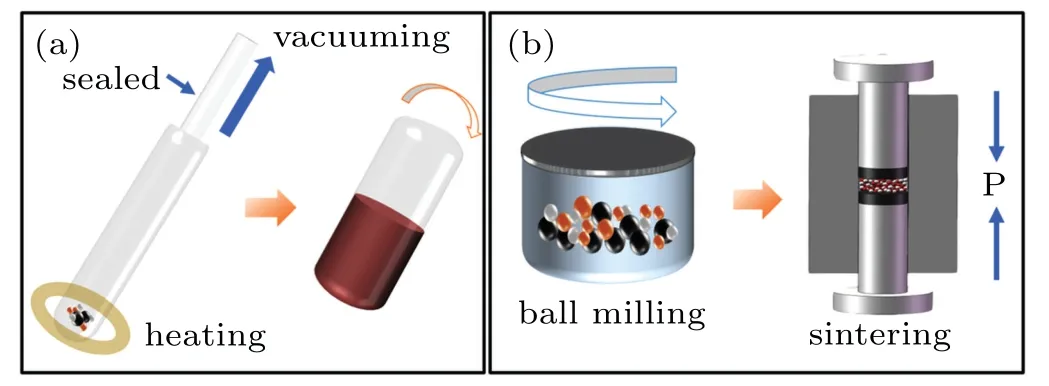
Fig.1.(a)Schematic diagram of the melt-quenching method.(b)Schematic diagram of the HUP method.
Cr2+:ZnSe/As–S–Se composites were prepared using the melt-quenching and HUP methods,respectively,as shown in Fig.1.The steps for preparing composite glasses via the melt-quenching method were the same as those previously described for the As–S–Se glasses.The melting temperature was changed to 500°C.The quartz ampoule’s swing angle was 90°from the horizontal position.The standing time before quenching should not be excessively long.In the HUP technology process,the Cr2+:ZnSe crystals and As–S–Se glass blocks were mechanically ground and evenly mixed more than 1 h at the speed of 500 rpm and protected with high-purity argon.Zirconia cans and balls were used for the grinding of the composites to avoid carbon or other impurities.And then the powders were quickly sintered into composite glasses at a temperature of 260°C and a pressure of 50 MPa.
The XRD spectra were obtained using a Bruker D8 diffractometer.The absorption and transmission spectra from visible to near infrared(in a range of 600 nm–2400 nm)were recorded by a P-E Lambda-950 spectrophotometer.IR transmission spectra(2.5µm–15µm)were measured using a Fourier transform infrared(FTIR)spectrophotometer.The morphology,distribution,and element-mapping images of the microcrystals in the composites were recorded by SEM(SU-70,Hitachi).MIR fluorescence spectra and decay curves were recorded using a fluorescence spectrometer(Edinburgh-FLS980,UK)with an InSb detector pumped by a 1550-nm laser diode(LD).All of the measurements were conducted at RT.
3.Results and discussion
3.1.Optical characteristics of Cr2+:ZnSe
Figure 2(a)shows the digital photos of three Cr2+:ZnSe crystals with different doping concentrations and their VIS-to-IR transmission spectra.All three samples show good transparency,and were labeled num 1,num 2,and num 3 in the order in the photos.It can be seen from the transmission curve that the sample has a strong absorption at the peak of 1.77µm,covering the frequency band of 1.5µm–2µm,which is consistent with the working wavelength of commercial laser.The sample has excellent transparency in the frequency band of 2µm–3µm,which corresponds to the wide band emission range of Cr2+ions.The absorption spectra[Fig.2(b)]of Cr2+:ZnSe crystals characterized the diffusion concentration of Cr2+ions in the tetrahedral coordination of ZnSe.The absorption coefficient of Cr2+ions can be estimated by[27]

whereαis the absorption coefficient,OD(λ)is the optical density,and L is the sample’s thickness.The thickness of the three samples are 1.92 mm,1.84 mm,and 1.88 mm in sequence.Figure 2(c)presents the linear relationship between the absorption coefficient at 1775 nm and the Cr2+ion doping concentration.Therefore,the average Cr2+ion concentrations of num 1,num 2,and num 3 samples are 2.216×1019cm−3,1.373×1019cm−3,and 2.263×1019cm−3,respectively.Close to 100% quantum yield of the corresponding emission for low Cr2+concentration(less than 1019cm−3)sample was demonstrated,while a strong decrease in the RT emission intensity and lifetime was found for Cr2+concentrations higher than 1019cm−3.[28,29]As shown in Fig.2(d),the num 2 sample with the lowest Cr2+ion concentration performed the strongest emission intensity,whereas the num 3 sample had the highest concentration and weakest emission intensity under the same pumping conditions.This conclusion was in accord with the previously described studies,so the num 2 sample was used as the experimental material.
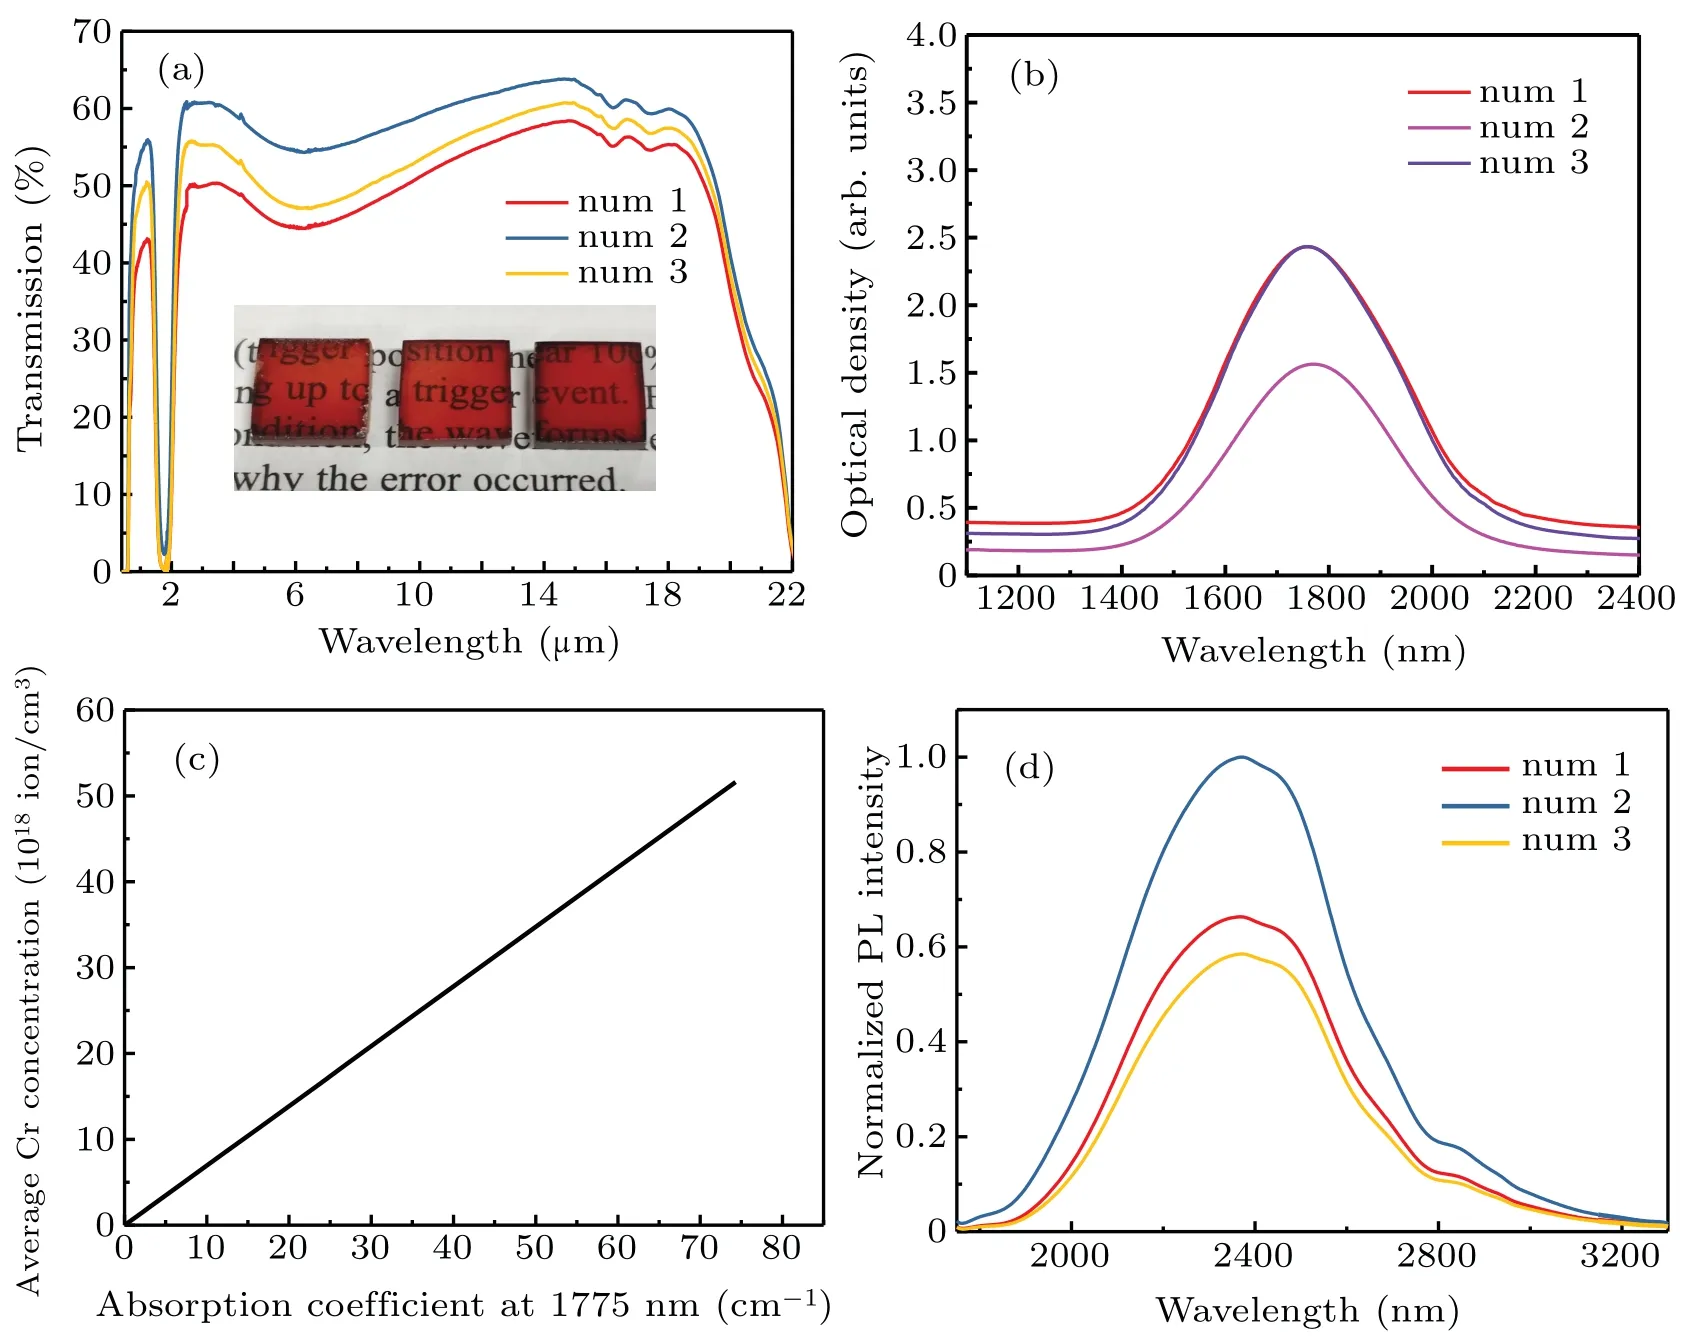
Fig.2.(a)Visible-to-infrared(VIS-to-IR)transmission spectra of the Cr2+:ZnSe.Inset:Digital photo of the polished sample.(b)Near-infrared(NIR)absorbance spectra of the Cr2+:ZnSe.(c)Correspondence between the absorption coefficient of Cr2+ions at 1775 nm and its average concentration in the ZnSe crystal.(d)Normalized fluorescence spectra of the Cr2+:ZnSe crystals pumped by a 1550-nm laser.
Figure 3(a)shows the energy level diagram of Cr2+in ZnSe crystal.The unique crystal structure of ZnSe crystal not only maintains the bivalent state of Cr ion,but also promotes the energy level splitting.Due to the influence of crystal field vibration and Jahn–Teller effect,the splitting of5E and5T2energy levels leads to the ultra-wide emission and absorption band of Cr2+.The decay curve of Cr2+:ZnSe sample in MIR emission was measured,as shown in Fig.3(b),and the pump wavelength is 1.55µm,the monitor wavelength is 2.4µm.The average life(τ)was calculated as follows:[27,28]
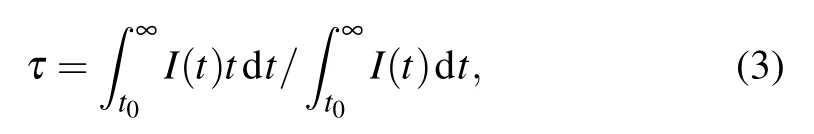
where I(t)is the luminescence intensity as a function of time t.The sample’s lifetime was 6.14µs.This is a typical value for Cr2+:ZnSe fluorescence kinetics.
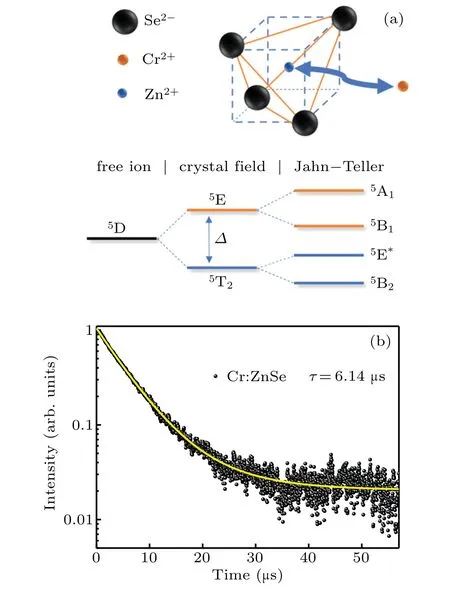
Fig.3.(a)Energy level diagram of the Cr2+in the tetrahedral hosts.(b)The decay curve of the Cr2+:ZnSe crystals monitored at 2.4µm.
3.2.Preparation of As40S57Se3 glasses
According to the Rayleigh–Gans model,reducing the refractive index difference between the matrix glass and crystal is the basis for fabricating transparent Cr2+:ZnSe-doped ChGs.And low hydroxyl absorption is an important factor for the broadband emission of Cr2+in the band of 2µm–3µm.Therefore,As–S–Se glass system was used as the matrix glass to match the refractive index of the Cr2+:ZnSe.As shown in Fig.4(a),in the emission band of Cr2+:ZnSe(2µm–3µm),the refractive index of As40S57Se3glasses is the closest to that of Cr2+:ZnSe.Therefore,As40S57Se3glass was determined to be used as the matrix glass.By the way,the refractive index of ZnS is apparently different from that of ZnSe.Note that material’s hydroxyl absorption can easily cause the emission spectrum of Cr2+ions to be interrupted near 2.7µm.To obtain a higher transparency and wider emission bands of the composites,As40S57Se3glasses with low hydroxyl absorption were prepared by distillation.Figure 4(b)presents the hightransparency purified glasses.

Fig.4.(a)Refractive index curves of ZnSe,ZnS,As2S3,As40S58Se2,and As40S57Se3.(b)Infrared transmission curve of the As40S57Se3 glasses.
3.3.Microstructure and optical properties of composite glasses
Based on num 2 crystals and purified As40S57Se3glasses,samples with compositions of xCr2+:ZnSe/(1−x)As40S57Se3(x=1,3,and 5 wt%)were fabricated by HUP and meltquenching,respectively.As shown in Fig.5(a),three sharp diffraction peaks were observed superimposed on a broad amorphous background in the HUP sample.The composites’diffraction peaks at 27.22°(111),45.20°(220),and 53.56°(311)matched the Miller indices of the sphalerite(JCPDS card No.88-2345).No ZnS diffraction peaks or any other crystals were found.Microcrystal deposition was observed in the composite rod prepared by melt-quenching.As shown in Fig.5(b),the x=0.5 wt% and x=1 wt% samples were cut from the non-deposition part of corresponding glass rods with different doping concentrations for analysis.Only the(220)lattice plane of the ZnSe cubic phase was detected in the x=0.5 wt%samples.The(111)and(220)lattice planes of the ZnSe cubic phase were detected in the x=1 wt% sample.Most of the microcrystals were detected in the bottom slice.Different degrees of the ZnS crystal phase(corresponding to No.89-2197)diffraction peaks appeared,which was probably caused by the ion displacement reaction.The electronegativity difference between S and Zn was greater than that of Se and Zn,and the S-based glass melt had a large amount of S element,which led to the precipitation of ZnS crystals.The precipitation of the ZnS crystal undoubtedly increased the scattering loss according to the Rayleigh–Gans model.

Fig.5.(a)XRD patterns of the xCr2+:ZnSe/(1−x)As40S57Se3(x=1,3,and 5 wt%)composite glasses prepared by HUP compared with JCPDS card No.88-2345ZnSe.(b)XRD patterns at x=0.5 wt%,x=1 wt%,and the bottom slice(prepared by melt-quenching)compared with JCPDS card No.89-2197ZnS and No.88-2345ZnSe.Insets(a)and(b):Average microcrystal size and crystallinity of the samples.
Further information on the doped microcrystals was ana-t lyzed to characterize the composites.The composites’averaget grain sizes were calculated using Scherrer’s equation[30,31]
whereλis the x-ray wavelength(0.15418 nm),K is the constant(0.89),βis the diffraction peak’s full width at half maximum(FWHM),andθis the Bragg angle.The embedded Cr2+:ZnSe microcrystals’average size was 155.87 nm,slightly larger than the size of the Cr2+:ZnSe microcrystals in the molten sample(134.32 nm).The precipitated ZnS microcrystals’size was 38.31 nm,confirming the displacement reaction hypothesis.
Crystallinity characterizes the proportion of crystals in composites.It is estimated by the area ratio of the crystallization peak to the crystallization peak plus amorphous peak.The crystallinity of the bottom slice reached 15.28%,while the crystallinity of the three HUP samples was only 0.93%,2.13%,and 2.29%,respectively.These data effectively quantified the uniform distribution of the embedded microcrystals.Although we increased the rocking angle and reduced the standing time,it was still difficult to control the uniform distribution of crystal grains during the melting process.
The distribution and morphology of the microcrystals embedded in the ChGs(prepared by HUP)were characterized by high-resolution SEM and EDS.As shown in Fig.6(a),most of the microcrystals were uniformly distributed,and the crystal grain spacing is clearly larger than the crystal size.Moreover,the size of microcrystal is extremely close to the calculation results.Limited by the resolution of the mapping analysis,we found the remaining large particles in the samples for mapping analysis.The clear outline,morphology,and regular elemental distribution demonstrated the microcrystals’integrity as shown in Figs.6(b)–6(g).However,no obvious color patern was observed for Cr element due to the low ion concenration of Cr2+.
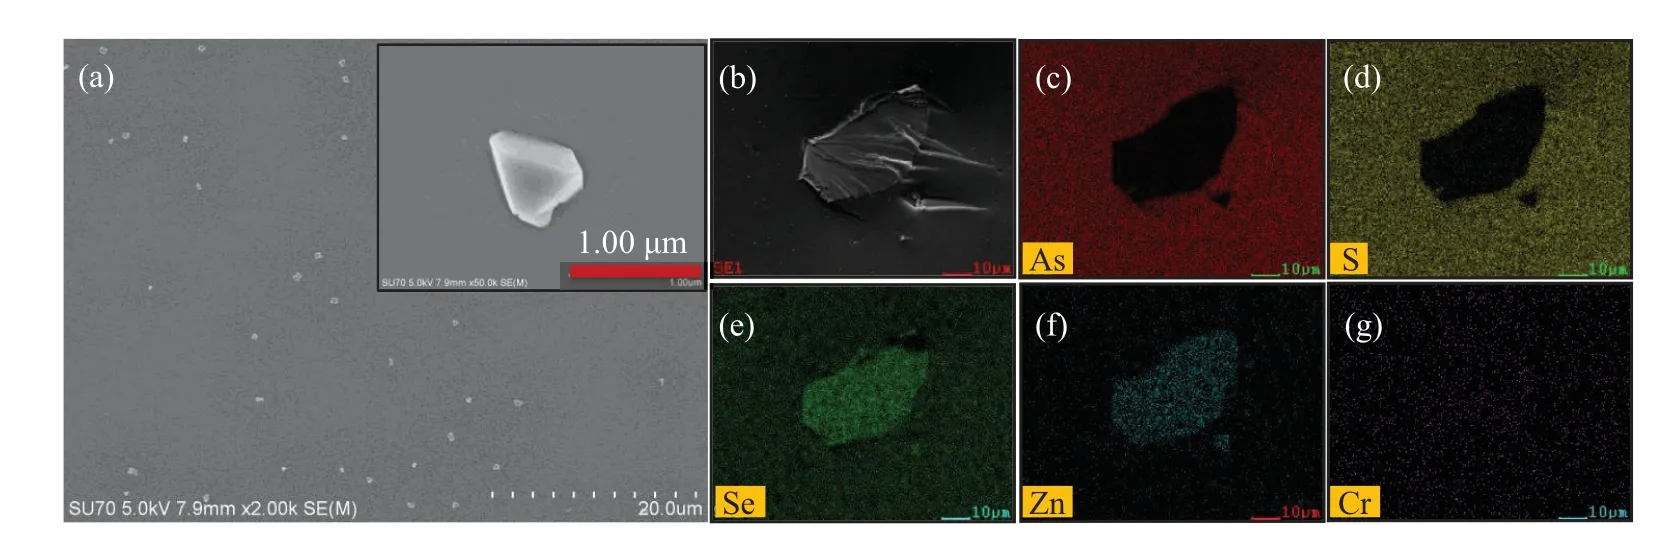
Fig.6.(a)Image of the distribution of microcrystals in the composite glasses.Inset:high-magnification SEM image.(b)Morphology of the microcrystal and element-mapping images of(c)As,(d)S,(e)Se,(f)Zn,and(g)Cr in the x=1 wt%sample prepared by HUP.
Figure 7 presents the distribution and morphology of the microcrystals in the ChGs(prepared by melting)characterized by SEM and EDS.In the non-deposition area,the microcrystals showed a uniform distribution,and most of the microcrystals have a large spacing.But it should be noted that the element mapping images show inconsistencies in element distribution and crystal morphology.The color pattern of As[Fig.7(c)]element matched the SEM image[Fig.7(b)],while S[Fig.7(d)]element appeared to penetrate into the Cr2+:ZnSe microcrystal.There is no doubt that in the Cr2+:ZnSe crystal,the amount of Zn and Se should be basically the same,or the amount of Se is slightly higher than that of Zn.Actually the color area of Se element[Fig.7(e)]is obviously smaller than that of Zn[Fig.7(f)]element,which indicated that the elemental composition of the Cr2+:ZnSe microcrystals changed.As mentioned above,S elements entered the Cr2+:ZnSe and replaced Se elements.And this substitution reaction caused the precipitated Cr2+:ZnS crystals to cover the Cr2+:ZnSe surface.The formation process of this Cr2+:ZnSencapsulated Cr2+:ZnSe crystal similar to microspheres was described as shown in Fig.8.And this may be a potential method of Cr2+:ZnSe crystal microsphere laser.By the way,these images visually confirmed the XRD analysis.
Fig.7.(a)Image of the distribution of the microcrystals in the composite glasses.Inset:high-magnification SEM image.(b)Morphology of the microcrystal and element-mapping images of(c)As,(d)S,(e)Se,(f)Zn,and(g)Cr from the x=1 wt%sample prepared by melt-quenching.

Fig.8.Schematic diagram of Cr2+:ZnS–Cr2+:ZnSe microsphere model.
IR transparency is critical to the potential applications of glass-ceramic composites in optical fibers and laser gain media.All the composite glasses were polished to a thickness of 2 mm.Figure 9 presents the Vis-to-IR transmission spectra of the composite glasses.The good transparency was attributed to the favorable refractive index matching between the ChGs and embedded Cr2+:ZnSe microcrystals.Composites with uniformly embedded microcrystals also reduce the scattering loss caused by agglomeration.As shown in Fig.9(a),the transmission of the composites prepared by HUP did not significantly decrease as the doping concentration increased.The higher transparency of the x=5 wt% sample at 6µm–8µm indicated that the microcrystal concentration was not the main factor of scattering loss.Light has better passability when the light wavelength is much larger than the size of the obstacle.In this case,the sizes of the microcrystals and their mutual independence become key factors in determining the transparency in the short wavelength region.As shown in Fig.9(b),the transparency of the composites prepared by melting with a microcrystal concentration of only 1 wt%seriously declined due to the refractive index mismatch of the precipitated ZnS grains and crystallite deposition behavior.Combined with EDS analysis,after the substitution reaction of S and Se on the surface of Cr2+:ZnSe crystal grains,the agglomeration of ZnS and ZnSe crystal grains caused additional Rayleigh dispersion.
Figure 10 presents the MIR fluorescence spectra of the composites prepared by HUP and melt-quenching,respectively.As expected,an ultrabroad Cr2+ion emission band between 1.8µm and 3.1µm from the HUP composites was observed at RT[Fig.10(a)].The luminous intensity increased as the concentration of Cr2+:ZnSe microcrystals increased.No obvious hydroxyl absorption was observed at 2.7µm.Benefitting from the uniform distribution of Cr2+:ZnSe microcrystals,composites have a higher doping concentration,stronger fluorescence intensity,and wider emission band.This is quite attractive for ultrashort pulse lasers and broad MIR tunable lasers.As previously mentioned,part of the Cr2+:ZnSe may have been replaced by Cr2+:ZnS in the composites prepared by melt-quenching.The emission peak of the Cr2+:ZnS was slightly shorter than that of the Cr2+:ZnSe,which was reflected in the emission peak of the molten samples as shown in Fig.10(b).The composites’strongest emission peak was observed at 2353 nm,which was quite close to the num 2 crystal sample’s emission peak,and their spectral shapes were very similar.We speculate that the emission peak observed at 2262 nm was contributed by the precipitated Cr2+:ZnS crystals.The superposed photoluminescence of these two crystals caused this spectrum,and this was also observed in the x=0.5 wt%samples.

Fig.9.(a)Vis-to-IR transmission spectra of the xCr2+:ZnSe/(1−x)As40S57Se3 composite glasses(x=1,3,and 5 wt%)prepared by HUP.(b)Vis-to-IR transmission spectra of the x=0.5 wt%and x=1 wt%samples prepared by melt-quenching.
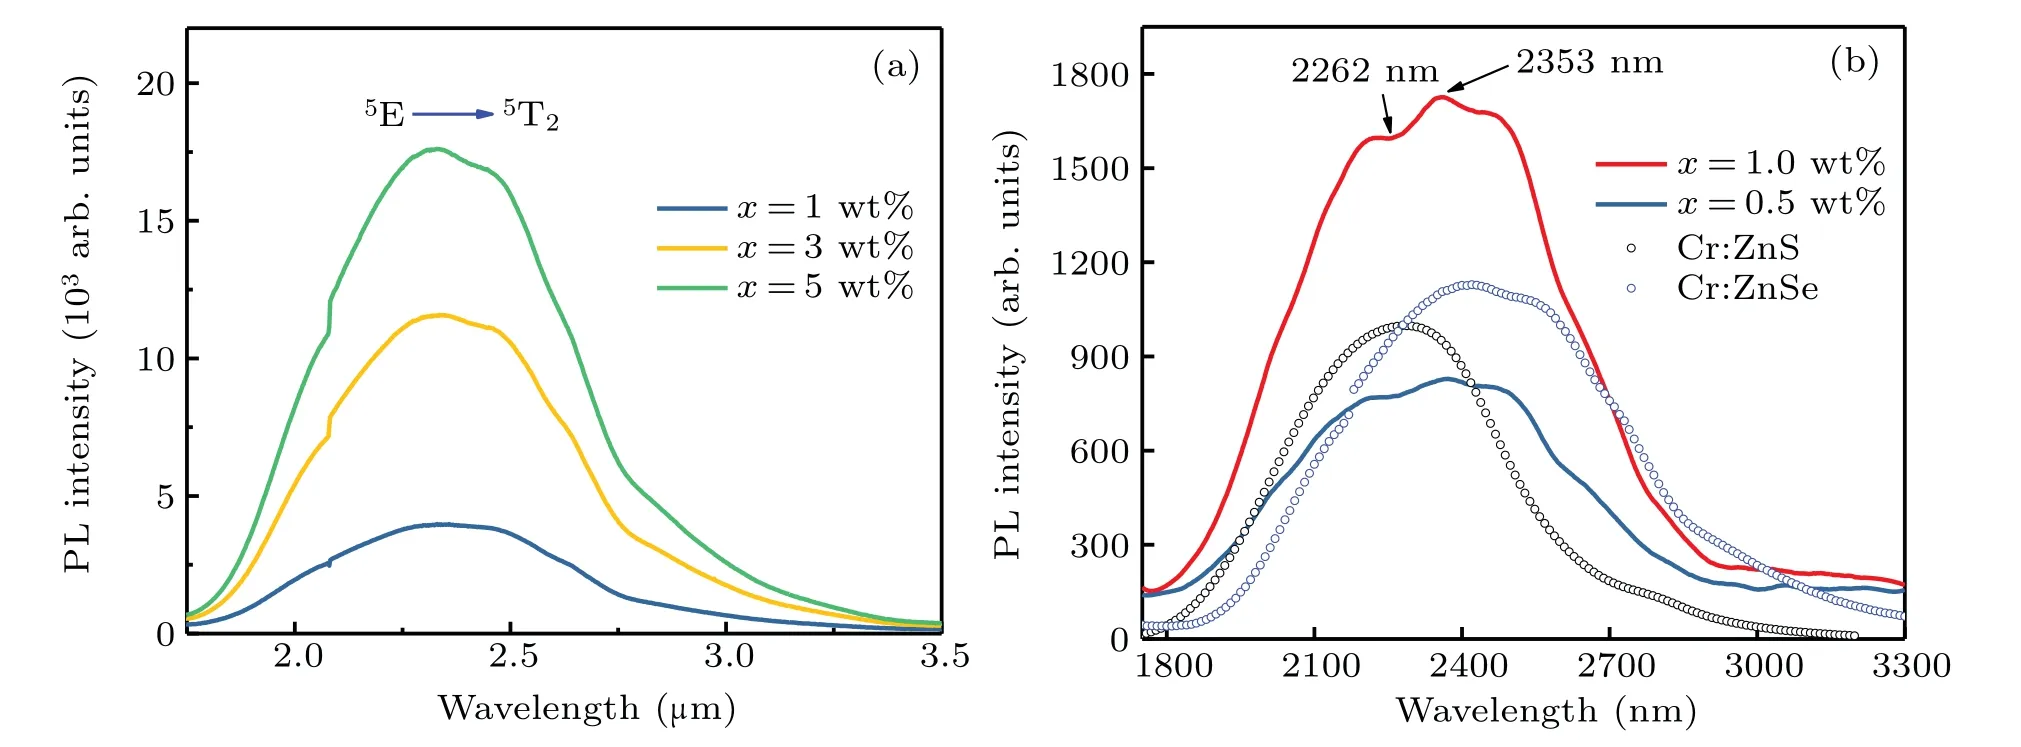
Fig.10.(a)MIR fluorescence spectra of the xCr2+:ZnSe/(1−x)As40S57Se3 composite glasses(x=1,3,and 5 wt%)prepared by HUP.(b)MIR fluorescence spectra of the x=0.5 wt%and x=1 wt%samples prepared by melt-quenching.
4.Conclusions
In summary,ChGs containing Cr2+:ZnSe microcrystals were fabricated by HUP and melt-quenching,respectively.Ultrabroadband 1.8µm–3.1µm MIR emission was observed at RT after excitation by a commercially available 1550-nm LD.The fluorescence emission band of the composites prepared by HUP was quite similar to that of the original Cr2+:ZnSe,and its emission band was wider than that of the melted composites.Owing to the more uniform microcrystalline doping distribution,favorable infrared transparency was observed in the composites prepared by HUP.The melt-quenching method is easy to prepare optical fiber preforms,but the samples’transparency severely declined due to the precipitation of ZnS and the uneven distribution of the microcrystals.Comparing the results of these two methods provides valuable experience and a reliable technique to prepare Cr2+:ZnSe-chalcogenide fibers for fiber laser applications.

- Chinese Physics B的其它文章
- Multiple solutions and hysteresis in the flows driven by surface with antisymmetric velocity profile∗
- Magnetization relaxation of uniaxial anisotropic ferromagnetic particles with linear reaction dynamics driven by DC/AC magnetic field∗
- Influences of spin–orbit interaction on quantum speed limit and entanglement of spin qubits in coupled quantum dots
- Quantum multicast schemes of different quantum states via non-maximally entangled channels with multiparty involvement∗
- Magnetic and electronic properties of two-dimensional metal-organic frameworks TM3(C2NH)12*
- Preparation of a two-state mixture of ultracold fermionic atoms with balanced population subject to the unstable magnetic field∗