
Temperature effects of GaAs/Al0.45Ga0.55As superlattices on chaotic oscillation∗
2021-10-28 07:02XiaoPengLuo罗晓朋YanFeiLiu刘延飞DongDongYang杨东东ChengChen陈诚XiuJianLi李修建andJiePanYing应杰攀
Chinese Physics B 2021年10期
Xiao-Peng Luo(罗晓朋) Yan-Fei Liu(刘延飞) Dong-Dong Yang(杨东东)Cheng Chen(陈诚) Xiu-Jian Li(李修建) and Jie-Pan Ying(应杰攀)
1Department of Basic Courses,Rocket Force University of Engineering,Xi’an 710025,China
2College of Liberal Arts and Sciences,National University of Defense Technology,Changsha 410073,China
3Suzhou Institute of Nano-tech and Nano-bionics,Chinese Academy of Sciences,Suzhou 215123,China
Keywords: superlattices,chaotic oscillation,temperature,randomness
1. Introduction
Since Esaki and Tsu proposed the concept of superlattices(SLs)with artificial periodic structure,[1]SLs generating microwave oscillations at the tens of GHz level have become hotspots in many fields. Subsequently, properties and phenomena such as quantum effects,[2]negative differential conductivity (NDC)[3]and two-dimensional electron gas[4]were verified. In 1995, Ashkenazyet al.[5]analyzed the chaotic behavior caused by resonant tunneling under the quantum mechanical processes and found that the SLs system would enter a chaotic oscillation state at a certain bias voltage. In 1996, Zhanget al.[6]verified the phenomenon of spontaneous chaotic oscillation of current by adjusting the DC bias of SLs, which can be used as an entropy source to generate high-speed true random numbers (TRN). However, such nonlinear phenomena were observed and studied in a liquid nitrogen environment, which greatly limited the applications of the SLs devices. Until 2012, spontaneous chaotic oscillations and synchronization between devices were observed in GaAs/Al0.45Ga0.55As doped weakly coupled SLs at room temperature.[7,8]Based on the above theory and research into chaotic oscillations,the following two new cryptographic techniques of SLs have been constructed. First, SLs can be used as an ideal physical entropy source to generate TRN for secret keys,with an off-line rate up to 80 Gbit/s[9]and a realtime rate up to 8 Gbit/s.[10]Second, matching SLs can perform synchronous secure key distribution and communication based on distribution of TRN,[11,12]even if there is an arbitrarily large physical distance between the SLs.
However,stability is the key issue of the practical process,and is lacking in related research. In practice, due to imperfections in the equipment and other factors, the ambient temperature of SLs is not constant, which will directly affect the randomness of the output sequence and even fail the safety requirements. Herein,SLs under different temperatures will be analyzed. The impact of temperature change on chaos oscillation in SLs voltage is summarized by NIST test and variation of minimum entropy, and the temperature influence is given with electron transport mechanism explanation of the chaotic oscillation. The results will fill in gaps in the research into the temperature stability of SLs.
2. Experiment on chaotic oscillation with changing temperature
2.1. Structure of GaAs/Al0.45Ga0.55As SLs
The sample, i.e., the semiconductor diode is based on GaAs/Al0.45Ga0.55As SLs,with a 50-cycle doped weakly coupled structure as shown in Fig. 1. The growth process is as follows: the GaAs layers doped with Si are grown on a n+type GaAs substrate, then a 50-period GaAs/Al0.45Ga0.55As SLs, in which a 7-nm GaAs layer forms the potential well,and each quantum well is doped with Si; the potential barrier layer is composed of a 4-nm Al0.45Ga0.55As. To prevent the Si from diffusing into the adjacent Al0.45Ga0.55As well after excitation,undoped GaAs isolation layers are grown on both sides of the Si-doped GaAs substrate.[6]At the top of the SLs there are three thin layers of GaAs doped with Si. This structure forms a n+–n–n+diode type, and more detailed construction can be found in Ref.[7].
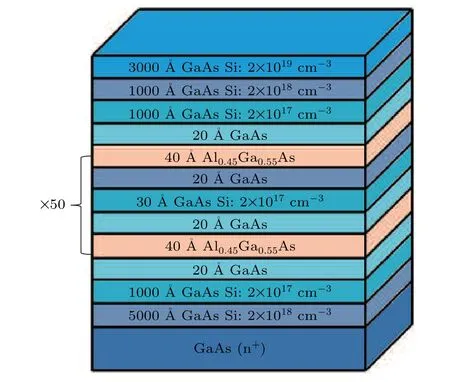
Fig.1. Growing structure of the GaAs/Al0.45Ga0.55As SLs.
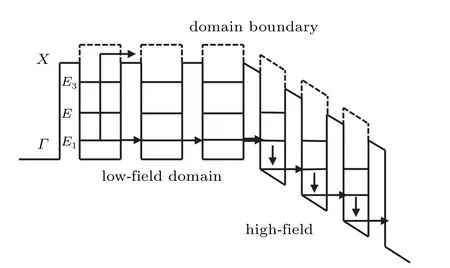
Fig.2. Vertical transport modes of GaAs/Al0.45Ga0.55As. Thermionic emission suppressed by barrier height,electrons transported by the microband in low-field domain, transport of domain boundaries is NRT,SRT is the transportation at high-field domain.
The vertical transport modes of the SLs mainly include miniband transport, tunneling of multiple quantum wells and thermionic emission.[13]As shown in Fig. 2, the tunneling transport can be subdivided into sequential resonant tunneling(SRT)and non-resonant tunneling(NRT),and usually the nonlinear features are caused by SRT of electrons.[14]The electrons in the weakly coupled SLs originate from the conduction band of the GaAs well, located in the ground state, and tunnel through theΓvalley to theXvalley ground state of the Al0.45Ga0.55As potential barrier, then rapidly relax from the potential barrier layer to the first excited state of the valley to the next GaAs through a very fast real space. Completely losing its phase information, an NDC will occur when the electrons tunnel fromEn1toEn+12.[15]Due to the existence of multiple bound state energy levels within the quantum well, the NDC interval can be generated. In general,the electric field is not uniformly distributed,which results in high and low electric field domains.[16]The high electric field domains maintain the SRT among the multiple wells,while the low electric field domains maintain individual quantum well energy and fundamental alignment. The electrons pass through the domain boundaries as NRT.[17]In the NDC interval,the superposition of two independent main frequency oscillations will perform inside the weakly coupled SLs. As the bias voltage reaches an appropriate value,the SLs will enter a chaotic oscillation state when the frequency and amplitude of these two oscillations satisfy certain conditions.
2.2. Experimental scheme
According to the principle of generating spontaneous chaotic oscillations in GaAs/Al0.45Ga0.55As at room temperature, the experimental circuit design is shown in Fig.3. For the narrow voltage interval of chaotic oscillations in SLs[18]and influence by temperature, the bias voltage requirement is high. In this paper, the bias of the SLs is regulated in real time using a highaccuracy power supply (HAPS) of Keithley 2280S. To improve the purity of the supply, the DC voltage needs to be passed through a bias tee (BT) first.[19]The entire spontaneous chaotic oscillation system is connected by an SAM coaxial cable with bandwidth of 6 GHz, and a coaxial load of 50 Ω is matched for grounding. The ambient temperature of the SLs is regulated by a temperature and humidity chamber (THC). The signal is connected to a Lecroy-HDO-9404 oscilloscope for high-precision observation and accurate analysis of the signal.
The signal generated by the SLs experimental setup is sampled and quantized using a 12-bit high-speed ADC with a sampling frequency of 2 GHz,and the output sequence can be obtained by post-processing;see inset in Fig.3. The 8 bits are extracted as least significant bits(LSB)[20]in the oversized data stream obtained from the 12-bit high-speed ADC. The two 8-bit data of adjacent cycles are spliced into 16-bit for bit reversal and then performing XOR,[10]which can effectively eliminate deviations and correlation with achieving the effect of high-speed real time. Due to the high sampling frequency,2 standard-deviations of the signal amplitude are symmetrically adjusted in the 8-bit range[21]to finally obtain an output sequence with 12 Gbit/s rate.
High-quality random numbers should mathematically satisfy the independent and identical distribution(IID),while theoretically they should have perfect unpredictability. Here,the NIST SP 8–200 international random number test standard is chosen for judging the IID of the sequence. For the unpredictability, information entropy is used in modern random number evaluation models to assess.[22]Therefore,entropy is used to measure the degree of chaos and characterize uncertainty of the sequence.
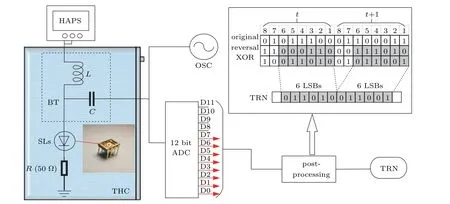
Fig.3.Experimental circuit of chaotic oscillation at different temperature.(HAPS,high accuracy power supply;BT,bias-tee;SLs,superlattices;THC,temperature and humidity hamber; OSC,oscilloscope; ADC,analog digital converter; TRN,true randomness number; post-processing is the sequence processing algorithm inset in the picture;LSB,least significant bits).
3. Analysis of chaotic oscillation at different temperatures
3.1. Analysis of I–V curve
TheI–Vcurve can reflect the vital information of the spatially dynamic electrical distribution of the SLs,which are given in Fig.4 at different temperatures. WhenT ≥90°C,the current oscillation spikes dissipate completely,and the current remains almost constant with the increase of bias voltage in this interval; thus,the characteristic branches of static formation disappear in SLs, while the chaotic oscillations shift remarkably. WhenT<90°C,the curve shifts to the upper left with the increase of temperature,but presents more or less the same pattern. That is,when the voltage reaches about 0.650 V,the current rises to about 5.80 mA, which indicates that the electrons accumulate rapidly. As the voltage increases, the current drops to about 3 mA,then electrons gradually reach the ground-stateE1in the potential well.By continuously increasing the voltage,the current rises smoothly and electrons accumulate in one of the quantum wells. When the applied bias voltage exceeds about 3.225 V, forming an oscillating spike on theI–Vcurve, the charge accumulation layer will instantaneously move to the next adjacent quantum well. When the bias voltage increases in successive scans, the SLs will generate multiple oscillation spikes-so-called multistability.[23]It is worth noting that the presence of current peaks caused by electron SRT in the curve is responsible for the chaotic oscillations. The selection of suitable bias values within the distribution interval of these oscillation spikes will likely trigger the nonlinear chaotic oscillation behavior of SLs. It is assumed that the chaotic oscillation voltage points at different temperatures are variant. Curves show that the chaotic oscillation voltage interval decreases with increasing temperature and will not provide nonlinear behavior when the temperature exceeds a certain threshold. This will have an impact on the generated signal and output sequence.
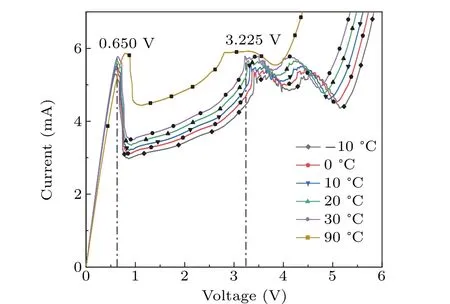
Fig.4. The I–V curves of the GaAs/Al0.45Ga0.55As SLs at different temperature. Electrons accumulate at the bias about 0.650 V and current peaks will appear at the bias about 3.225 V.When T ≥90 °C,the current peaks will remarkably shift.
3.2. Analysis of signal and the randomness of sequence
In order to observe the effect of temperature factors more intuitively,the bias voltage is selected as 3.455 V,and the ambient temperature is adjusted to 10°C, 20°C, and 30°C respectively,to obtain the signal diagram and the corresponding power spectrum under various temperatures. In Figs.5(a)and 5(c),although the amplitudes are slightly different,the shapes remain basically the same and can be considered as periodlike signals. The power spectrum shows a peak at the higher harmonics,which exhibits the characteristics of an apparently non-sinusoidal periodic signal. In Fig. 5(b), there is no obvious pattern of signal amplitude variation with time,and the corresponding power spectrum shows a slow and wide spectrum without high harmonics,which is a typical non-periodic signal characteristic.
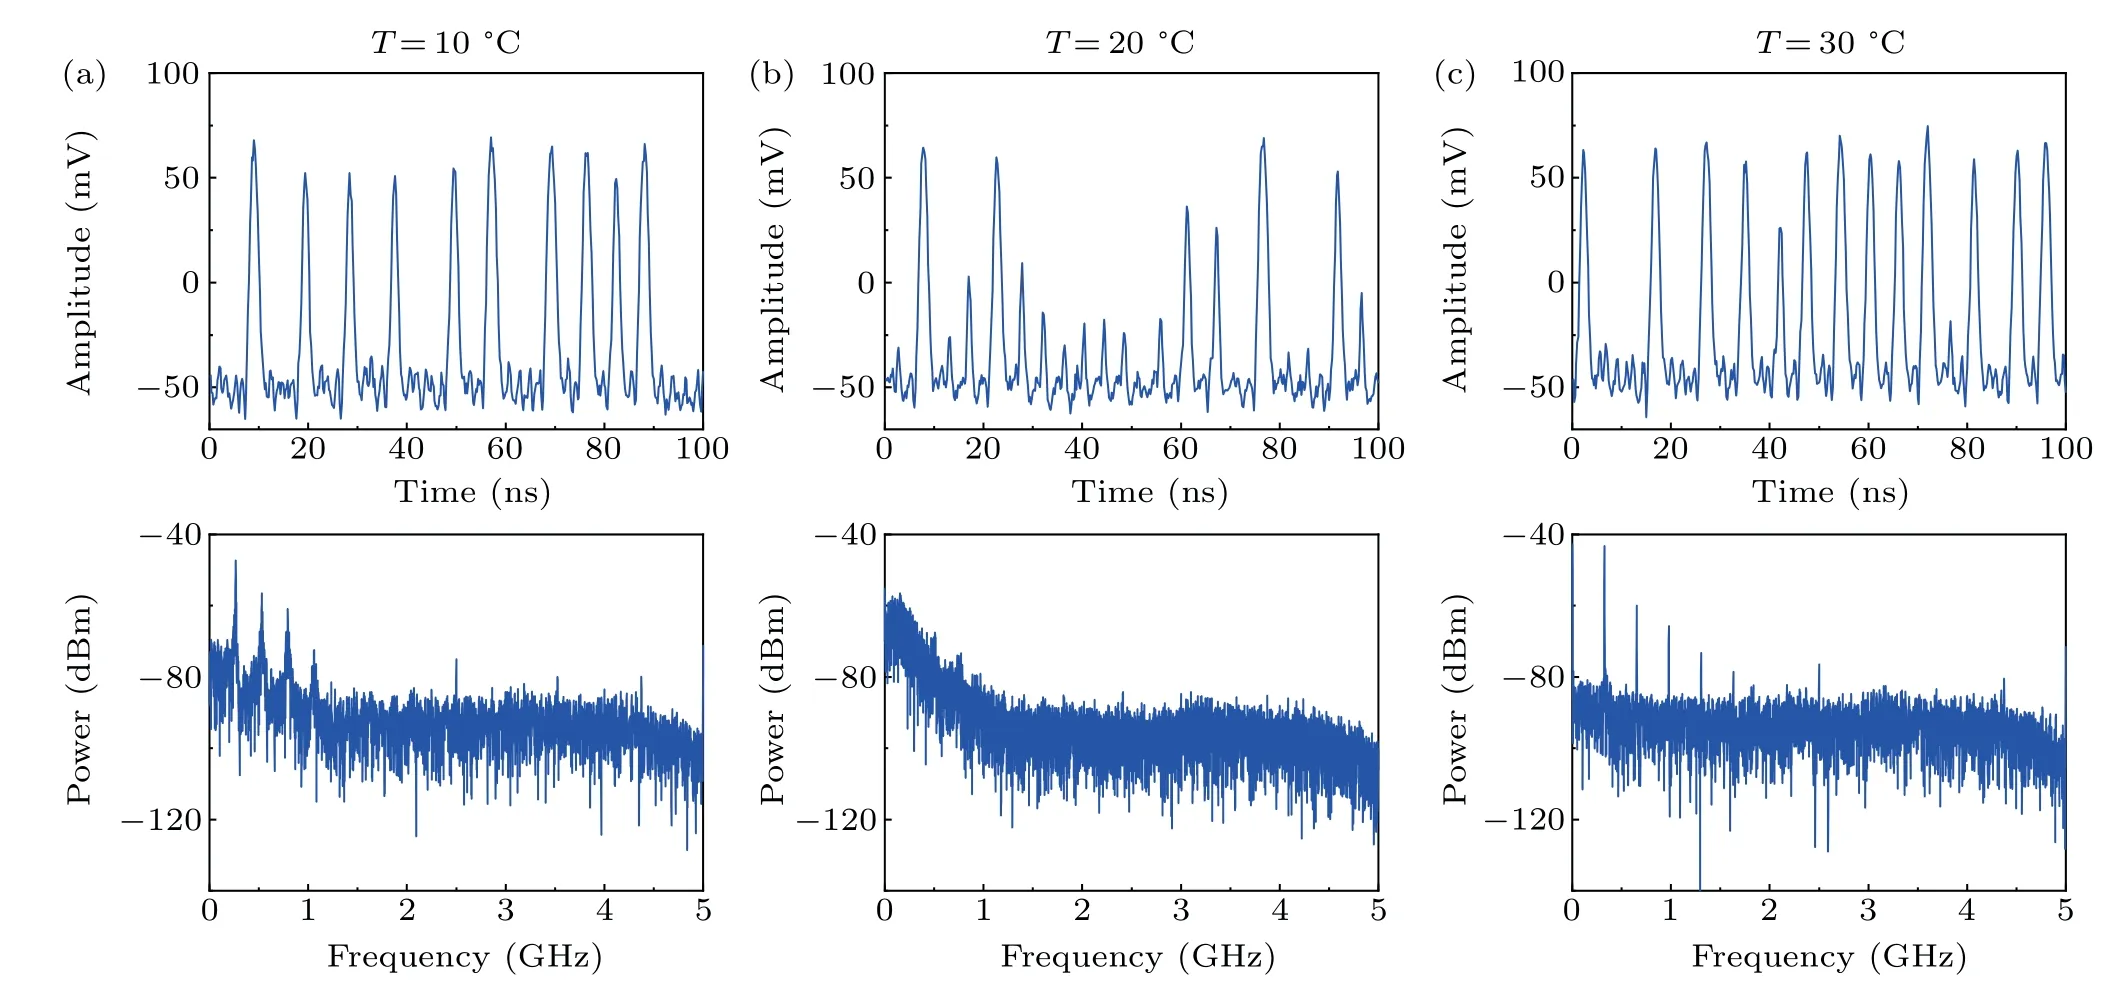
Fig.5. Temporal waveform and power spectrum of current through SLs for different temperature at 3.455 V.(a)T =10 °C;(b)T =20 °C;(c)T =30 °C.Panels(a)and(c)show the periodic like signal,(b)exhibits non-periodic.
The SL signal is sampled by ADC and quantized by post-processing to output sequences. Significantly, the postprocessing enhances the random bait sequence by lowering the statistical bias while not introducing any additional correlations.[24]To quantify the correlation of the sequence obtained at the above three temperatures, the first-order correlation coefficient[25,26]described asρ(N) was expected in Fig. 6 with 1 Gbit data from SLs, which obeys the Gaussian distribution of the standard deviationσequaling to(N−1/2)/2.[27]From hypothesis test, the probability of three standard deviations is 99.7%.[26,28]AtT=10°C and 30°C,the absolute value of correlation coefficient fluctuates above and below the ideal curve, which exceeded the 3σ. WhenT=20°C,|ρ(N)|is always below the 3/N−1/2. For this result,it can be concluded that the SL signal is not periodically correlated at 20°C;however,the signals at other temperatures are more correlated, which corresponds to the conclusion of Fig.5.
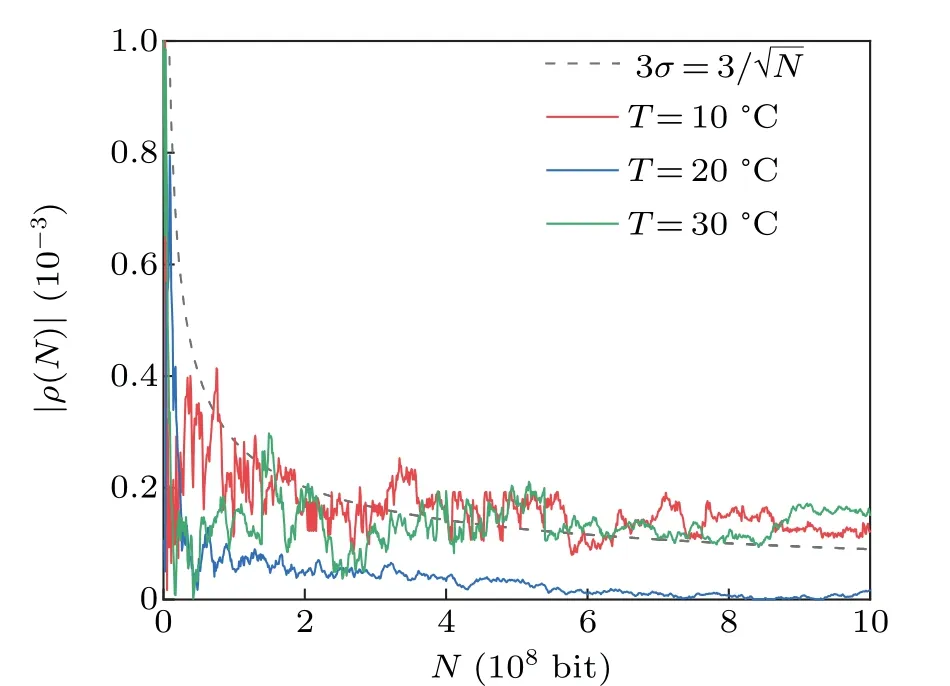
Fig. 6. The 3σ criterion of the first-order autocorrelation coefficient sequences|ρ(N)|at different temperatures with 1Gbit data from SLs. The bias voltage is 3.455 V.
NIST including 15 individual modules is also tested. It is considered to pass the corresponding module when thePvalue>0.01,and to fail once one of them has not passed.[29]To construct a large sample space,the sequences at each temperature were divided into 1000 groups in the length of 1 Mbit,which results are shown in Table 1. Obtained at 3.455 V and 20°C,the sequences passed the test successfully and met the TRN requirement. The sequences at the rest of the temperatures did not fully pass the test. At this bias, the entropy calculation was performed for the output sequences at each temperature(−30°C to 80°C).
In order to estimate the entropy of sequence reasonably,the concept of minimum entropy is introduced,which is a generalized function of the probability density.[30]When the probability distribution of the random variable is infinitely close to the uniform distribution, the value obtained is more valid. In this paper, the ratio of the sequence entropy value to the effective bit width is defined as the entropy width ratio(EWR),which is used to intuitively represent the entropy size of each bit sequence, as shown in Fig. 7. At 20°C, the SL enters a chaotic oscillation state at a bias voltage of 3.455 V with EWR=97.69%,at which time the output sequence entropy is more adequate and the randomness is better. Combined with the signal and randomness analysis, this voltage value is defined as the optimal operating point (OOP) of SLs. Except for 20°C,the EWR at the rest of the temperatures is less than 55%.It indicates that the entropy value of the sequence is seriously insufficient and the randomness is poor. Analysis of the entropy values and the NIST directly show that temperature is an important factor for determining the chaotic oscillation.
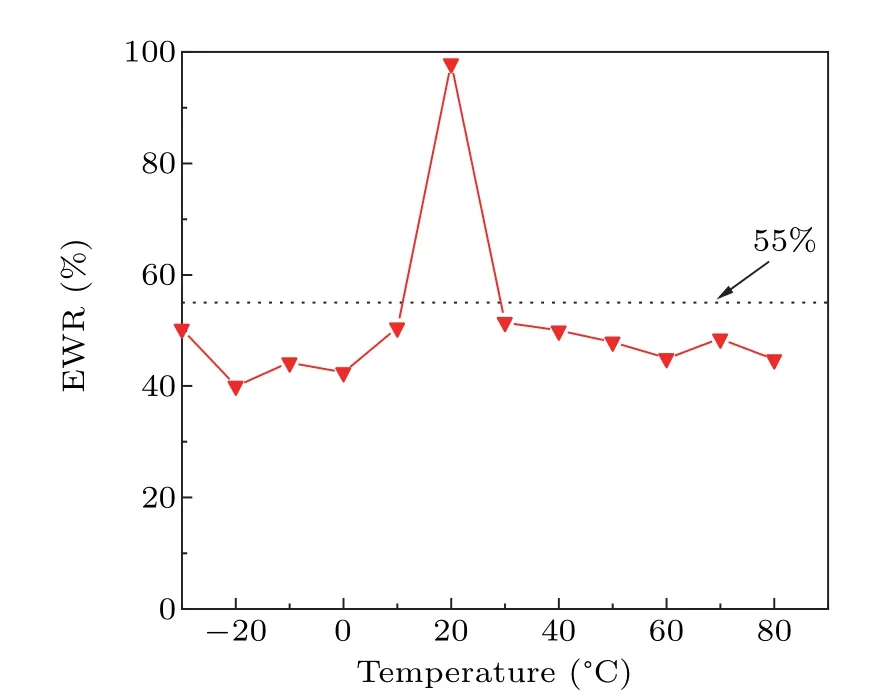
Fig.7. The entropy width ratio of the sequence for different temperatures at bias voltage determined that 3.455 V.When T =20 °C,the EWR=97.69%.At other temperatures,the EWR is under 55%.
In the previous section, it was speculated that there are different voltages for chaotic oscillations of SLs at various temperatures. In other words, the bias changed by the temperature that excites chaotic oscillations exists within a certain threshold. For the SLs at different ambient temperatures, the OOP can be selected within its corresponding NDC interval,with a view to the emergence of spontaneous chaotic oscillations. It is found that the signal at this time shows the irregularity of oscillations, which suggests that the characteristics of a nonperiodic signal, the diagram and power spectrum are similar to Fig.5(b). This multistable nonlinear behavior is exhibited in all practical measurements from the temperature interval of−30°C to 80°C(as in Fig.4). After quantization,all the obtained sequences pass the NIST test. Different temperatures all correspond to a suitable bias that can cause chaotic oscillations in the SLs.The EWR at the OOP is given in Fig.8,which are all greater than 90%. The entropy of the sequence is more than adequate and consistent with unpredictability. This means that the SLs can maintain the OOP over a wide temperature interval and the stochastic performance well. Experimental proofs for the speculative conclusions are given in full agreement.

Fig.8. The entropy width of the sequence for different temperatures at OOP.The EWR is more than 90%.
3.3. NIST test
To investigate the relationship between temperature and the OOP, experimental data can be fitted for the NIST test.The electron transport as well as the variation of the potential field makes the model more chaotic and often requires complex parameters to be involved.[31]Considering the small sample,seven common computational methods were selected.The evaluation index was used to calculate and evaluate the goodness.[32]The sum of squared errors(SSE)represents the error between the fitted data and the original data. The root mean square error (RMSE) represents the standard deviation of the fit. When the SSE and RMSE are closer to‘0’,the data prediction will be better. R-sq is the coefficient of determination, which portrays a good or bad fit by variation on the data. Adj-R-sq is the adjusted R-sq,which is used to penalize the non-significant variables.When the R-sq and Adj-R-sq are closer to 1,the effect of the variables is obvious.[33]
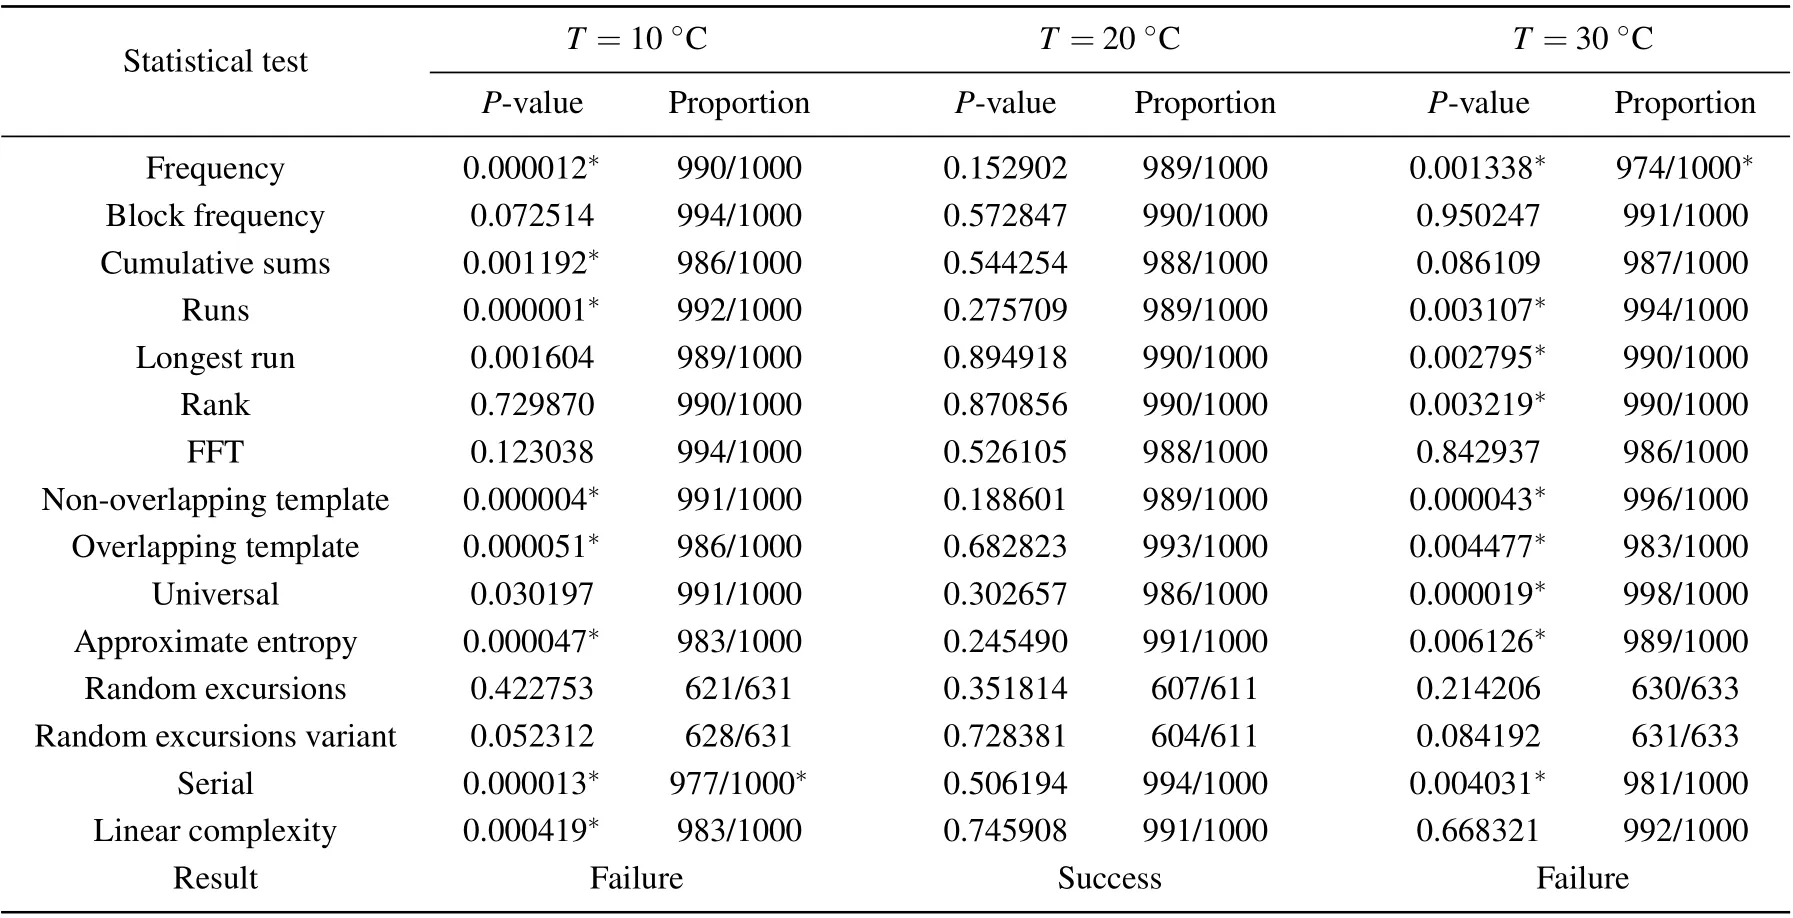
Table 1. Result of NIST test at V =3.455 V with different temperatures.
Table 2 shows the goodness of fit for the seven models.According to the evaluation index,we believe the Fourier fit is closer to the actual relationship. As in Fig. 9, the black dots are the original data, and the blue polyline is the relationship between the temperature and the OOP after fitting. There is a one-versus-one correspondence on the ambient temperature and the OOP from Fig. 9. As the temperature increases, the fitting curve shows that the SLs generate a chaotic oscillation working voltage point to shift and perform a decreasing trend.Once the voltage changes with the temperature, this will directly lead to the change of the randomness of sequence at an OOP.The non-sinusoidal periodic characteristics of the signal are obvious(Figs.5(a)and 5(c)),the entropy value decreases sharply (Fig. 7), which cannot pass the corresponding NIST test. Therefore,temperature variations are highly likely to affect the randomness of the SL generation sequence. There are corresponding OOP at different operating temperatures,when the signals show irregular oscillations(Fig.5(b)),the entropy values are more adequate (Fig. 8), and the output sequences can pass the NIST tests. The fitted curve verifies the experimental conjecture, which also gives an idea to solve the bad effect of temperature.
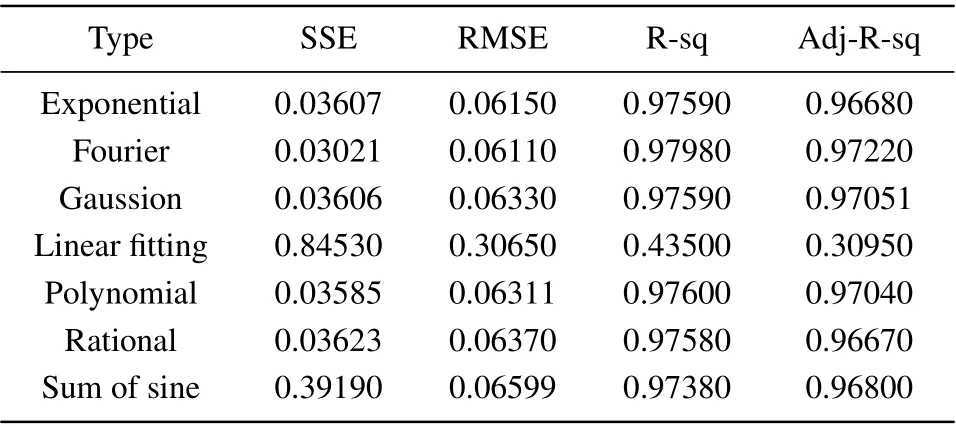
Table 2. Comparison of goodness for fit in different models.
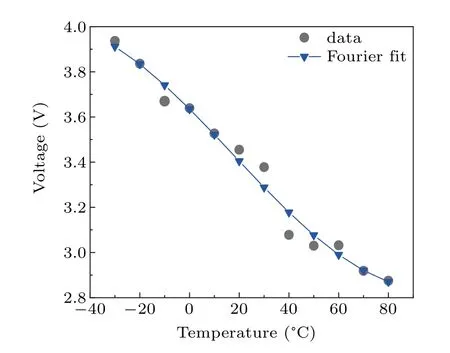
Fig. 9. The fitting curve of temperature and the optimal operating point of SLs. The blue curve is the fitting result,and the black points are the original.
4. Discussion
SLs are electronic devices with quantum effects. When the temperature increases, deformations of the high and low field domains are formed. This is reflected by the weakening of the electric field in the high field domains and the decrease in the difference between the voltage strengths of the high and low field domains. It is found that the number of phonons is proportional to the temperature, which can be approximated bykT/(ħω).[34]With the temperature increasing,the number of phonons will raise,which leads to frequent interactions between phonons,ionized impurities and phonons increasing the chances of phonon-assisted tunneling.[35]However, transport of domain boundaries is NRT, which is achieved by phononassisted tunneling. The dependence of the electron drift velocity and electric field then changes,when it will be simpler to accumulate charge at domain boundaries. The conditions required for SRT in high-field domains will be easier, and the value of the bias required for excitation is reduced if the SLs can enter a chaotic oscillatory state. This explains well the conclusion that the optimal operating point of the SLs decreases with increasing temperature in the above experiments.In addition, the thinner Al0.45Ga0.55As potential barrier layer will be helpful for electron tunneling, which can effectively increase the chaotic bandwidth. When the temperature continues to increase,the current oscillation spikes in theI–Vcurve will gradually weaken or even disappear, and the SLs cannot enter the chaotic oscillation state,which is due to the fact that the number of phonons rise with the increase of temperature and the phonon modes are gradually shifted to the lower frequencies,which will increase the scattering probability of the longitudinal phonon waves.[36]The scattering of longitudinal acoustic waves by the electrons causes a sparse distribution and the width of the energy level of the semiconductor device to widen or shrink.[37]The result is that theΓ–XSRT mode fails to provide nonlinear behavior.
5. Conclusion
GaAs/Al0.45Ga0.55As-doped weakly coupled SLs can be used as a physical entropy source of TRN.However,the temperature is the key element for the stable application of SLs cryptography, whose variation is the most obvious and drastic. Meanwhile,the best working voltage point of chaotic oscillation can be found at different temperatures, and the entropy value is more adequate to pass the NIST test. When the temperature is higher than room temperature, the energy level distribution of the SLs will be adjusted and will not provide nonlinear characters. This is a meaningful phenomenon for applications at room temperature. After effective fitting,it is found that the temperature is inversely proportional to the OOP,which is due to the change of the dynamic stability of the field domains when the temperature increases. It is expected that the adverse effect of temperature on the chaotic oscillations can be eliminated by adjusting the ambient temperature or finding the optimal operating point. The results fill the gap in the qualitative study of SL temperature stability, and find the relationship between the OOP and temperature,which can promote further applications of SL codes.
Acknowledgment
The authors would like to thank Prof. Y. Zhang from SuZhou Nanometer Institute of Chinese Academy of Sciences for SL devices and useful discussions.
猜你喜欢
中学生数理化·七年级数学人教版(2022年5期)2022-06-05
中学生数理化·七年级数学人教版(2022年6期)2022-06-05
当代党员(2022年9期)2022-05-20
中学生数理化·七年级数学人教版(2022年4期)2022-04-26
中学生数理化·七年级数学人教版(2021年6期)2021-11-22
中学生数理化·七年级数学人教版(2021年5期)2021-11-22
中学生数理化·七年级数学人教版(2021年4期)2021-07-22
童话王国·文学大师班(2020年4期)2020-04-27
艺术家(2017年9期)2017-05-20
小学生作文·小学低年级适用(2016年7期)2017-01-16
- Chinese Physics B的其它文章
- Physical properties of relativistic electron beam during long-range propagation in space plasma environment∗
- High winding number of topological phase in non-unitary periodic quantum walk∗
- Widely tunable single-photon source with high spectral-purity from telecom wavelength to mid-infrared wavelength based on MgO:PPLN∗
- Control of firing activities in thermosensitive neuron by activating excitatory autapse∗
- Adaptive synchronization of chaotic systems with less measurement and actuation∗
- Dynamics analysis of a 5-dimensional hyperchaotic system with conservative flows under perturbation∗