
Observation of coherent mode induced by a molybdenum dust on EAST
2021-11-30 08:28FeifeiLONG龙飞飞TaoZHANG张涛TingfengMING明廷凤LingZHANG张凌TengfeiTANG唐腾飞XiudaYANG杨秀达JianhuaYANG杨建华HaiqingLIU刘海庆SongtaoMAO毛松涛HailinZHAO赵海林YanminDUAN段艳敏YingjieCHEN陈颖杰MuquanWU吴木泉KaixuanYE叶凯萱XiangZHU朱翔GuozhongDENG邓国忠Shao
Plasma Science and Technology 2021年11期
Feifei LONG (龙飞飞), Tao ZHANG (张涛), Tingfeng MING, (明廷凤),Ling ZHANG (张凌), Tengfei TANG (唐腾飞), Xiuda YANG (杨秀达),Jianhua YANG (杨建华), Haiqing LIU (刘海庆), Songtao MAO (毛松涛),Hailin ZHAO (赵海林), Yanmin DUAN (段艳敏), Yingjie CHEN (陈颖杰),Muquan WU (吴木泉), Kaixuan YE (叶凯萱), Xiang ZHU (朱翔),Guozhong DENG(邓国忠),Shaocheng LIU(刘少承),Yumin WANG(王嵎民),4,Xiaoju LIU(刘晓菊),Long ZENG(曾龙),Liang WANG(王亮),Qing ZANG(臧庆),Yuanxi WAN(万元熙)2,,Xiang GAO(高翔), and EASTTeam
1 College of Physics and Optoelectronic Engineering, Shenzhen University, Shenzhen 518060, Peopleʼs Republic of China
2 Advanced Energy Research Center,Shenzhen University,Shenzhen 518060,Peopleʼs Republic of China
3 Institute of Plasma Physics, Chinese Academic Sciences, Hefei 230031, Peopleʼs Republic of China
4 Hebei Key Laboratory of Compact Fusion, ENN Science and Technology Development Co., Ltd.,Langfang 065001, Peopleʼs Republic of China
Abstract The influence of a molybdenum dust buildup on plasma edge turbulence has been studied in the EAST tokamak.The motion of the dust from the upper divertor region is detected by a fast visible CCD camera, the XUV spectrometer arrays, and the EUV spectrometer.The MoXV emission intensity sharply increases compared with the spectral lines of various ionization states of other elements, which implies that the dust particles are the molybdenum impurities.The radial distribution of Mo14+ion simulated by a simplified 1D transport model indicates that the molybdenum dust mainly deposits in the pedestal bottom region.Moreover, it is observed that the coherent mode (CM) appears at ρ=0.94 after the molybdenum impurities enter the main plasma region.The influx of molybdenum impurities results in increasing pedestal electron density and decreasing pedestal electron temperature in contrast to that before the event of impurities dropping.It is also found that the electron density gradient in the pedestal increases when the ablation of the molybdenum impurities is observed in the pedestal region.The qualitative experimental results indicate that the onset of CM is likely related to the increase of the density gradient and edge collisionality in the pedestal.In comparison to the density gradient,the enhancement of CM amplitude largely depends on the increase of the edge collisionality.
Keywords: coherent mode, electron density gradient, edge collisionality, molybdenum dust
1.Introduction
In a future experimental reactor such as ITER,H mode plasma with an steep edge structure named pedestal is required to achieve a high fusion performance.The edge pedestal formation is considered to be linked to microinstabilities or local turbulence induced by the source of free energy which is affected by the steep density gradients, temperature gradients, pressure gradient, and collisionality.In addition to the well-known sources of instability drive, it is also found that the change of the critical gradients induced by the impurity seeding can affect the pedestal dynamics and instabilities [1–4].Therefore,understanding the onset of edge turbulence facilitates the study of particle and impurity transport to sustain high energy confinement.
In recent years, the edge turbulences like quasi-coherent mode (QCM) and coherent mode (CM) are usually observed in the pedestal parameter’s evolution in the tokamaks such as DIII-D[5],Alcator C-Mod[6,7],HL-2A[2,3,8],and EAST[9–13].It is found in the DIII-D tokamak that QCMs with a high frequency of 80-250 kHz are mainly driven by the steep pressure gradient in the high-density region[5].Results from the experiments in Alcator C-Mod state that QCM with a frequency of 50-100 kHz is triggered by the gradient of electron density during ELM-free of EDA-H modes[6]while a different QCM with a frequency of -300 kHz is related to the electron temperature gradient during the inter-ELM periods [7].In HL-2A, the excitation of QCM observed in the pedestal region is regarded as being attributed to a change in density gradient with a frequency range of density fluctuations about 50-100 kHz during inter-ELM and ELM-free periods [8].The experimental results on EAST show that the injection of lithium aerosol into the edge region appears to promote the growth rate of the edge coherent mode(ECM)in the steady-state ELM-free H mode [9].It is revealed that a significant enhancement of the ECM intensity is correlated to the increase of the edge collisionality induced by the real-time lithium injection, which has also been observed in many experiments on EAST[9].It is also found that CM amplitude increases as the edge normalized collisionality increases in the range from 2 to 3, where the pressure gradient has a significant enhancement [10].In addition, the CMs in EAST usually appearing in the pedestal steep-gradient region are experimentally observed in the type-I ELM regime and typically weakened in this grassy ELM regime [11].The coherent structures in the pedestal region like CM or QCM reported on the above tokamaks are believed to enhance particle and impurity transport, which simultaneously plays a vital role in the long-pulse H mode sustainment by driving a significant outward particle and heat flux [9, 13].
Recently, it is found in this study that the behavior change in the CM is associated with the high-Z dust buildup on EAST.Compared with the injection of the laser-blow-off method with Al,Fe,and W seeding in HL-2A[4],the high-Z impurity on EAST causing the behavior change is recognized as a molybdenum dust from the upper divertor captured by a fast visible camera and fast XUV bolometer.Different from the general impurity influx, the ionized molybdenum dust ions have penetrated the scrape-off layer, and finally deposited in the plasma pedestal region within the last closed flux surface.The influx of molybdenum dust has been also found to result in increasing pedestal fluctuation such as the CM,including the electron density and temperature fluctuations.The observation of the CM triggered by the molybdenum dust may be a new finding in comparison with the trigger by an active laser-blow-off impurity seeding in HL-2A which indicates that the excitation of the edge turbulence is also strongly associated with the impurity buildup at the edge [2].
The structure of the paper will be as follows.Section 2 introduces the high-Z impurity buildup and the experimental conditions on EAST.Section 3 shows the behavior change of CM after the influx of impurities during the inter-ELM periods.Section 4 gives a possible mechanism for the enhancement of CM amplitude.Finally, the summary is in section 5.
2.Experimental setup
The EAST tokamak is the first fully superconducting tokamak in China with a flexible divertor configuration and heating scheme, which is equipped with a molybdenum first wall in the main chamber,a lower divertor covered with graphite tiles and an upper divertor covered with an ITER-like watercooled tungsten and copper (W/Cu) monoblock shown in figure 1(a).
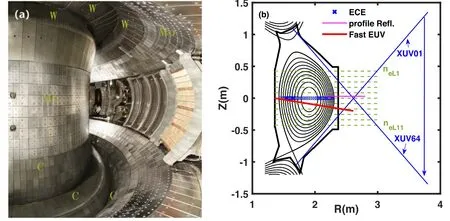
Figure 1.Experimental setup of primary diagnostics for the data analysis.(a)The internal view of EAST with different materials for the lower and upper divertor.(b)A poloidal view of the vital diagnostics for analysis on EAST.The reflectometry for the density profile measurement has a horizontal view of approximately 3 cm above the low field side (LFS) midplane.The central channel of POINT diagnostics,POINT_N6, measures the horizontal line averaged density at Z=0.The ECE measurement for electron temperature located in the plasma with Bt=1.6 T.
There are several essential diagnostics for the measurement of electron density, electron temperature, and plasma radiation on EAST.As shown in figure 1(b), a Polarimeter-Interferometer (POINT) diagnostic has 11 channels, all of which are horizontal to the mid-plane and uniformly distributed from down to up (Z from -42.5 to 42.5 cm) in the same poloidal cross-section.The line-integrated density (neL)from 11-channels POINT will be named from neL1to neL11in this paper,respectively[14].The edge electron density profile on EAST is measured by a fast frequency-sweeping reflectometry (Refl.), which has a horizontal viewing about 3 cm above the low-field side mid-plane [15].A multichannel middle-plane electron cyclotron emission (ECE) diagnostic system has been used to evaluate a relative change of the electron temperature(Te)in the core and edge plasma regions[16].As also shown in figure 1(b), an absolute extreme ultraviolet (EUV) photodiode system can measure the radiation distribution from the upper divertor region to the lower divertor region.The XUV spectrometer after calibration can be used to analyze the radial transport process of the impurities.An EUV spectrometer gives the different emission spectrum of various impurities.A detailed spatial distribution of the viewing chord positions of the four diagnostic systems could be found in [17, 18].The rough distribution and position of these diagnostics are also shown in figure 1(b).
In addition,the lower single null divertor configuration is applied in this campaign shown in figure 1(b).The ion B×∇B drift was directed toward the X-point in the study.
3.Molybdenum dust from upper divertor
Figure 2 shows that the dust ablation occurs when it goes down from the upper inner divertor region covered with W/Cu monoblocks for shot#56934 on EAST.Subsequently,the dust particles are ionized in the scrape-off layer,transport into the main plasma region, and finally diffuse across the magnetic field lines.Due to the restriction of the visible image captured by the CCD camera, the transport process of dust particles can not be recognized in the high-temperature region.Meantime, it is required to clarify whether the dust particles enter into the main plasma region within the last closed flux surface.It is also desired to distinguish the specific sort of dust impurities(high-Z or low-Z)line emission,which can be detected by the EUV spectrometer and the filterscope system.The specific impurities dropping down from the plasma-facing components in EAST can be evaluated using the relative change of line emission intensity emitted from various impurities such as carbon (C) or molybdenum (Mo).As shown in figure 3, the time evolution of the line emission intensity of Mo14+from EUV spectrometer is different to the CIII and LiII line emission from the filterscope system.As seen, after 3.2 s the significant enhancement of MoXV line emission implies the increase of the molybdenum concentrations while CIII and LiII line emission intensities have no much increase after 3.2 s.

Figure 2.Fast camera images of EAST # 56934: (a) t=3.206 s, (b) t=3.214 s, (c) t=3.222 s, (d) t=3.230 s.The process of the dust ablation is captured by the CCD camera with 8 ms temporal resolution.

Figure 3.Time history of the intensity of (a) MoXV (58.83 Å) line emission in EUV spectral region,(b)CIII line emission intensity and(c) LiII line emission intensity for # 56934.
Considering that the typical electron temperature of H mode pedestal area is around 300 eV in EAST, strong emission intensity of MoXV can be expected in the pedestal region [19].In order to verify the estimation, figure 4 gives the radial distribution of Mo14+ion fractional abundance simulated by a simple 1D impurity transport model which is used to estimate the impurity concentration [20].It can be observed that the fractional abundance of Mo14+is very high in the pedestal region.It should be noted that,due to the lack of the pedestal Tefor shot#56934,we use the profile of that in shot#56933 in[16].It should be emphasized that a slight difference in the pedestal profile will make little difference in the radial distribution of Mo14+fractional abundance.Figure 5 shows that the response of the plasma parameters such as the line-averaged density (〈ne6〉 and〈ne1〉) to the dust particles influx events in the two discharges (#56934 and#56935).The plasma currents in both shots #56934 and#56933 are in the counter-clockwise direction seen from the top of the machine while a toroidal magnetic field (Bt) of 1.6 T is in the clockwise direction.The lower hybrid wave(LHW) heating at 4.6 GHz and neutral beam injection (NBI)heating system are applied.The heating power of LHW and NBI are about 2.8 MW and 1 MW for the two discharges,respectively.Before 3.2 s, the plasma parameters are similar,such as the plasma stored energy Wdia,the confinement factor H98,y2and the XUV radiation intensity in the core and edge region between the two discharges.
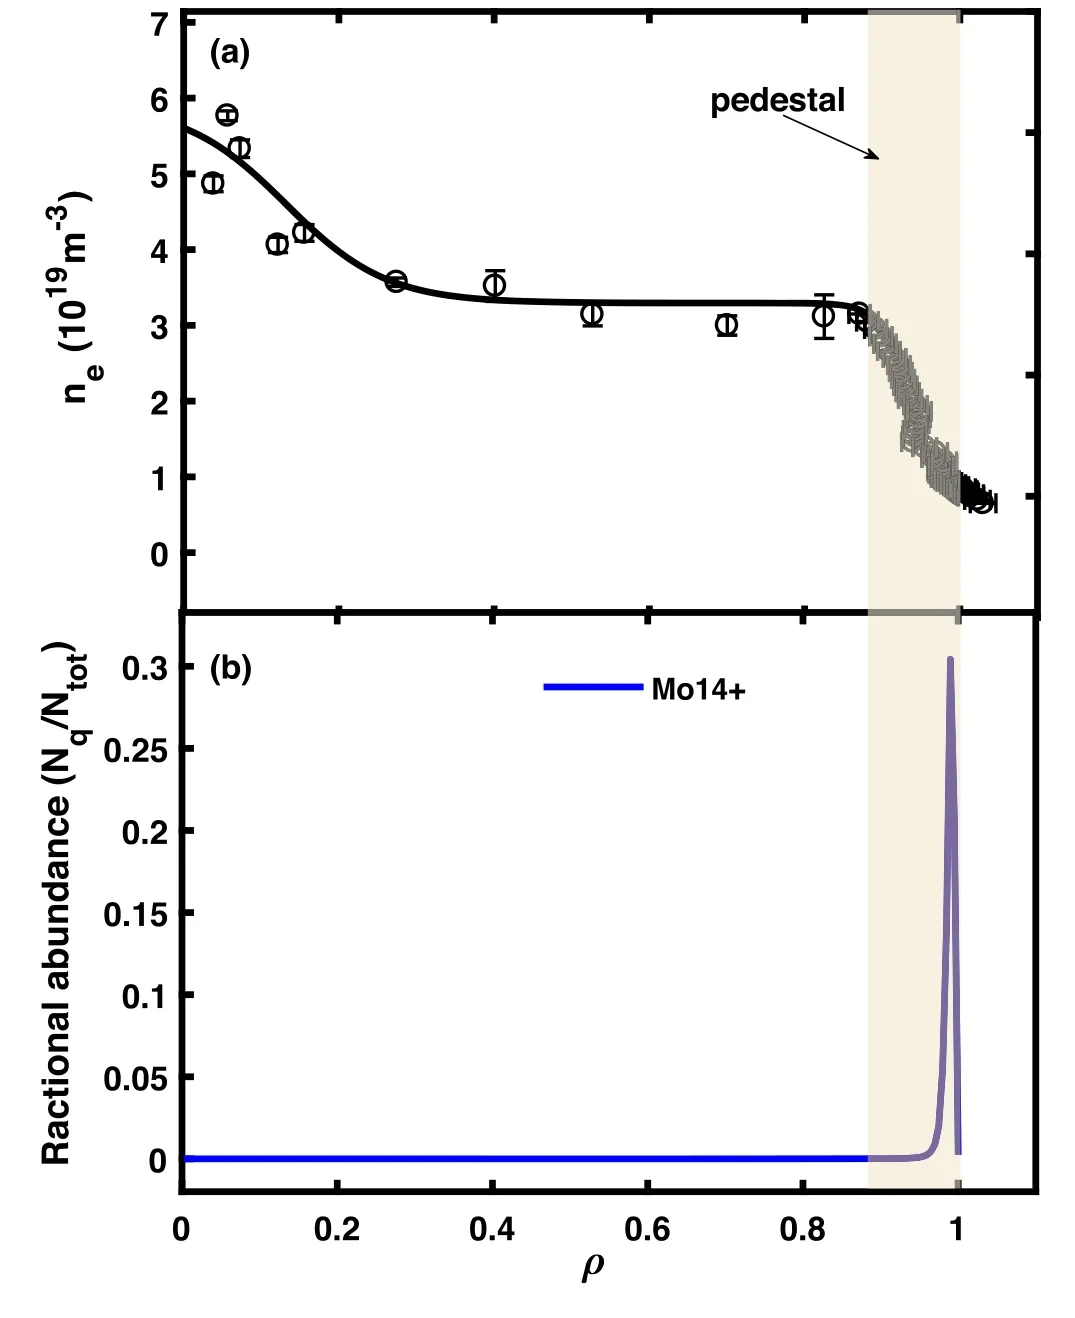
Figure 4.(a) ne profile (t=3.5 s) in which the circle with error bar data are from TS system.A fast frequency-sweeping reflectometry system measures the data in the pedestal.(b) The estimated spatial distribution of Mo14+ for shot # 56934.
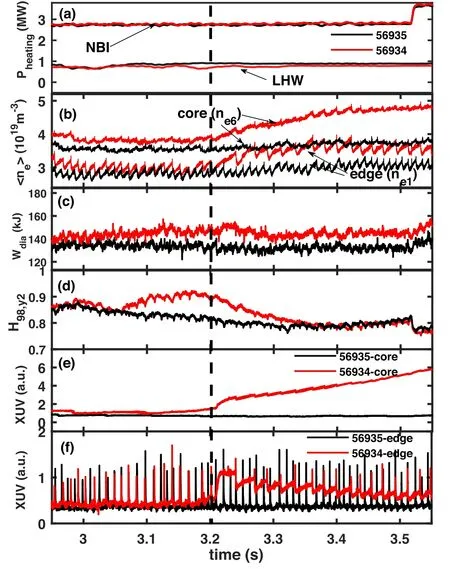
Figure 5.Waveforms of plasma parameters of the two shots#56934 and #56935 with and without impurities falling down from the upper divertor region.(a) The waveform of NBI and LHW heating,(b) the line-averaged density from POINT, (c) the plasma diamagnetic energy Wdia, (d) the confinement factor H98,y2, (e) the core radiation from XUV diagnostic, (f) the edge radiation from XUV diagnostic.
However, after 3.2 s, i.e.the timing of the dust particles influx, there is a clear difference between these plasma parameters shown in figures 5(a)–(f).The line-averaged density(〈ne6〉 and〈ne1〉)and XUV signal intensities in the core and edge show an increase after 3.2 s while Wdiaand H98,y2decrease in the case with the dust influx for shot # 56934.
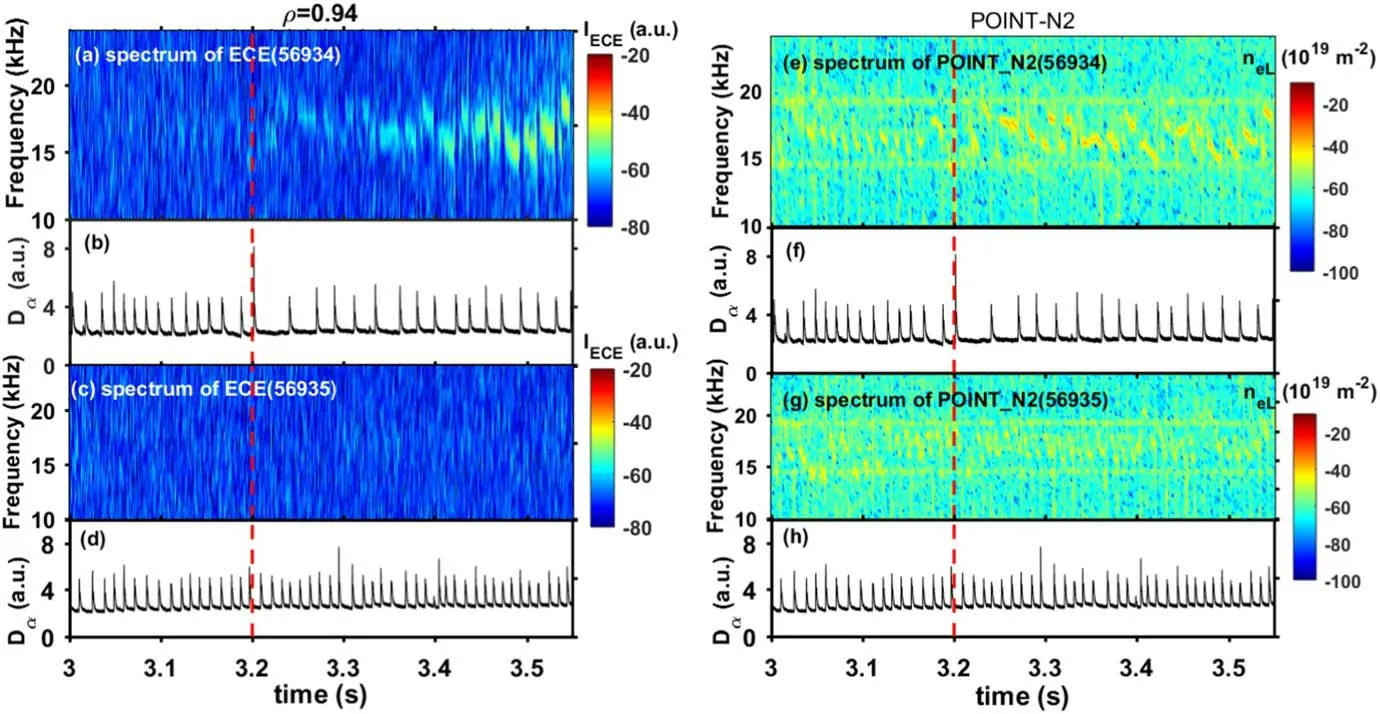
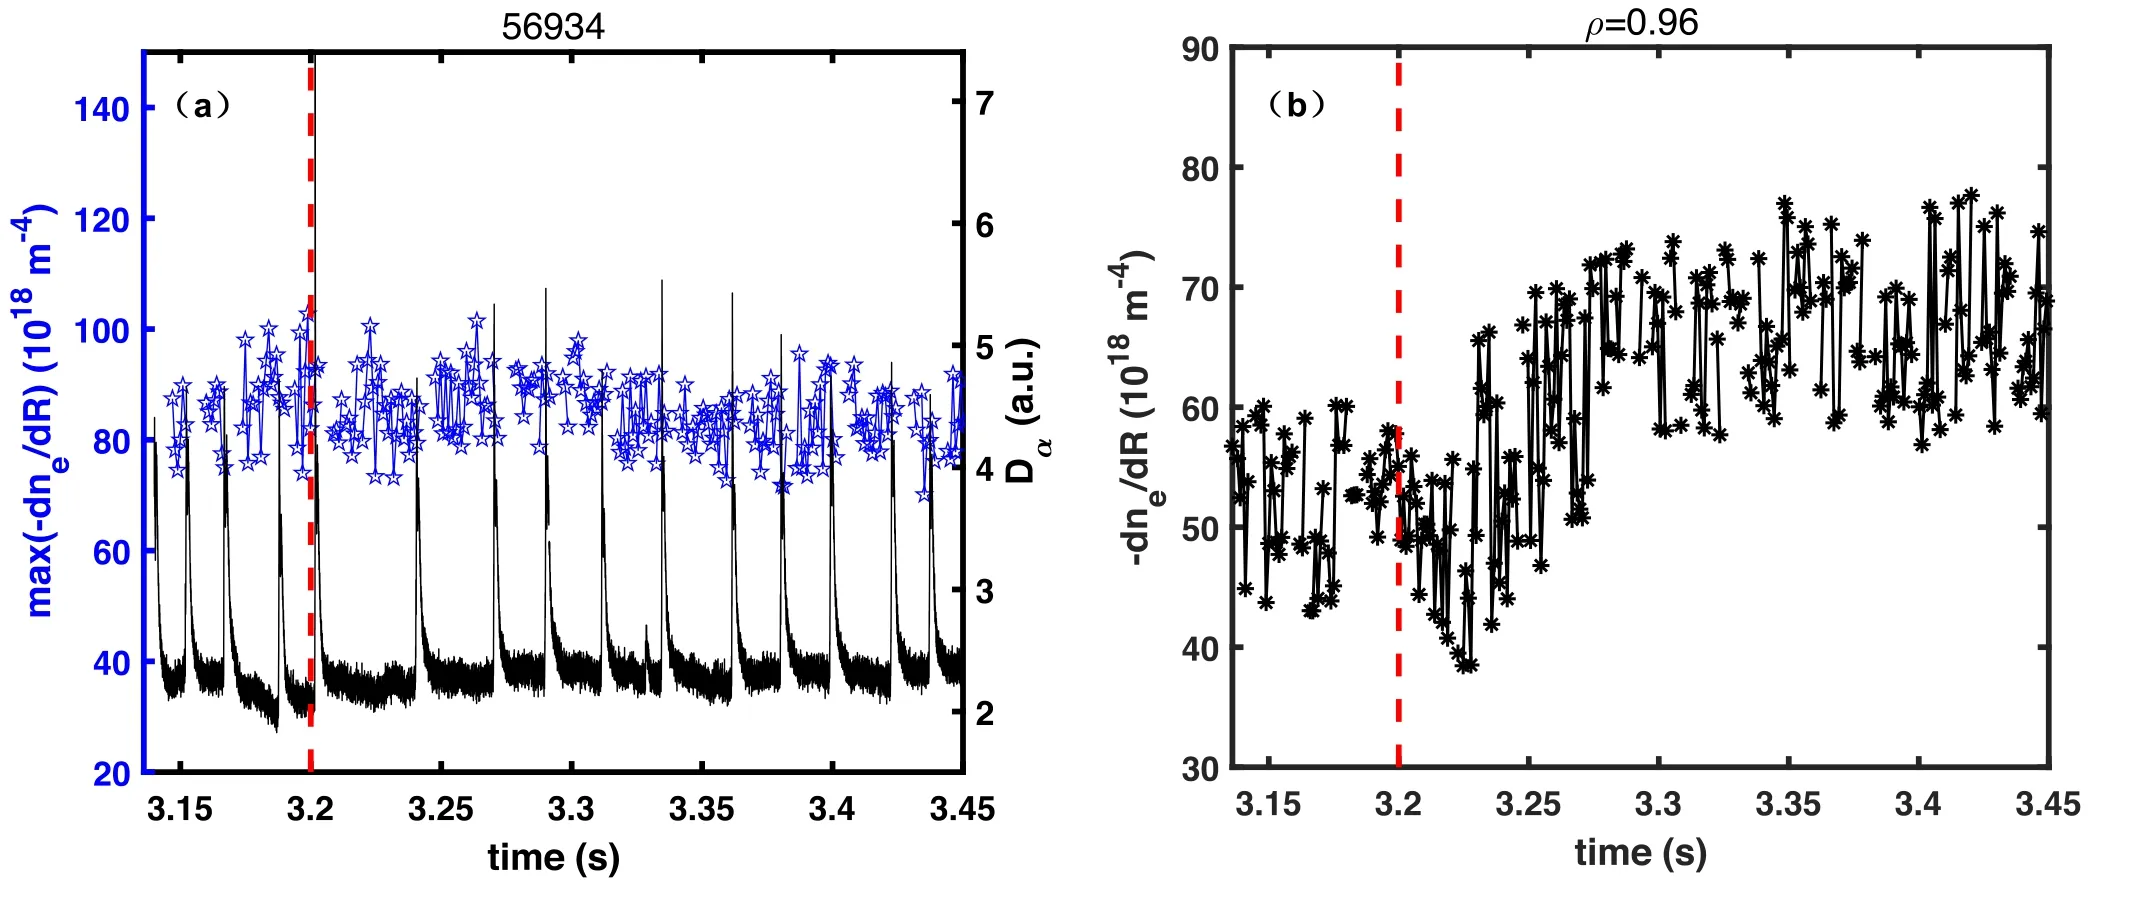
To clearly describe the dust particles’ dynamic transport process, figure 6 shows the time evolution of XUV signal at different spatial regions and the 2D contour plot of XUV signals from plasma edge to core.As shown in figures 6(a)–(d),(R,Z)denotes an intersection point coordinate of the two lines:the chord of XUV signal and a vertical line at the major radius R=1.85 m.And ρ denotes the square root of normalized toroidal flux at different coordinates of (R, Z).The XUV signal near the LCFS has detected a significantly increased radiation at t=3.2 s and after that, the XUV signal intensities at ρ from 0.85 to 0.97 also show sharp increases in the pedestal region.Compared with figure 6(a), figure 6(e)and (f) give the distribution of XUV signal after calibration and the time evolution of Dαsignal intensity.As shown,there is a difference between the radiations in the regions of 0.4 m Figure 6.Time evolution of XUV at different spatial positions.(a)ρ=1.01,(b)ρ=0.97,(c)ρ=0.91,(d)ρ=0.85,(e)the 2D contour plot of XUV signals from plasma edge to core, (f) the time history of Dα in the divertor region. As shown in figures 2–6, the experimental results imply that the increase of the edge radiation is attributed to the influx of dust particles after dropping down from the upper divertor.In comparison to the two shots#56934 and#56935 with and without a molybdenum impurity buildup, the dynamic process of the dust particles transport results in a crucial difference in the plasma radiation in the edge and core plasma regions.As also presented before, the increase of the edge radiation buildup is induced by the molybdenum dust in shot #56934 after 3.2 s. The behavior change in pedestal turbulence has been found on EAST after molybdenum dust particles enter the main plasma region within the LCFS.Figure 7 compares the amplitudes of density fluctuation, δNel2, and temperature fluctuation, δTECEat ρ=0.94 after 3.2 s between the two shots #56934 and #56935, respectively.A clear difference in the fluctuation spectra is that the amplitude of the CM gradually increases after the molybdenum dust impurities enter the plasma separatrix for shot#56934 while there is no apparent change on δTECEand δNel2in shot #56935.During the first inter-ELM after the dust influx, the CM amplitude is weaker than that in the next few inter-ELM for # 56934.It can also be observed in figure 7(a) that the lasting time of inter-ELM (3.21–3.235 s) is extended in comparison to that before the molybdenum dust particles enter into the main plasma region.Compared with the spectrum of POINT_N2,the spectrum of ECE in shot #56934 shows a significant increase of CM amplitude after the molybdenum influx.In addition,the toroidal mode number of CM observed here has been calculated as 15 by applying a similar method of analysis to that used in the[13].Such pedestal fluctuation is also named CM on EAST [12, 13]. Figure 7.The appearance of coherent mode after 3.2 s for shot #56934.(a) Spectrum of edge ECE channel at ρ=0.94 for shot #56934.(b)and (f) The time evolution of Dα signal in the divertor region for shot#56934.(c) Spectrum of edge ECE channel at ρ=0.94 for shot#56935.(d) and (h) The time evolution of Dα signal in the divertor region for shot #56935.(e) The spectrum of Nel2 for shot #56934.(g) The spectrum of Nel2 for shot #56935. As mentioned previously, the deposition position of the molybdenum dust particles is located at the pedestal, which results in triggering the appearance of the CM fluctuation at ρ=0.94 shown in figure 7(a).Investigating the response of pedestal electron density, pedestal electron temperature, and the CM amplitude to the molybdenum buildup benefits to the comprehension of the relationship between the three parameters.Figure 8 shows the time evolution of nein the pedestal, the ECE signal at ρ=0.94, the effective ionic charge(Zeff), CM amplitude, respectively.The experiment results show that neat ρ=0.94 has a slight decrease in the first inter-ELM period after the molybdenum influx and subsequently increases until the density reaches a steady state.Zeffhas a rapid increase and after that keeps almost constant.However,the ECE signal intensity shows a continued decrease after the molybdenum dust entering.In contrast to decrease of the ECE signal,CM amplitude has a tendency to gradually increase in the several inter-ELM periods.The experiment results show that the edge temperature and impurity buildup in the pedestal region are clearly correlated, i.e.the higher impurity concentration results in the lower temperature and higher local electron density. Figure 8.The time evolution of (a) ne at ρ=0.94, (b) ECE signal intensity at ρ=0.94,(c)Zeff in the main plasma region,and(d)CM amplitude at ρ=0.94 and the red line represents the envelope of filtered CM waveform. As investigated in the section 1,one of the mechanism to determine CM amplitude is the electron density gradient in the steep region of pedestal.In the study, as shown in figures 9(a) and (b), we also give the time evolution of the maximum gradient and the local gradient at ρ=0.96 in the pedestal region, respectively.It is shown that the maximum gradient almost remains constant before and after the molybdenum influx buildup.However, the local density gradient in the pedestal shows an increase and subsequently reaches a saturated state.The experimental result indicates that the appearance of CM at ρ=0.94 is consistent with the increase of the electron density gradient. Besides, due to the increase of neand decrease of Tein the pedestal, it is necessary to qualitatively discuss about the effect of edge collisionality on the CM amplitude.As also mentioned in the section 1, a long-pulse high confinement mode with lithium injection in EAST is considered to strongly depend on the local collisionality[9].The electron Braginskii Figure 9.(a) The maximum gradient and (b) the local gradient at ρ=0.96 of ne in the pedestal region for #56934. Figure 10.(a)The electron density,(b)the ECE signal intensity,(c)the absolute value of the electron density gradient in the pedestal region versus CM amplitude. collisionality can be written aswhich increases with increasing the electron density and decreasing the electron temperature.It should be noted that the pedestal absolute electron temperature cannot be calculated since the standard deviation is high in the edge electron temperature from TS.Hence,the qualitative analysis of νeis performed in the work.Figures 10(a)-(c)show that the dependency of CM amplitude on ne,IECE@0.84,and the absolute value of ∇neat the steep gradient region.Based on a simple linear analysis,we can see that the CM amplitude increases as the density increases from 1.5×10¹⁹to 2.5×10¹⁹m-3, and the increasing percentage is about 67%.The decreasing percentage of ECE signal intensity is about 30%.Compared with the increasing percentage (about 56%) of the density gradient at ρ=0.94, the increased level of the edge collisionality is more significant than that of the density gradient.The qualitative result analysis indicates that an increase in the density gradient and edge collisionality leads to the enhance of CM amplitude after the influx of molybdenum dust.Compared with the density gradient, the experimental results show that the edge collisionality possibly plays a more significant role in changing CM amplitude than the density gradient. It should be stressed that, due to the limited diagnostics on EAST,the error bar of electron temperature at ρ>0.92 is too large that the temperature gradient can not be calculated.Consequently,the lack of a basic pedestal temperature profile prevents a further investigation of CM’s mechanism.More theoretical work cannot be carried out in the paper.The related study will be on the road. In a tokamak, impurity generation may be unavoidable when a plasma is ignited.An experimental study of the impurity accumulation facilitates the operation of future fusion reactors.General high-Z impurity influx usually causes a considerable radiation accumulation in the core region, resulting in a lower fusion energy gain factor, even the disruption of fusion plasma.However, different from the core accumulation,the impurities buildup in the pedestal may be a new road to mitigate the continuous heat exhaust.In this work, the effect of the molybdenum dust buildup in the pedestal region on plasma edge turbulence has been investigated on the EAST tokamak.It is found that a CM can be triggered by a molybdenum dust which is different from the impurities injected by the laser-blow-off method mentioned in the references [2, 3, 8].The motion of dust particles is clearly captured by the CCD camera after dropping down from the upper diverter region.Quickly, the dust particles are ionized and deposit in the plasma pedestal region within the last closed flux surface by penetrating the scrape-off layer,which is indicated by the MoXV line emission and the 2D radiation contour plot from the EUV spectrometer and XUV spectrometer, respectively.The XUV signals also demonstrate that the increase of the edge radiation is attributed to the ionization of the molybdenum particles.The process of the dust transport results in increasing the edge electron density and plasma radiation and a lower electron temperature, plasma stored energy, and plasma performance. Moreover,it is observed in the FFT spectrum analysis of ECE and POINT signals that the CM appears and its amplitude gradually increases after the molybdenum impurities influx.The experimental analysis shows that the density gradient and edge collisionality are associated with the appearance of CM.When collisionality and density gradient are higher, the corresponding intensity of the CM will be enhanced.The statistics indicate that the change of the edge collisionality is more sensitive than that of the density gradient when determining the increase of CM amplitude.Besides,there is no doubt that both density gradient and edge collisionality play a vital role in the onset of CM. In addition,the effect of CM on the plasma performance is worthy of discussion in the work.The energy confinement quality (H98,y2) decreases by 10% after the molybdenum dust particles enter the pedestal region.For two inter-ELM periods afterwards, the H98,y2keeps constant while CM amplitude continues to increase slowly.The experiment results imply that the increased CM amplitude appears to be seemingly unrelated to the plasma performance.It also confirmed the similar conclusion by analyzing the experimental data in the published papers[10,13]. Acknowledgments The authors would like to thank Xiang Han and Mingfu Wu for their comments and suggestions.This work is supported by Shenzhen Clean Energy Research Institute.This work is supported by the National Key R&D Program of China (No.2017YFE0301205) and National Natural Science Foundation of China (Nos.11875289, 11975271, 11605244, 11675211,12075284,12075283,12075155 and 11875294).The authors are grateful to all collaborators of the EAST team for their contribution to the work.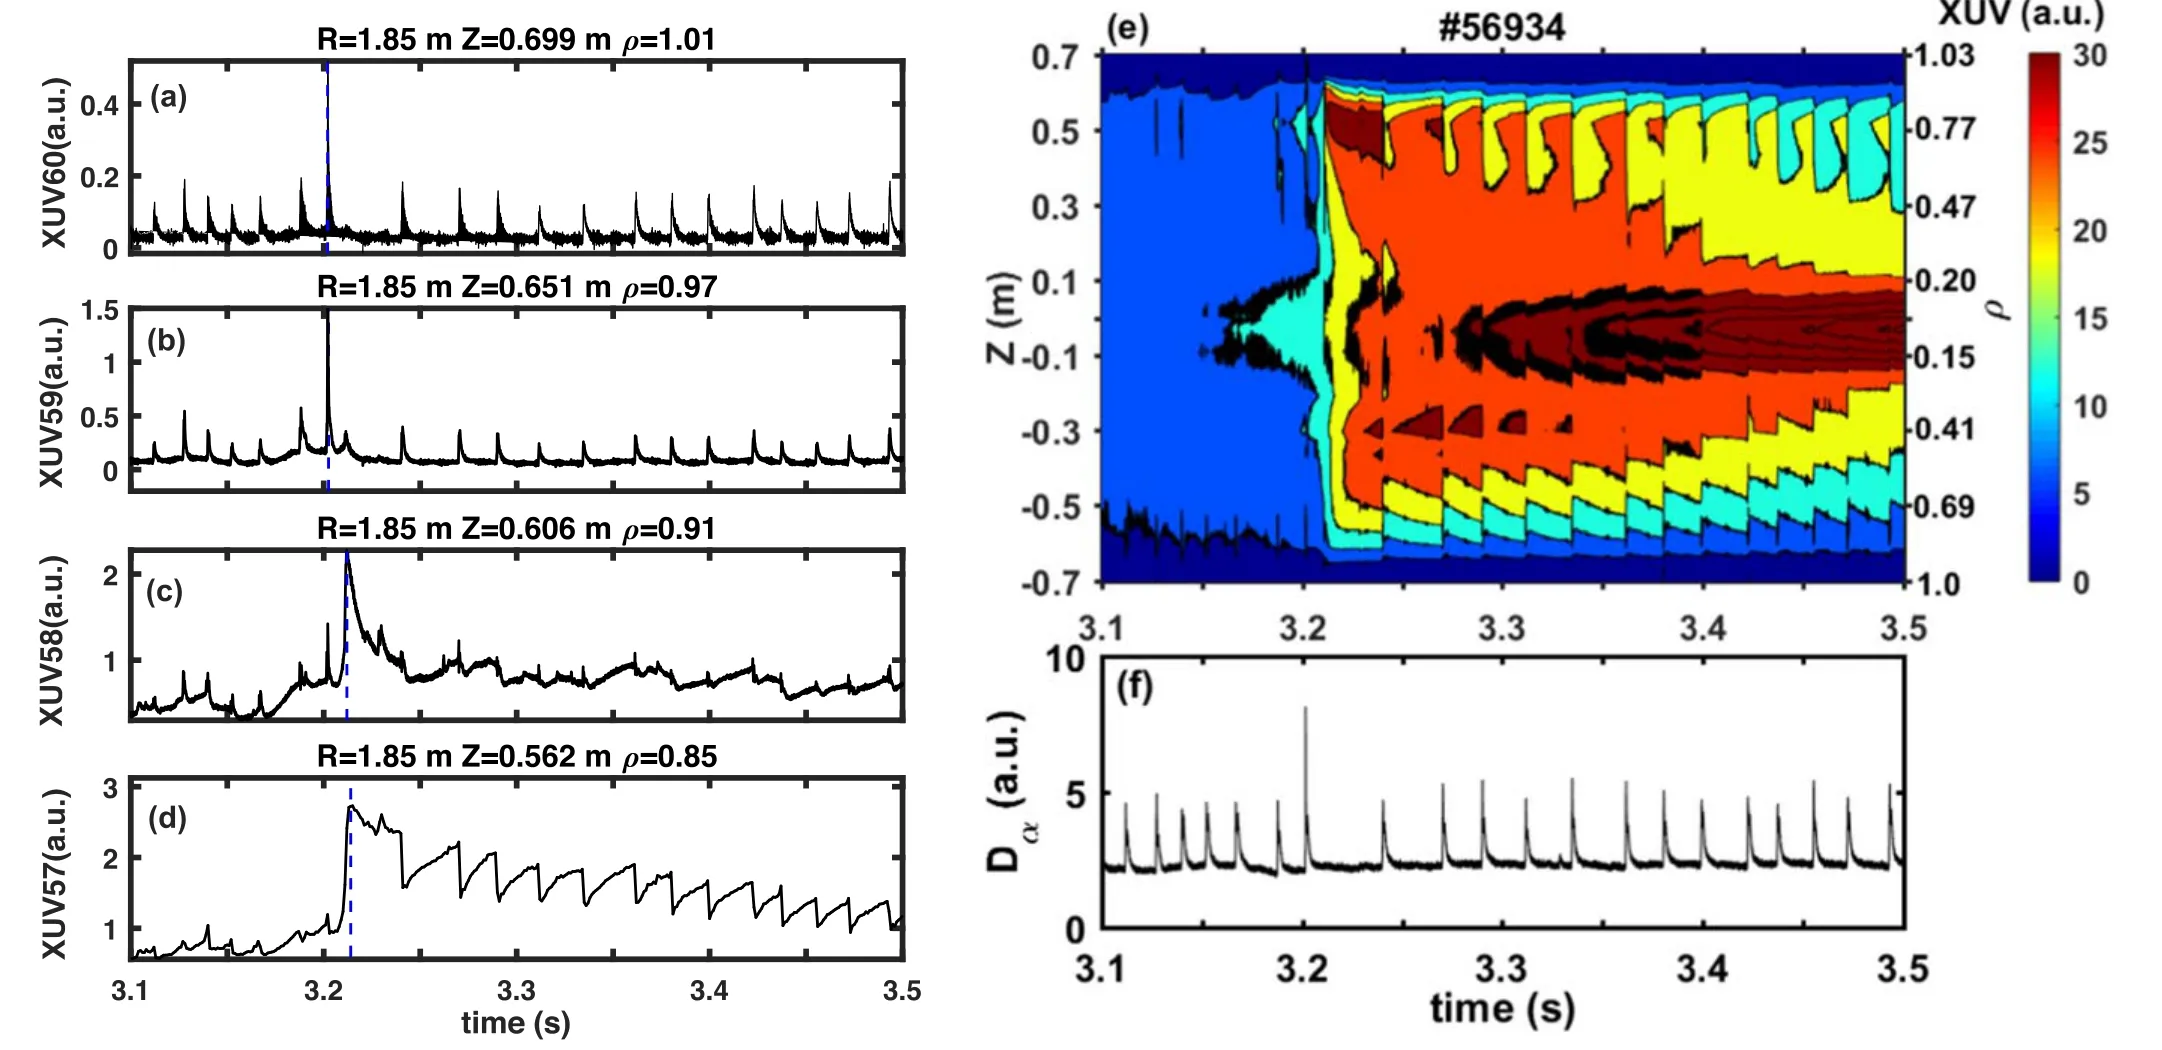
4.The mechanism determining CM amplitude


5.Summary
 Plasma Science and Technology2021年11期
- Plasma Science and Technology的其它文章
- Spatial and temporal evolution of electromagnetic pulses generated at Shenguang-II series laser facilities
- Numerical study on the loss of fast ions produced by minority ion cyclotron resonance heating in EAST
- Machine learning of turbulent transport in fusion plasmas with neural network
- Investigation of stimulated Raman scattering in longitudinal magnetized plasma by theory and kinetic simulation
- The influence of magnetic field on the beam quality of relativistic electron beam long-range propagation in near-Earth environment
- Regulation of the density distribution of a strongly dissipative plasma by a pulsed magnetic field