
Stability analysis of hydro-turbine governing system based on machine learning
2021-12-22 06:47YuanshengChen陈元盛andFeiTong仝飞
Chinese Physics B 2021年12期
Yuansheng Chen(陈元盛) and Fei Tong(仝飞)
State Key Laboratory of Eco-hydraulic in Northwest Arid Region,Xi’an University of Technology,Xi’an 710048,China
Keywords: hydro-turbine governing system,stability,machine learning,dynamic model
1. Introduction
In the process of supplying power to the power system,hydropower stations not only ensure the safety and reliability of power supply, but also ensure the stability of voltage and frequency.[1–3]As the user load changes, the voltage and frequency of the system power supply will also change. At this time, the voltage adjustment system of the generator will automatically adjust to restore the voltage to the rated value or keep the voltage within the allowable range. Hydro-turbine governing system can change according to the external load.To quickly change the output of the unit to ensure that the speed of the unit, that is, the power supply frequency, is restored or kept within the allowable range. The load fluctuation is distributed among the units to achieve economical and reasonable operation. Therefore,the hydro-turbine governing system is an important part of a hydropower station, and its safe and stable operation plays an important role in the process of hydropower generation.
Hydro-turbine governing system is a comprehensive control system that integrates water, machinery, electricity, and magnetism, and is affected by different inertia, time-varying parameters, and changes in grid load in each link.[4–6]This adds the difficulty to the theoretical analysis and research on the stability of the HTGS.At present,the research method of the stability of the HTGS is mainly carried out by establishing the corresponding mathematical model and combining with the stability theory. The research content can be divided into two situations: large fluctuation and small fluctuation. For a small fluctuation,it is generally considered that when the load disturbance is not more than 10% and the frequency disturbance is not more than 8%;otherwise,it is called a large fluctuation. In the study of the HTGS stability analysis during the transient process of small fluctuations, the linearized system mathematical model is usually used to describe its dynamic characteristics. This method has the characteristics of clear physical meaning and simple structure, which can meet the requirements of general engineering. However, the stability problem of the HTGS during transition process of large fluctuations is more serious. At present,the nonlinear mathematical model of the hydro-turbine governing system is mainly used to describe the characteristic changes of the large fluctuation transition process of the system to the greatest extent.Quet al.[7]presented the state equation of HTGS with SLHT to describe the nonlinear performance of HTGS without control and designed the robust H-infinity control strategy for HTGS.Guoet al.[8]investigated the effect of hysteresis on the characteristics of a pump-turbine during transient process and the dynamic characteristics of the system were analyzed by simulations. Laiet al.[9]studied the stability and dynamic characteristics of the nonlinear HTGS–PG coupling system based on the nonlinear mathematical model and Hopf bifurcation theory. Liet al.[10]investigated the stability of an HTGS under simultaneous effects of multi-stochastic factors by establishing its nonlinear dynamic model. Based on these complex nonlinear mathematical models of the HTGS,it is difficult to use mathematical theories to give a stability criterion, and it is even more difficult to complete the stability analysis of the system under various working conditions.
With the development of machine learning theory, various machine learning algorithms have been fully applied in automatically mining patterns and laws hidden in data. As a representative type of machine learning method,artificial neural network can establish a calculation model by imitating biological neural network,and has good self-learning ability and robust performance.[11–13]At present, there is no research on extending the machine learning method to the stability analysis of the HTGS. Therefore, based on the nonlinear mathematical model of the HTGS,the machine learning method of neural network is used to mine the evolution law of system stability under different working conditions,which provides a new theoretical analysis approach to ensure the safe and stable operation of hydropower stations.
For this reason, based on the construction of the nonlinear dynamic model of the HTGS,this paper uses the BP neural network algorithm to analyze the stability characteristics of the system under different load conditions, and optimizes the algorithm to improve the prediction accuracy of the trained model,which mainly includes the following three aspects: (i)The nonlinear model of the HTGS is introduced including the dynamic characteristics of the generator set;(ii)Based on the mathematical model of the HTGS,the stability sample data of the system under different load conditions is achieved through the dynamic change of the transfer coefficient; (iii) A neural network algorithm model and optimization method suitable for multi-output and multi-output of the HTGS are proposed.The performance of the proposed machine learning model is analyzed through the test set data.
2. Dynamic model of the hydro-turbine governing system
This paper considers the nonlinear model of the Francis turbine governing system including the second-order dynamic characteristics of the generator rotor. The hydraulic turbine and diversion pipeline in this model still adopt the linear model. It can be seen from the Refs.[14–16]that the dynamic model of the HTGS under rigid water hammer conditions is
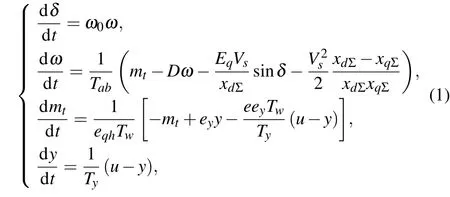
whereδis the generator rotor angle andωis the relative deviation of generator speed,ω0= 2π f0.Dis the generator damping coefficient, which is generally regarded as a constant, and the value is 0sin3.eis the intermediate variable,e=(eqyeh)/ey −eqh.Eqis the transient potential ofq.Vsdenotes infinite bus voltage.xdΣandxqΣare generator transient reactance ofdand synchronous reactance ofq.
On this basis, considering the PID control strategy commonly used in the current hydro-turbine governing system,the controller output signal can be expressed as[17,18]

The characteristic of the proposed nonlinear model is to conduct a comprehensive study of the hydro-mechanical system as a whole. Compared with the linearized model, this model can better reflect the internal nonlinear nature of the system.
3. Machine learning and its application analysis
3.1. BP neural network
BP neural network is a kind of multi-layer feed forward neural network.[22–24]The main feature of this network is signal forward transfer and error back propagation. In the forward pass, the input signal is processed layer by layer from the input layer through the hidden layer to the output layer.The neuron state of each layer only affects the neuron state of the next layer. If the output layer cannot get the expected output, it will switch to back propagation, adjust the network weight and threshold according to the prediction error,so that the predicted output of the BP neural network will continuously approach the expected output. The topological structure of BP neural network used in this paper is shown in Fig.1.
In Fig. 1,ey,eh,eqy,eqh, which indicate the transfer coefficients of the system, are the input values of the BP neural network. Stability predictions 1–3 are the predicted values of the BP neural network.ωi jandωjkare the weight of the BP neural network. It can be seen from Fig.1 that the BP neural network can be regarded as a nonlinear function,and the input value and predicted value of the network are the independent and dependent variables of the function,respectively.We want to predict the stability category of the HTGS by using the input data. Now the number of input nodes is 4 and the number of output nodes is 3. Later we will determine the number of hidden layers through stability prediction analysis.

Fig.1. Diagram of BP neural network topology.
3.2. Applicability analysis of BP neural network learning algorithm
Based on the nonlinear mathematical model of the HTGS,we can use the dynamic response of the system parameters to determine the state of the system. For example,the gradual divergence of the speed response indicates that the system is in an unstable state; the equal amplitude oscillation of the head response indicates that the system is in a critically stable state,and the gradual convergence of the torque response indicates that the system can become stable. As a hydro-mechanical coupling hybrid system, the hydro-turbine governing system has complex dynamic characteristics,and it is difficult to give an expression for the relationship between the transfer coefficient and the stability of the hydro-turbine governing system.The BP neural network learning algorithm can obtain the potential laws of mining data. Using the transfer coefficient and stability discrete data set obtained by the mathematical model of the hydro-turbine governing system,we can train and obtain the stability prediction model of the hydro-turbine governing system. The BP neural network model has a simple structure and can be adjusted according to the complexity of the data form.
4. Machine learning model of hydro-turbine governing system
4.1. Data sample processing
The transfer coefficient of the HTGS changes with the operating conditions of the system. According to the data in Ref.[15],there is the following relationship between the output power of the hydro-turbine and the transfer coefficient.
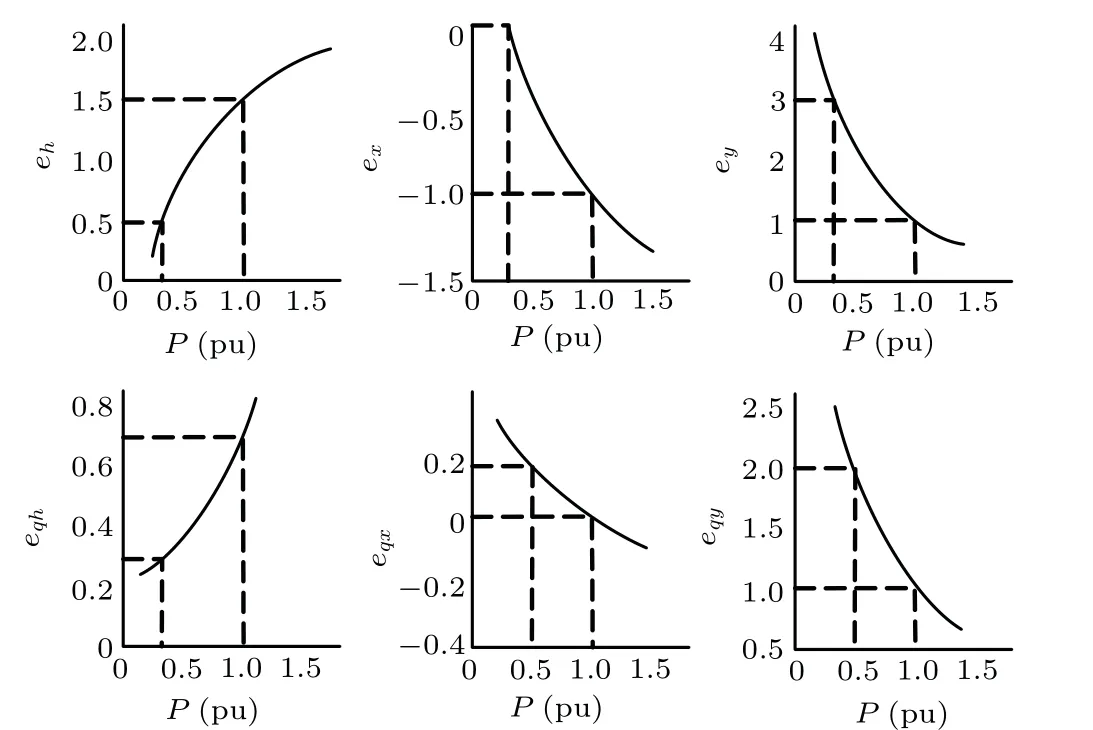
Fig.2. Relationships between output power and transfer coefficient.
First, we select the values of transfer coefficient within the range of output power(50%–100%). Then,we can obtain the stability characteristic of the HTGS by substituting the values of transfer coefficient into the system. The values of these transfer coefficients within the range of output power (50%–100%)are presented in Table 1.

Table 1. Values of transfer coefficients within the range of output power(50%–100%).
In order to use the BP neural network algorithm to train the machine learning model of the HTGS, we use the established nonlinear model of the system combined with the correlation between the transfer coefficient and the output power.First, we divide the value interval of the transfer coefficient into 100 parts and put them into Eq.(4)to obtain the stability category of the HTGS.
4.2. Network topology of the machine learning model
Based on the BP neural network,the HTGS stability classification algorithm modeling includes three steps: BP neural network construction,BP neural network training,and BP neural network classification. The algorithm flow is shown in Fig.3.
The construction of BP neural network determines the structure of the BP neural network according to the characteristics of the input and output data of the system. Since the stability characteristic input signal has 4 dimensions,there are 3 types of stability categories to be classified. Since the number of hidden layer nodes has a significant impact on the prediction accuracy of the BP neural network,we will choose an appropriate number of hidden layer nodes based on empirical formulas and trial and error methods.
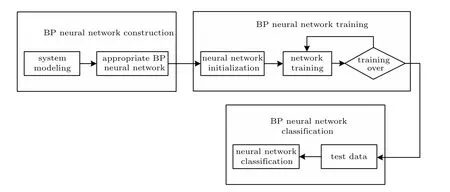
Fig.3. Flow diagram of the BP neural network classification algorithm.
5. Model training and testing
The number of hidden layer nodes of the BP neural network stability prediction model of the HTGS has a greater impact on the model prediction accuracy. Too few nodes will cause the network to fail to learn the sample data well. The training times need to be increased,and the training accuracy is also affected. Impact: Too many nodes, the training time increases, and the network is easy to overfit. According to the optimal hidden layer node number selection formula, we determine the range of hidden layer node number selection interval(4–15). The relationship between the number of hidden layer nodes and the stability prediction error rate of the BP neural network of the HTGS is shown in Fig.4.
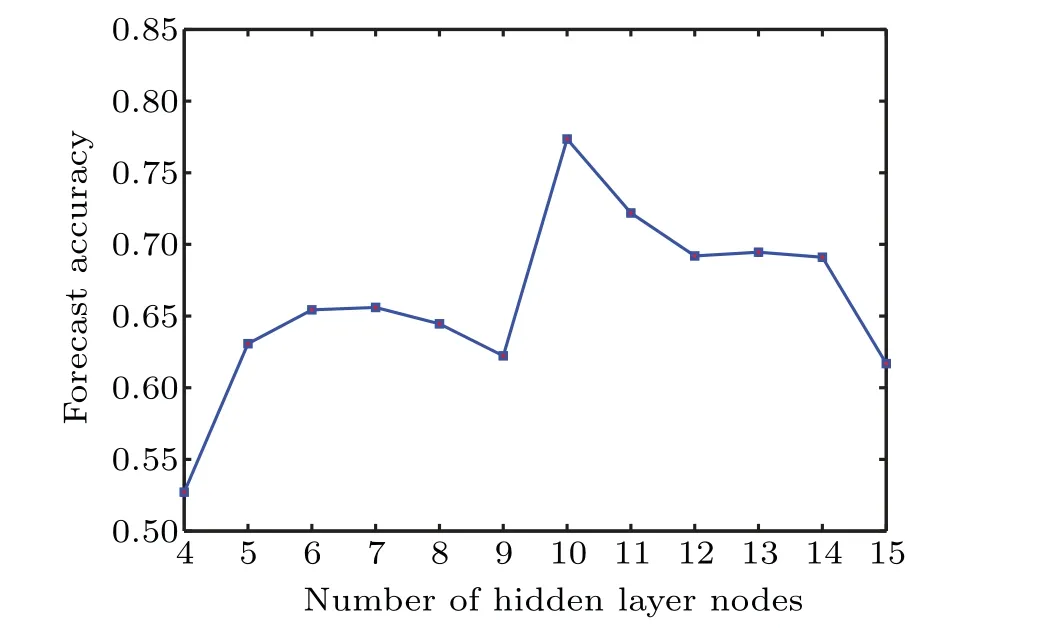
Fig. 4. Relationship between the stability forecast accuracy and number of hidden layer nodes.
It can be seen from Fig. 4 that when the number of hidden layer nodes is in the range of 4–15,the stability prediction accuracy of the BP neural network of the hydro-turbine regulation system will increase first and then decrease as the number of hidden layer nodes increases. trend. When the number of hidden layer nodes is 10,the stability prediction accuracy rate of the BP neural network of the HTGS reaches the maximum 77.35%. Therefore,we determine that the model architecture of the BP neural network of the HTGS is 4–10–3(the number of input layer nodes is 4,the number of hidden layer nodes is 10,and the number of output layer nodes is 3),and the subsequent model training and testing is carried out.

Fig.5. BP neural network training flowchart.
The BP neural network stability prediction model of the HTGS should train the network before performing predictive analysis,and use sample data for training to make the network have associative memory and predictive capabilities. The BP network training flowchart is shown in Fig.5 and the network training process includes the following steps.
Step 1 Network initialization
Determine the number of input layer nodes (n), hidden layer nodes (l), and output layer nodes (m) according to the system input and output sequence (X,Y). Initialize the connection weights between the input layer (ωi j), hidden layer and output layer neurons(ωjk),and initialize the hidden layer threshold (a), output layer threshold (b), and preset learning rate and neuron activation function.
Step 2 The hidden layer output calculation
According to the input vector(X),the connection weight between the input layer and the hidden layer (ωi j), and the hidden layer threshold(a),the hidden layer output(H)is calculated as follows:


Step 7 Determine whether the algorithm iteration is over,if not,return to Step 2.
The stability categories of the HTGS can be divided into three categories: stable state,critical state,and unstable state.In the prediction category of the BP neural network stability prediction model of the HTGS, we will use the above three stability categories for convenience. Set as the first category,the second category,and the third category respectively.
In the model training process,100 sets of transfer coefficient and system stability data in Subsection 4.1 are selected,80 sets of data are randomly selected as training data to train the network,and 20 sets of data are used as test data to test the network’s predictive ability. Using the trained HTGS BP neural network stability prediction model, since the training data and test data are randomly selected,we count the average prediction accuracy rate of ten times as the classification accuracy rate. Here we provide the classification error of 20 sets of test data for a certain time as shown in Figs.6 and 7.

Fig. 6. Test of predictive stability and actual stability of HTGS BP neural network model.
In Fig. 6, the predicted stability category and the actual stability category of the BP neural network model of the HTGS are presented by red and blue lines respectively. Therefore, when the red line and the blue line are separated, it indicates that the prediction results of the model under the test data group deviate from the actual results, that is, the stability category prediction error. It can be seen from Fig. 6 that in the case of the third and 16th groups of test data, the BP neural network model of the HTGS predicts that the stability category does not match the actual stability category.
In Fig. 6, the predicted stability category and the actual stability category of the BP neural network model of the HTGS are connected by red and blue lines respectively.Therefore, when the red line and the blue line are separated, it indicates that the prediction results of the model under the test data group deviate from the actual results, that is, the stability category prediction error. It can be seen from Fig. 6 that in the case of the third and 16th groups of test data, the BP neural network model of the HTGS predicts that the stability category does not match the actual stability category.
It can be seen from Fig. 7 that the BP neural network model of the HTGS has prediction errors in the test data sets of the third and 16th transfer coefficients and stability categories. Under the other sets of test data, they are accurately predicted based on the characteristics of the transfer coefficients. The stability category of the turbine governing system.The classification error results in Fig.7 are consistent with the predicted and actual stability classification results in Fig. 6.The test results show that,in this group of tests,the accuracy of the classification prediction of the stability of the BP neural network model of the HTGS reaches 90%.

Fig. 7. Stability classification error test of BP neural network model of HTGS.
Because we adopt a random selection method to divide 100 sets of sample data into 80 sets of data as training data to train the network,and 20 sets of data as test data to test the network’s predictive ability.In order to more accurately reflect the classification and prediction performance of the stability of the BP neural network model of the hydro-turbine regulation system, we count the average prediction accuracy rate of ten times as the classification accuracy rate. The specific statistical results are shown in Table 2.
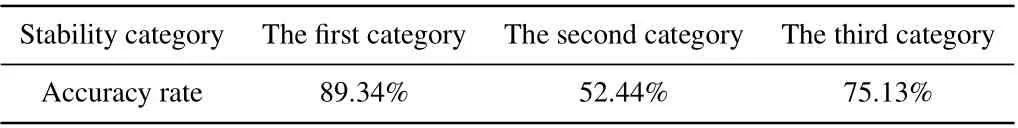
Table 2.Classification accuracy rate of BP neural network model of the HTGS.
We set the turbine governing system in a stable state, a critical state, and an unstable state as the first, second, and third stability categories,respectively. It can be seen from the above-mentioned stability prediction classification results of the BP neural network model of the HTGS that the trained prediction model also has different recognition accuracy rates for different stability categories of the HTGS. According to the characteristics of the transfer coefficient, the recognition accuracy rate of the system in a stable state is up to 89.34%,followed by the recognition accuracy rate of the system in an unstable state up to 75.13%. According to the characteristics of the transmission coefficient of the hydro-turbine regulation system,the accuracy of identifying the critical state of the system is only 52.44%. Analyze the reasons for this situation,mainly due to the fact that the training sample data are less,and the data of the HTGS in the critical state are less,and the BP neural network model of the HTGS is not enough to learn the system in the critical state, which leads to the stability of the critical state. The recognition rate of sex categories is low.In addition,the defects of the BP neural network algorithm itself lead to the overall low accuracy of the classification results of the BP neural network model of the HTGS.
BP neural network is a learning algorithm that uses gradient correction method as weights and thresholds. The weights and thresholds are corrected from the negative gradient direction of the network prediction error, without considering the accumulation of previous experience,and the learning process converges slowly. For this problem,we use the additional momentum method to solve, the weight learning formula with additional momentum is

whereω(k),ω(k −1), andω(k −2) are the weights at the momentk,k −1,andk −2.ais the momentum learning rate.
While keeping the original structure of the BP neural network model of the HTGS unchanged, we introduced the method of learning with additional momentum weights to optimize the BP neural network model of the HTGS. The data used in the model training process remains unchanged. For the optimized training model,we provide the classification error of 20 sets of test data at a certain time as shown in Figs.8 and 9.
It can be seen from Fig.8 that the predicted stability category and the actual stability category of the BP neural network model of the HTGS are respectively represented by the red line and the blue line. In the case of the 16th group of test data,red and blue lines are separated,that is,the stability category predicted by the BP neural network model of the HTGS does not match the actual stability category.

Fig. 8. Test of predictive stability and actual stability of HTGS BP neural network optimization model.
It can be seen from Fig. 9 that the BP neural network model of the HTGS has a prediction error in the test data group of the 16th transfer coefficient and stability category.Under the other sets of test data, the stability of the HTGS is accurately predicted based on the characteristics of the transfer coefficient. Sex category. The classification error results in Fig.9 are consistent with the predicted and actual stability classification results in Fig. 8. The test results show that, in this set of tests, the accuracy of classification and prediction of the stability of the BP neural network optimization model of the HTGS has reached 95%.
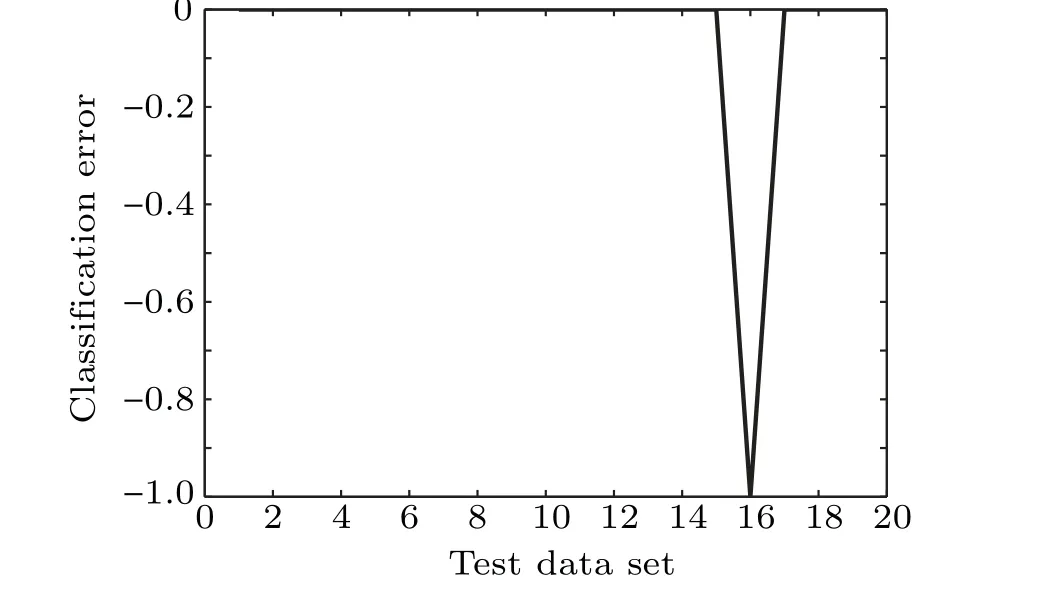
Fig. 9. Stability classification error test of BP neural network optimization model of the HTGS.
Similarly, in order to more accurately reflect the classification and prediction performance of the stability of the BP neural network optimization model of the hydro-turbine regulation system,we count the average prediction accuracy rate of ten times as the classification accuracy rate. The specific statistical results are shown in Table 3.
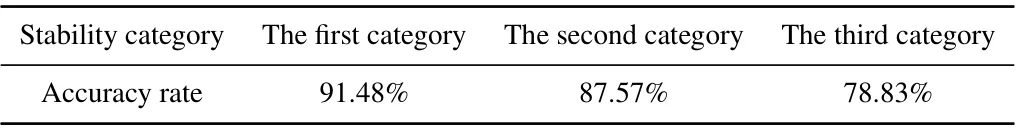
Table 3. Classification accuracy rate of the additional momentum improvement model of the HTGS BP neural network.
From the above-mentioned stability prediction classification results,the BP neural network optimization model of the system can effectively improve the accuracy of the BP neural network model for various stability prediction classification results.Among them,the recognition accuracy of the HTGS in a stable state increases from 89.34%to 91.48%,and the recognition accuracy rate of a critical state increases from 52.44%to 87.57%,and the recognition accuracy rate of an unstable state increased from 75.13% to 78.83. %. The BP neural network model of the HTGS optimized by the additional momentum weight has a significant improvement in the recognition accuracy of critical state categories with less training data.
6. Conclusions
In this paper, a BP neural network model of HTGS is trained and tested based on the sample data from the nonlinear dynamic model of the HTGS. The neural network model can predict the stability of the HTGS according to its transfer coefficients under different working conditions. Then,the additional momentum method is used to optimize the neural network model and the prediction accuracy of the three stability categories is improved,especially in the critical stability category with small data volume.
Since the HTGS is a strong nonlinear system, its stability under different working conditions is difficult to give an accurate mathematical expression. The research method and results can provide new ideas for the stability analysis and control of HTGS.

- Chinese Physics B的其它文章
- Transient transition behaviors of fractional-order simplest chaotic circuit with bi-stable locally-active memristor and its ARM-based implementation
- Modeling and dynamics of double Hindmarsh–Rose neuron with memristor-based magnetic coupling and time delay∗
- Cascade discrete memristive maps for enhancing chaos∗
- A review on the design of ternary logic circuits∗
- Extended phase diagram of La1−xCaxMnO3 by interfacial engineering∗
- A double quantum dot defined by top gates in a single crystalline InSb nanosheet∗