
Brillouin gain spectrum characterization in Ge-doped large-mode-area fibers∗
2021-12-22 06:42XiaXiaNiu牛夏夏YiFengYang杨依枫ZhaoQuan全昭ChunLeiYu于春雷QinLingZhou周秦岭HuiShen沈辉BingHe何兵andJunZhou周军
Chinese Physics B 2021年12期
Xia-Xia Niu(牛夏夏) Yi-Feng Yang(杨依枫) Zhao Quan(全昭) Chun-Lei Yu(于春雷)Qin-Ling Zhou(周秦岭) Hui Shen(沈辉) Bing He(何兵) and Jun Zhou(周军)
1Shanghai Key Laboratory of All Solid-State Laser and Applied Techniques,Shanghai Institute of Optics and Fine Mechanics,Chinese Academy of Sciences,Shanghai 201800,China
2Center of Materials Science and Optoelectronics Engineering,University of Chinese Academy of Sciences,Beijing 100049,China
Keywords: stimulated Brillouin scattering,Brillouin gain spectrum,large-mode-area fibers,fiber laser
1. Introduction
The applications of high-power narrow-linewidth fiber lasers to coherent beam combining and spectral beam combining have attracted widespread attention in recent years.[1,2]Stimulated Brillouin scattering (SBS) is the most limiting effect in terms of power handling capacity in high-power narrow-linewidth fiber lasers.[3,4]Over the decades, a variety of techniques have been implemented in order to suppress SBS,[5]such as introducing nonuniformities by stressing the optical fiber,[6]reducing the overlap between the light wave field and the sound wave field in the core by changing the doping composition and distribution in the core,[7–10]reducing effective fiber length,[11]broadening spectral linewidth of seed by pure phase modulation,etc.[12–15]Specifically,white noise source (WNS)[16–19]and pseudo-random binary sequence(PRBS)[20–23]phase modulation become the leading linewidth broadening schemes for high power fiber amplifiers which are required to balance the narrow-linewidth and the output power. In the commonly used PRBS phase modulation scheme,the SBS suppression capability can be determined by the separation between the discrete adjacent sidebands lying within the envelope, which should be appreciably more than twice the Brillouin gain spectrum(BGS)bandwidth.[14]In this scenario,the BGS characteristics become essential for designing the PRBS phase modulation scheme.
As is well known,the core dimensions and GeO2concentration of the fibers can dramatically affect the BGS characteristics, especially the Brillouin frequency shift (BFS) and the BGS bandwidth. Some efforts have devoted to studying the BGS in single-mode fiber(SMF).Nikleset al.have studied the influence of germanium concentration on BFS and BGS bandwidths,and they found that the change between BFS and GeO2concentrations is−94 MHz/wt%, while the change between BGS bandwidth and GeO2concentration is 1.4 MHz/wt%.[24]Liet al.reported the BFS is reduced by∼1 GHz and BGS bandwidth is increased by∼2 MHz when the core diameter decreases from 8.8 µm to 3 µm.[25]It is noticed that the germanium concentration of the fiber with a core diameter of 8.8 µm in Ref. [25] is 4 wt%, while the germanium concentration of the fiber with a core diameter of 3 µm is 19 wt%,showing the germanium concentrations of the fibers with different core diameters are different, and the BFS with GeO2concentration is about−89 MHz/wt%.[26]Liet al.showed that core doping GeO2concentration has a greater influence on the BFS than the core diameter and reducing fiber core diameter will result in a wider BGS bandwidth.[25]The above results are based on the SMF reported. However, the dependence of BGS characteristics on the GeO2concentration and core diameter in large-mode-area (LMA) fibers have not yet been studied in detail.
The purpose of this work is to examine the relationship between the GeO2concentration and the Brillouin gain spectrum characteristics in the LMA fibers. We first numerically simulate the dependence of BFS and BGS bandwidths on GeO2concentration. Then we present the BGS bandwidth as a function of single-pass gain to explain the BGS bandwidth measured in this work under the condition of Brillouin gain narrowing. Moreover,the BGSs are experimentally characterized in four types of fibers with different GeO2concentrations and core diameters of 10µm and 20µm by using heterodyne detection method,indicating the dependence of BFS and BGS bandwidths on GeO2concentration under the same core diameter fiber.Finally,the BGSs of three fibers with core diameters of 10µm,25µm,and 30µm are tested to demonstrate the influence of the core diameter on the BGS bandwidth.
2. Theory
In the kinetics of spontaneous Brillouin scattering, the BGS line is Lorentzian according to the exponential decay of phonons.[27]In a fiber system,spectral density function of the Stokes radiation,S(ω),[28]can be defined as

wherehis the Planck’s constant,Nis the mean number of phonons per mode of acoustic field,ωsis the Stokes frequency,Ais the effective cross-section area, andΓBis the phonon intensity decay rate,ωis the laser frequency,nis the effective refractive index of the pump mode,cis the propagation speed of light in vacuum.Gis the single-pass gain, which can be defined as

whereg0is the peak value of the Brillouin gain,Leffis the effective length,Aeffis the effective cross-sectional area of the interaction region,andPis the incident laser power. The gain factorgcan be defined as
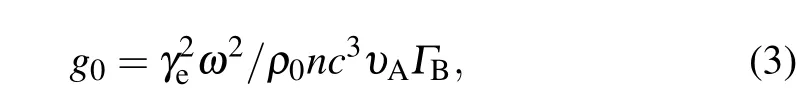
whereγeis the electrostrictive constant of silica,ρ0is the mass density,andυAis the acoustic velocity. As shown in Eq.(1),the spectral shape of the Stokes light depends on the singlepass gainGand the phonon intensity decay rateΓB. The BGS bandwidthΓ=ΓB/(2π) is the full width at half maximum(FWHM)of the BGS,which can be expressed as
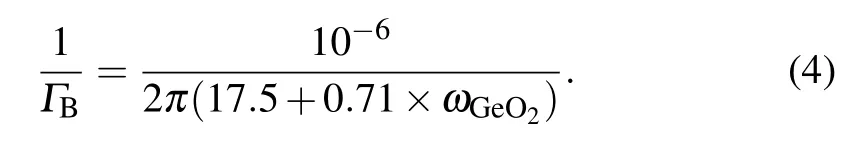
According to Ref.[28],the refractive indexnof the medium,the acoustic velocityυA, and the mass densityρ0vary with GeO2concentrationωGe[in unit wt%]and F concentrationωF[in unit wt%]and can be expressed respectively as[29]
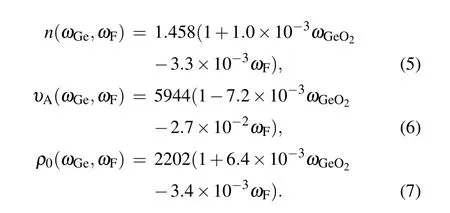
The BGS bandwidth ∆νnarrows as single-pass gain increases,which can be given by[28,30]
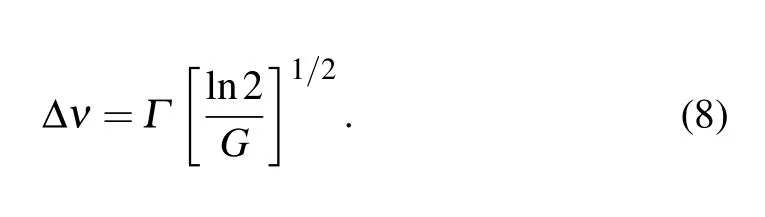
For smallG(such asG<5 Np),the shape of the Brillouin gain spectrum is Lorentzian curve with a bandwidth of ∆ν=Γ.On the other hand,the Stokes spectrum bandwidth has almost no obvious change for largeG(such asG>20 Np).[31]
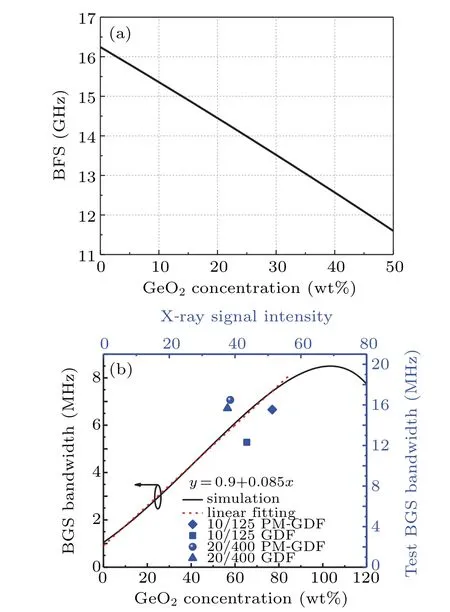
Fig. 1. (a) Simulated BFS versus GeO2 concentration, and (b) calculated BGS bandwidth and tested bandwidth versus GeO2 concentration for four types of fibers.
The generated Stokes frequency depends on the optical and acoustic properties of the propagation material as well as the pump wavelength. The BFS in an LMA fiber can be defined as[32]

whereλis the laser wavelength,andθis the scattering angle of a mode. In the simulation, the influence of the scattering angle on the BFS is ignored. The BFS and BGS bandwidths as a function of GeO2concentration are shown in Figs. 1(a)and 1(b). The parameters and the values used in the simulation are shown in Table 1. Figure 1(a) shows that the BFS is inversely proportional to GeO2concentration and the relationship is linear. Figure 1(b)shows that the BGS bandwidth initially increases linearly and then decreases. The gain factor and single-pass gain will increase when the germanium concentration exceeds 80%, thus causing the narrowed Brillouin bandwidth to decrease. The red line is the linear fit with a slope of 0.085.
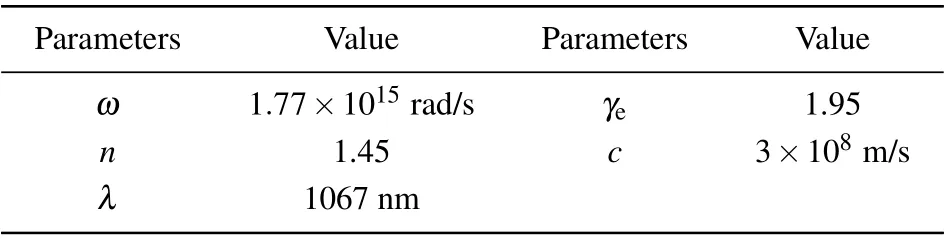
Table 1. Parameters and values used in simulation.
The relationship between Brillouin gain factorg0and GeO2concentration is obtained by substituting Eqs. (4)–(7)into Eq.(3),and the results are shown in Fig.2(a).It is demonstrated that as the GeO2concentration increases,Brillouin gain factor decreases initially, and then increases when the GeO2concertation exceeds 80%. Firstly, the phonon intensity attenuation rate, the refractive index, and the medium density increase faster than the sound velocity decreases, so the gain factor is reduced. With the increase of germanium concentration, the attenuation rate of the phonon intensity, the rate of increase of refractive index, and the medium density are lower than the rate of decrease of sound velocity, as a result,the gain factor has a minimum value, and then gradually increases. The single-pass gain dependence of BGS bandwidth can be obtained based on Eq. (8), and is plotted in Fig. 2(b).The results indicate that as the GeO2concentration increases,Brillouin gain factor initially decreases, and then increases.The Brillouin gain narrowing is shown in Fig.2(b).

Fig.3. Experimental setup of Brillouin gain spetrum measurement. MFA:mode field adapter;YDFA:Yb-doped fiber amplifier;PD:photodetector;RFA:radio frequency analyzer.

Fig. 2. (a) Simulated Brillouin gain factor versus GeO2 concentration, and(b)calculated BGS bandwidth versus single-pass gain G and the experimental bandwidth of fibers with different core diameters.
3. Experimental setup
The BGSs of the LMA fibers are measured. The schematic diagram of the setup is shown in Fig.3.
A 1067-nm,60-mW,3-kHz linewidth(the Rock,NP Photonics) single-frequency fiber laser is used as a light source.The laser signal is amplified to 10 W by a Yb-doped fiber amplifier (YDFA). The output laser is divided into two arms by an 80/20 coupler(coupler 1),where 80%of the laser pass through a circulator,and then connected to the input end of the fiber under test(FUT).All the fibers are in a temperature range of 20◦C–22◦C and maintain the same bend radius to ensure the same experimental conditions. The generated backward Stokes light in the fiber is coupled into the 50/5 coupler(coupler 2)through port 3 of the circulator. The MFAs here is used to adapt the mode field. In the other arm, 20% of the laser acts as the reference light, and the power is controlled by an optical attenuator to maximize the visibility of the beat signal. The backward light and the reference light then beat in coupler 2, and the beat signal is detected by a photodetector(1014,Newport)with a maximum bandwidth of 46 GHz,and analyzed by a radio frequency analyzer (RFA, DSOX4024A,KEYSIGHT).The output end of the FUT is cleaved with 8◦to prevent feedback.
4. Results and discussion
Six passive fibers (I–VI) are investigated in the experimental setup, of which the detailed parameters are listed in Table 2. The input laser power is the output power of the amplifier when the beat frequency output power is 1 mW.The values of single-pass gainGfor all the FUTs are much larger than 25, which means that all the Brillouin bandwidths we tested are gain-narrowed.
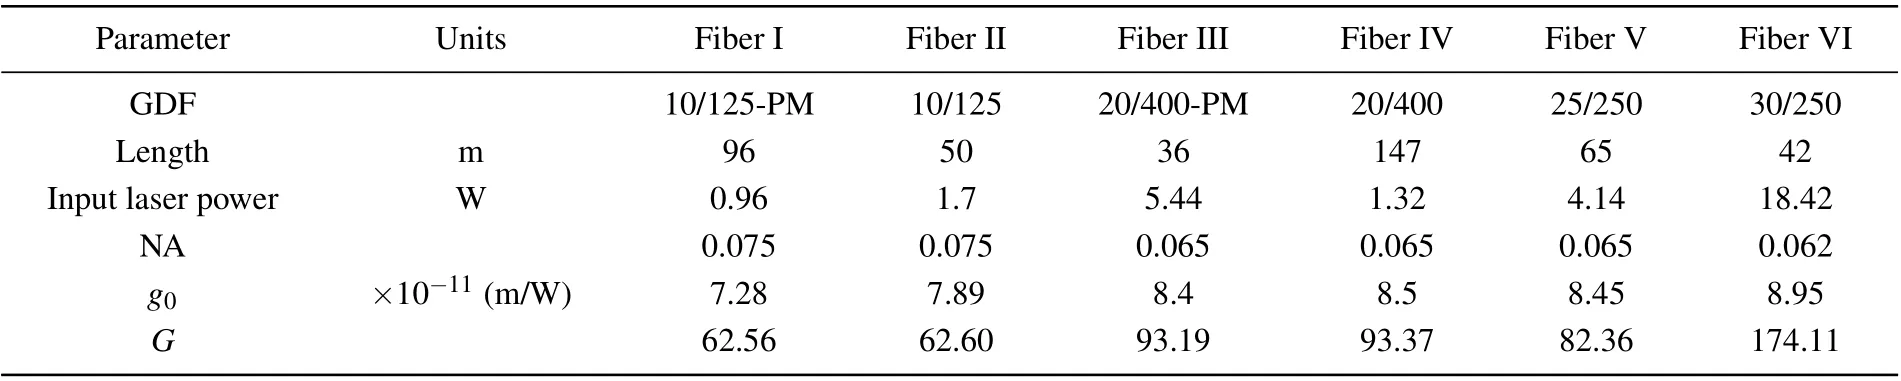
Table 2. Experimental parameters and their values.
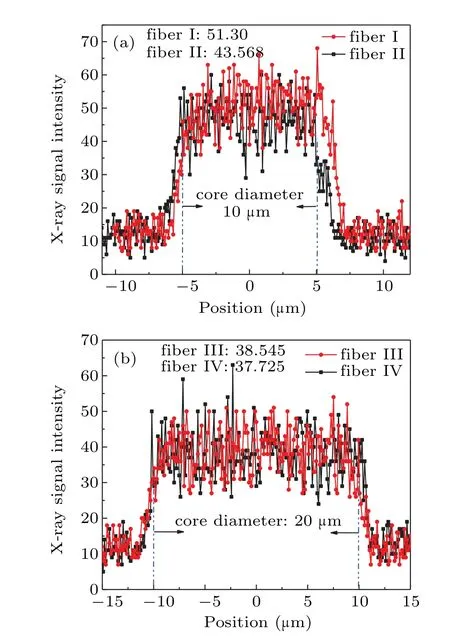
Fig.4. X-ray signal intensity distribution for(a)fibers I and II and(b)fibers III and IV.
For comparing the core germanium concentrations of fibers with the same core diameter,we use the electron probe microanalysis(EPMA)to test the x-ray signal intensity of Ge doped in 10/125 and 20/400 polarization-maintaining and unpolarized fibers(fibers I–IV).The cross-sectional x-ray signal intensity distribution results for the four fibers are shown in Fig. 4. The x-ray signal intensity of each fiber is expressed by averaging the x-ray signal intensities in the core. The xray signal intensity can be used to characterize the germanium doping concentration because it is positively correlated with the content of GeO2in fiber. Figures 4(a)and 4(b)show that the germanium concentration of the polarization-maintaining fiber is higher than that of the unpolarized fiber, and the germanium concentration of the 10/125 fiber is higher than that of the 20/400 fiber.
The BFS and BGS bandwidths for fibers I–IV are measured using the experimental setup shown in Fig.3. Gaussian fitting is performed on the BGS of each fiber and the BFS and Brillouin bandwidth of each fiber are recorded as shown in Fig.5. For fibers I and II as shown in Figs.5(a)and 5(b),the BFSs are 16.065 GHz and 16.102 GHz and the BGS bandwidths are 15.54 MHz and 12.31 MHz, respectively. This difference in BFS can be explained by Eq. (9). The difference in dopant concentration between the two fibers results in the differences in the acoustic velocity and the refractive index. This difference in BGS bandwidth is explained as being due to the fact that the increasing of GeO2will result in a decrease in phonon lifetime and an increase in bandwidth.Although not each group of fibers is tested at the same length and the same input power,it is clear that the output SBS power is the same, and the product of the fiber length and the input power in the polarization-maintaining fiber is larger,which is the opposite to the influence of germanium concentration on the bandwidth. The results indicate that in LMA fibers with the same core diameter,the BFS decreases and the BGS bandwidth increases with the augment of doped germanium concentration in the core. This result is consistent with that of an SMF.[24]The same conclusion is applicable to the fibers III–IV as shown in Figs.5(c)and 5(d). The BFSs are 16.123 GHz and 16.134 GHz, respectively, and the BGS bandwidths are 15.54 MHz and 12.31 MHz,respectively. The BFS and BGS bandwidth changes of the 10/125 fiber are greater than that of 20/400 fiber. The reason for this result is that the difference in germanium concentration between the two 10/125 fibers is higher than that between the two 20/400 fibers.
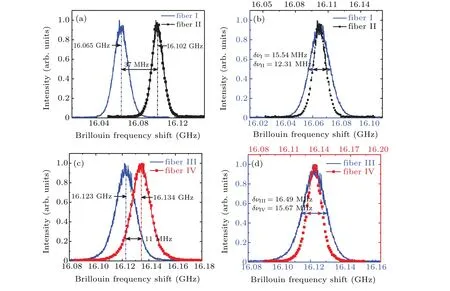
Fig.5. Comparison of(a)BFS and(b)BGS bandwidth gain spectra between fibers I and II.Comparison of(c)BFS and(d)BGS bandwidth gain spectra between fibers III and IV.
The tests of the BGS bandwidth for fibers I–IV are shown in Fig.1(b),which are compared with the simulations. The diamond, square, circle, and the triangle symbols in Fig. 1(b)indicate the tested BGS bandwidth of the fibers I, II, III, and IV,respectively.
The measured fiber bandwidth is positively correlated with the x-ray signal intensity, and the simulated bandwidth is also proportional to the germanium concentration. That is,as the doped germanium concentration in the core increases,the BGS bandwidth increases. However, there is some obvious departure between the tested value and the simulation one. Besides the fact that the coefficients of Eqs. (4)–(6) are not universal, the germanium concentration used in our fiber is not an absolute concentration but the x-ray signal intensity.
Figure 6(a)shows x-ray signal intensities of GeO2doped in the core of three passive optical fibers with different core diameters. The curves represent the x-ray signal intensity distributions in the cross sections of the fibers. The x-ray signal intensity at the core of each fiber is averaged to characterize the core germanium concentration in each fiber.The average x-ray signal intensity in the core of the fibers I,V,and VI are 43.568,38.17, and 34.17, respectively. Result shows that the smallcore fiber has a higher germanium concentration. Figure 6(b)shows the BGS measurement results of three fibers with different core diameters. The lengths of the different fibers range from 20 m to 150 m. We find that the BGSs of three types of fibers all exhibit a Gaussian distribution. The BFS for fibers I,V, and VI are 16.102, 16.138, and 16.168 GHz, respectively,and the BGS bandwidths are 12.31,14.22,and 15.93 MHz respectively. BGS bandwidth is increased by∼2 MHz when the core diameter increases from 10 µm to 30 µm. Fiber I has a higher germanium concentration, but the bandwidth is narrower than that of fiber VI,indicating that the core diameter has a greater effect on the bandwidth than the germanium concentration in the LMA fiber.
We also compare the numerical solution and measured BGS bandwidth of the three fibers with different core diameters, which is shown in Fig. 2(b). It should be noted that single-pass gainGfor each fiber is calculated under the condition that the x-ray signal intensity is regarded as the germanium concentration. The circle, square, and triangle symbols indicate the measured BGS bandwidths of fibers I,V,and VI,respectively. The reason for this difference may be that in an LMA fiber, when pump light is coupled into the fiber, multiple conduction transverse modes can be excited. The Stokes light generated by the inelastic collision of the optical photons with the acoustic phonons in the optical fiber also excites multiple conduction modes. The superposition of multiple modes of Stokes light will broaden the BGS bandwidth. Previous literature has reported[33]that the increasing of the number of optical modes can lead the BGS bandwidth to broaden.
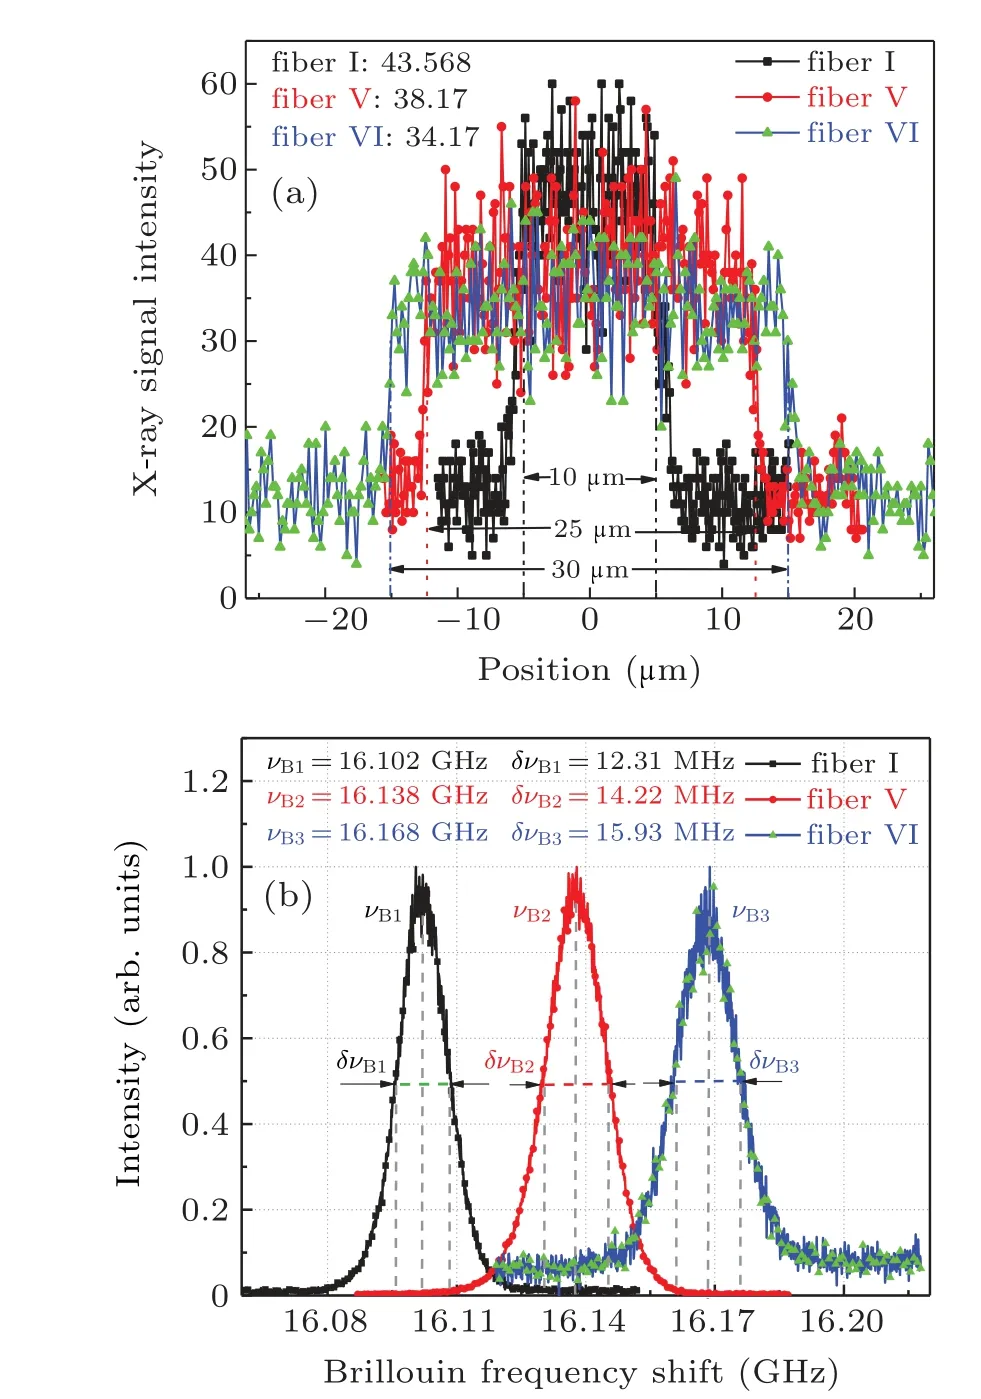
Fig. 6. Comparison among (a) x-ray signal intensities for 10/125, 25/250,and 30/250 fibers and(b)BGSs of fibers for different core diameters.
5. Conclusions
In this work,the dependence of BFS bandwidth and BGS bandwidth on GeO2concentration are simulated. It is shown that BGS bandwidth initially increases, then decreases and BFS decreases as the GeO2concentration increases. We also provide direct experimental evidence that BFS reduces and the linewidth broadens with the increase of germanium concentration in LMA fiber. Moreover, it is demonstrated experimentally that BGS bandwidth increases as the core diameter increases, and that the BGS bandwidth broadening is because the superposition of multiple transmission modes of Stokes light in LMA fibers causes the entire Brillouin scattering spectrum to broaden. This work will provide reference for multiwavelength Brillouin lasers.
猜你喜欢
Chinese Physics B(2023年1期)2023-02-20
做人与处世(2022年2期)2022-05-26
天天爱科学(2022年4期)2022-05-23
当代陕西(2022年5期)2022-04-19
思维与智慧·上半月(2022年4期)2022-04-08
当代陕西(2019年9期)2019-05-20
小哥白尼(野生动物)(2018年4期)2018-08-01
红岩(2017年6期)2017-11-28
连环画报(2016年10期)2016-12-16

- Chinese Physics B的其它文章
- Transient transition behaviors of fractional-order simplest chaotic circuit with bi-stable locally-active memristor and its ARM-based implementation
- Modeling and dynamics of double Hindmarsh–Rose neuron with memristor-based magnetic coupling and time delay∗
- Cascade discrete memristive maps for enhancing chaos∗
- A review on the design of ternary logic circuits∗
- Extended phase diagram of La1−xCaxMnO3 by interfacial engineering∗
- A double quantum dot defined by top gates in a single crystalline InSb nanosheet∗