
Optimal control strategy for COVID-19 concerning both life and economy based on deep reinforcement learning∗
2021-12-22 06:48WeiDeng邓为GuoyuanQi齐国元andXinchenYu蔚昕晨
Chinese Physics B 2021年12期
关键词:齐国
Wei Deng(邓为) Guoyuan Qi(齐国元) and Xinchen Yu(蔚昕晨)
1Tianjin Key Laboratory of Advanced Technology in Electrical Engineering and Energy,School of Control Science and Engineering,Tiangong University,Tianjin 300387,China
2School of Mechanical Engineering,Tiangong University,Tianjin 300387,China
Keywords: COVID-19,SIHR model,deep reinforcement learning,DQN,secondary outbreak,economy
1. Introduction
As of April 13, 2021, the number of diagnosed cases of COVID-19 worldwide reached 137 941 696, and at least 2 967 745 individuals have died from this virus since the first report in December 2019.[1]According to the research,[2]the new coronavirus is highly contagious with a relatively low case fatality rate, and has a long asymptomatic infection period. The infected individuals in the incubation period can infect normal people without any symptoms.[3]Therefore,the most effective measure to prevent the rapid spread of COVID-19 is nucleic acid detection, isolation measures and travel tracing.[4]However, extreme blockade measures have disastrous consequences for economy. The quarantine policy may be an effective short-term measure. However, the indefinite quarantine before the vaccine is released and put on the market on a large scale will prevent billions of people in the world from earning income,especially in countries with a more vulnerable economy, leading to an increase in the mortality rate of low-income people,[5]especially children.[6]
Dynamic and mathematical models that simulated the spread of diseases can guide government policymakers to mitigate the detrimental consequences of the epidemic.[7]Many researchers have analyzed and predicted the spread of the epidemic by adopting the improved Susceptible-Exposed-Infectious-Recovered (SEIR).[8–11]Fanget al.simulated the transmission of COVID-19 and the impact of quarantine measures on the epidemic.[8]Mandalet al. established the Susceptible-Exposed-Quarantined-Infectious-Recovered (SEQIR) model in Ref. [9], and formulated reliable epidemic prevention and control measures through the optimal control methods. Huanget al. studied the consequences of relaxing control measures in Spain.[10]Yuet al. proposed the SIHR model in which the parameters were designed as piecewise functions in lockdown time, and studied the possible secondary outbreaks after India loosened control.[11]Wanget al.proposed a novel epidemic model based on two-layered multiplex networks to explore the influence of positive and negative preventive information on epidemic propagation.[12]Huanget al. proposed a new vaccination update rule on complex network to discuss the role of vaccine efficacy in the vaccination behavior.[13]Ronget al.studied the dependence of model parameters on the basic reproduction number.[14]Cuiet al.studied individuals’effective preventive measures against epidemics through reinforcement learning.[15]Tonget al.adopted agent-based simulation to assess disease-prevention measures during pandemics.[16]Some researchers have also adopted machine learning to predict the COVID-19,but have not considered the epidemic control.[17–19]
In the literature above and the latest research of COVID-19, economy is not considered in the model of SEIR. Under the economic pressure caused by strict quarantine measures in the epidemic,some countries have pursued a balance between epidemic prevention and control and economic recovery. To accurately predict the spread of COVID-19 and evaluate consequences beyond the epidemic itself,the model must consider how quarantine measures may affect the economy.[20–24]However,to our best knowledge,there has been no model concerning preventing both peoples’lives and economic development that impacts the people’s welfare. We can regard the control of the epidemic and the economy’s development as an optimal control problem.
Deep reinforcement learning (RL) is a machine learning technique that combines the perception ability of deep learning with the decision-making ability of the RL.Compared with other traditional decision-making optimization algorithms,the RL can realize model-free self-learning of high-dimensional mapping relationships from state to action. The RL is widely used in self-driving, optimal scheduling, path planning and other fields to solve optimal control problems.[25–27]Mnihet al.[28]introduced Deep Q-Network(DQN)that combines the deep neural networks and the RL. The DQN is an effective method of deep RL.Compared with traditional RL,the DQN can effectively improve learning efficiency in situations where the state space is too large or the environment is unknown.The balance between the retraining of the epidemic of Covid-19 and economic development is decision-making and policy optimization.Therefore,choosing the advanced method of the DQN to make an optimal policy is of great value and necessity.At present,most of the research on COVID-19 has mainly been devoted to giving analysis and prediction of the development trend of the pandemic. However, we have not found an optimal strategy for economic development and epidemic prevention and control using deep RL through searching references.
In this paper, the SIHR model is adopted to simulate the spread of the epidemic, aiming to study the development of COVID-19 at different stages. The contribution and innovation of this paper are as follows.
(i) An economic model affected by epidemic isolation measures is established. The development of the epidemic can be roughly divided into five stages, according to the government’s response measures and the trend of newly diagnosed cases. The effective reproduction number and the eigenvalues at the equilibrium point are introduced to verify the effectiveness of the model.
(ii)Based on the deep reinforcement learning method of DQN,the blocking policy to maximize the economy under the premise of controlling the number of infections as much as possible is studied. The abilities of different countries to resist economic risks by adjusting the reward coefficient are simulated. From this,the optimal control policy of different countries is formulated.
The remainder of this paper is organized as follows. In Section 2, the deep RL based on the DQN is introduced. In Section 3, a training experiment of deep RL based on the SIHR-based compartment model is designed. Section 4 studies the optimal policy in different conditions and adopts the optimal policy at different time points. In Section 5, a summary is made.
2. Deep reinforcement learning
Deep RL is a machine learning technique that combines the perception ability of deep learning with the decisionmaking ability of reinforcement learning.[29]Figure 1 shows the general framework of deep RL. Deep neural network obtains target observation information from the environment and provides state information. The RL takes environmental feedback as input and returns a policy that maximizes the timediscounted expected future rewards.

Fig.1. Deep reinforcement learning framework.
2.1. Markov decision process
The government’s policy on COVID-19 can be approximately modeled as a Markov decision process (MDP). In a Markov process,we assume that the government does not fully understand their situation and what measures should be taken next.It only considers its current state and takes action leading to a new state. The MDP usually consists of four parts:O(observation state space),A(set of possible actions),P(transition probabilities),andV(set of value of the reward). At the stateot, the government takes the actionatand transfers from the current state to the next stateot+1with probabilityp. Finally,the government gets a rewardvtfor its action. This process can go on,or it can stop at a terminating state.
The strategyπrepresents the probability distribution of actionAin each stateO. The goal of RL is to find an optimal economy-life balanced strategyπ∗that maximizes the cumulative rewardVπthrough continuous interaction with the environment
As the system environment changes,the method of calculating cumulative rewards will also be changed. In round tasks such as formulating a policy over a period of time, we usually useT-step of cumulative rewards,

whereEπ[·]is the expectation under the strategyπ.
2.2. Calculation of value function
For a strategy,the value function can predict the cumulative reward that the government policy will obtain based on the current state in the future,which will bring great convenience to RL. For theT-step cumulative reward, given the current stateoand actiona,the state-action value function is the longterm reward expectation generated under the guidance of the strategyπ,which can be defined as
From this,we can get the Bellman equation

We can see that the state-action value function can be expressed in a recursive form.
For all state-action pairs, there is an optimal strategyπ∗to obtain the maximum expected return value. The strategyπ∗is called the optimal strategy that can balance economic recovery and epidemic prevention and control, and its state-action value function can be defined as

The Bellman equation changes to

2.3. Deep Q network algorithm
When the state space of the environment is vast, or the model is unknown,it is too costly for the government to obtain the value function using state transition functions or tables. It is necessary to approximate the value function through a nonlinear function approximator such as the deep neural network.This nonlinear function approximator can effectively store the experience accumulated by the government in adopting different policies. Equation(7)shows the updating process of theQfunction in table format,

The DQN algorithm uses a deep neural network to approximate theQfunction,and equation(8)shows the updating process of its value function,

whereαis the learning rate,andwis the weight of the neural network.
When training a neural network,we use the mean square error to define the error function

To get the maximumQvalue, we use the stochastic gradient descent method to update the parameters. We get the optimal strategy based on

In the DQN training process,parameter selection and evaluation actions based on the same target value network will lead to overestimatingQvalue during the learning process, which will lead to more significant errors in the result. There are two groups of neural networks with different parameters and the same structure in double DQN.The online network is used to select the action corresponding to the maximumQvalue,and the target network is used to evaluate theQvalue of the optimal action. The target formula is as follows:

Double DQN can separate action selection and strategy evaluation by using two sets of neural networks.In this way,we can estimate theQvalue more accurately and improve the speed of convergence.
3. System model and scene construction
3.1. Epidemic model and economic model
The SIR dynamic model was firstly used for studying the Black Death in 1927.[30]The SIR-liked model has been widely adopted to simulate the spread of various infectious diseases.To simulate the spread of COVID-19 in different stages, we adopt the SIHR model[11]and add the isolation rate related to government quarantine measures.On this basis,we also establish an economic model affected by the quarantine measures.The following assumptions are needed:
i)The community population is a closed system.
ii)Everyone in the population is susceptible.
iii)All the infected individuals enter the hospital for treatment.
iv)Everyone in the population is not vaccinated.
v)Ignore the impact of virus mutation on the transmission rate.
The total populationNis composed of the susceptible individuals(S),the infected individualsI(latent individuals and those capable of spreading the coronavirus), the hospitalized individualsH(diagnosed patients diagnosed by the hospital),the recovered individualsR(immune to the coronavirus) and the dead individualsD. A schematic description of the model is depicted in Fig.2.

Fig.2. Flow diagram of the dynamic system of COVID-19.
Some susceptible individualsSwill be infected by contacting the infectiousI(inflowI), and the transmission rateα(t) indicates the possibility of infection per infector transmitting the disease to the susceptible.lrepresents the isolation rate that is mandated by the government and execution of people in the closed region. And the higherl, the lower isolation, andl=0 means the infectious route is completely cut off.Nis the total population andN=S+I+H+R+D.Yet,due to the limited diagnostic resources,only a portion of people could be diagnosed, soβ(t) indicates the probability of diagnosis. After being diagnosed, the patients are almost entirely isolated, so they would not be transmitted to others.The diagnosed infectorsIreceive treatment to reduce because of the recovery rateγ(t)and the mortality rated(t)caused by the disease,and the recovered individuals are not be infected if they have developed an immunity. The cumulative diagnosed cases can be expressed byC(t)=H(t)+R(t)+D(t). The following equations summarize the spread-prevention-infection dynamics model:
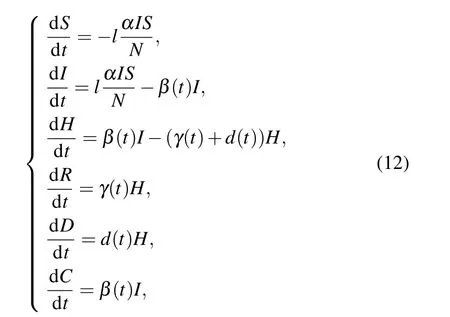
wherel,α,β(t),γ(t),andd(t)respectively represent the rates of isolation,transmission,diagnosis,cure,and death based on the infectious disease model.β(t),γ(t),andd(t)are designed as Sigmoid cumulative functions 1/(1+ek(t−τ))composed ofk,τ,andtin different stages,kis usually positive inβ(t),γ(t),and negative ind(t), which means that theβ(t)andγ(t)will increase astincreases, while thed(t) is just opposite. The parameters setting above was given by Ref.[11].
In the economic model, populations’ production will be affected by the lockdown measures.Compared with economic indicators such as gross domestic product (GDP), we only consider the wealth created by individuals, not the economic growth brought about by consumption.In our simulation,populations can be divided into two types:those whose productivity is highly damaged by quarantine and those whose productivity is less damaged.The total economic output is the sum of the outputs of all the individuals in the environment minus the medical expenses for treating patients. The individuals who are not isolated have normal productivity,isolated individuals lose a high percentage of their productivity (represent byη),dead individuals have no productivity, and hospitalized individuals have no productivity and pay for treatment. The following economic outputGper capita is proposed:

whereηandµrepresent the reduced productivity per capita and average treatment expense,respectively.
3.2. Indictors of controllability and stability of spread
In terms of the controllability of the epidemic, the basic reproduction number(R0)measures the probability of the disease being transmitted to other populations through naive populations in initial stage (Ronget al., 2020). A real-time indicator in measuring the spread risk and the controllability of the spread is effective reproduction number (Re(t)).[31]In Eq.(12),Re(t)can be expressed as

where−∆S(t) and ∆C(t) represent the net newly infectious individuals and the net newly diagnosed infections.
From the perspective of stability of the SIHR model, we solve the equilibrium point of the model(12)as(S∗,0,0,R∗,D∗,C∗),whileS∗,R∗,D∗,C∗can be any positive numbers less thanNand satisfyN=S∗+R∗+D∗,C∗=R∗+D∗.Under the premise of considering the stability of the epidemic, we can modify the model(12)as

and assume thatX=(S I H R D). Now equation(15)can be expressed as
whereBrepresent the 5×5 matrix to the right-hand side of Eq.(15). The characteristics equation ofBat the equilibrium point can be expressed as

Then we can obtain the following eigenvalues:
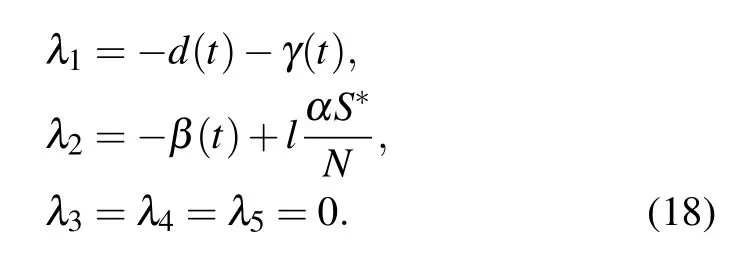
Here we observed thatλ1<0 and we give a specific example to analyze the role ofλ2andRe(t) in the spread of the epidemic. Supposing a closed area has 65 500 000 people, 500 unquarantined virus carriers, 100 diagnosed cases, no deaths and recovered cases in the outbreak stage. Figure 3 shows the simulated results with fixedβ(t)=0.10,α=0.5,and varyingl.
From Fig. 3, we can observe that the newly diagnosed cases ∆C(t) shows a single wave, the correspondingλ2andRe(t) decline. Moreover,λ2>0 andRe(t)>1 indicates that the newly infected cases increase and exceed the newly diagnosed cases, which means that the risk of spread of the pandemic may exists temporarily, and the system (15) will be in divergence. The biggerλ2andRe(t)are,the faster ∆C(t)will grow. Conversely,λ2<0 andRe(t)<1 indicate the decline of ∆C(t), which means the epidemic is under control and the system will be finally stable. The smallerλ2andRe(t) are,the faster ∆C(t) will decline. It is worth noting that in the case ofλ2≡0 andRe(t)≡1,∆C(t)will be a constant,which also means the infected individualsIwill not increase further.Therefore,λ2andRe(t) accurately depicts the stability and controllability of the system (15) and pandemic and further prove the effectiveness of the SIHR model. These results also indicates that the spread of the epidemic can be effectively affected by the quarantine measuresl,which is conducive to the establishment of the reward function.

Fig.3. Simulated results with varying l and fixed β(t)=0.10,α =0.5,(a)the newly diagnosed cases,(b)effective reproduction number,(c)eigenvalues of equilibrium point.
3.3. Preconditions for RL training
Due to the constraints of physical conditions, the degree of public cooperation, system time lag and other factors, the following assumption must be considered:
(I)The government needs to formulate a long-term quarantine policy, after at leastNdays, the government could change the isolation measures.
(II) The government needs to implement different quarantine measures to deal with the changing situation of the epidemic. The quarantine ratesl1,l2,l3,l4represent the quarantine measures after the gradual unblocking in the state of emergency.
(III)The system is updated in days. The number of diagnosed cases, deaths and the recovered cases will change with timet,and the smallest unit of timetis a day.
3.4. Space and reward function
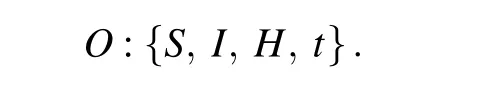
When selecting statespace parameters, the performance improvement brought by an excellent new state information is significantly higher than that of other work. Similarly, some irrelevant interference information will have a counterproductive effect. The impact of dead individuals and recovered individuals on the epidemic is minimal, so they are not used as a statespace parameter. Statespace parameters include susceptible individualsS, infectious individualsI, hospitalized individualsHand timet. The observation state space is expressed as
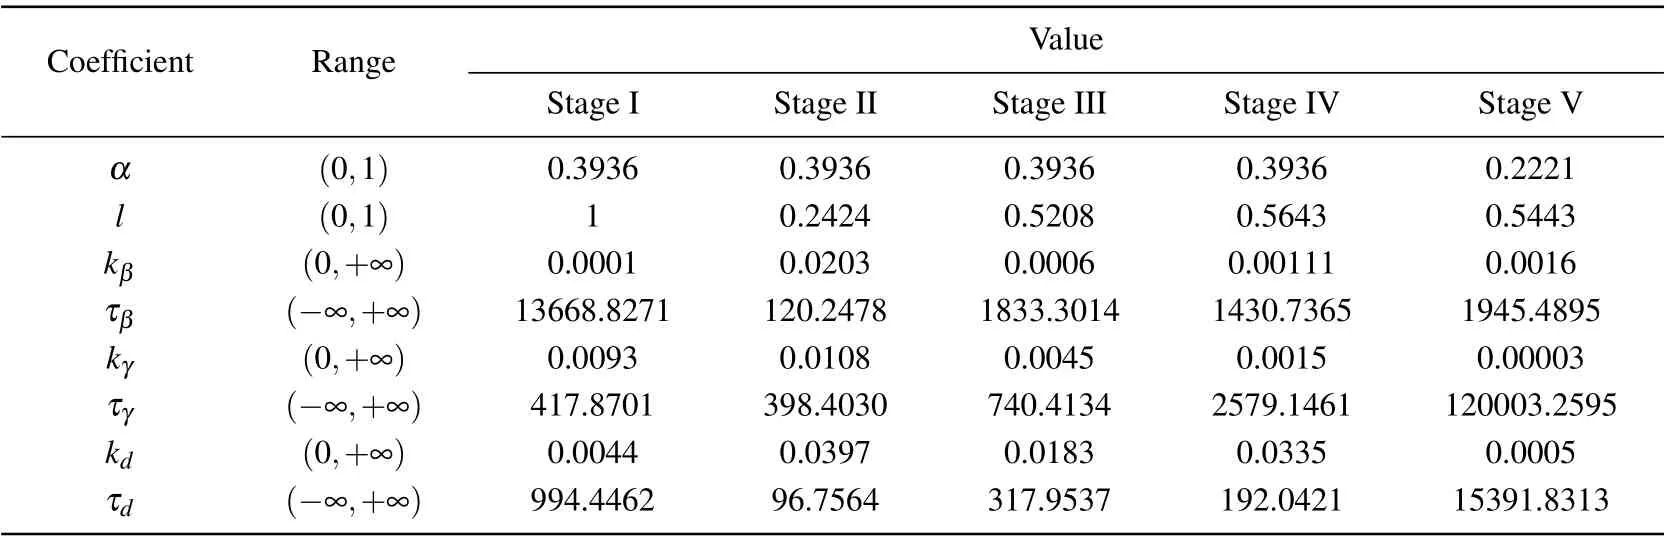
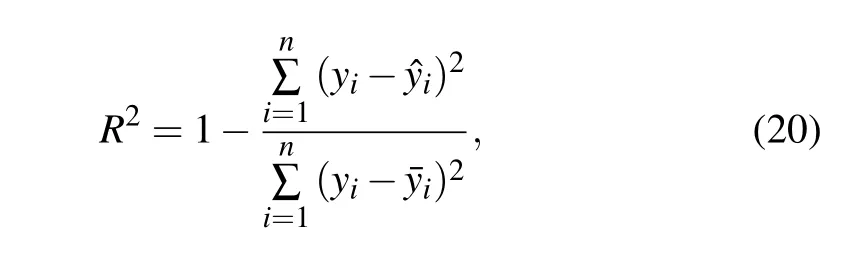
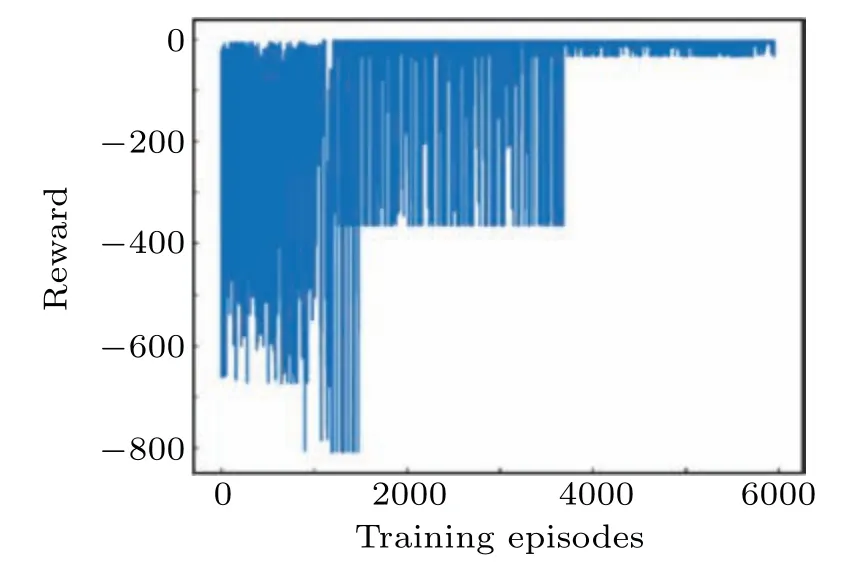
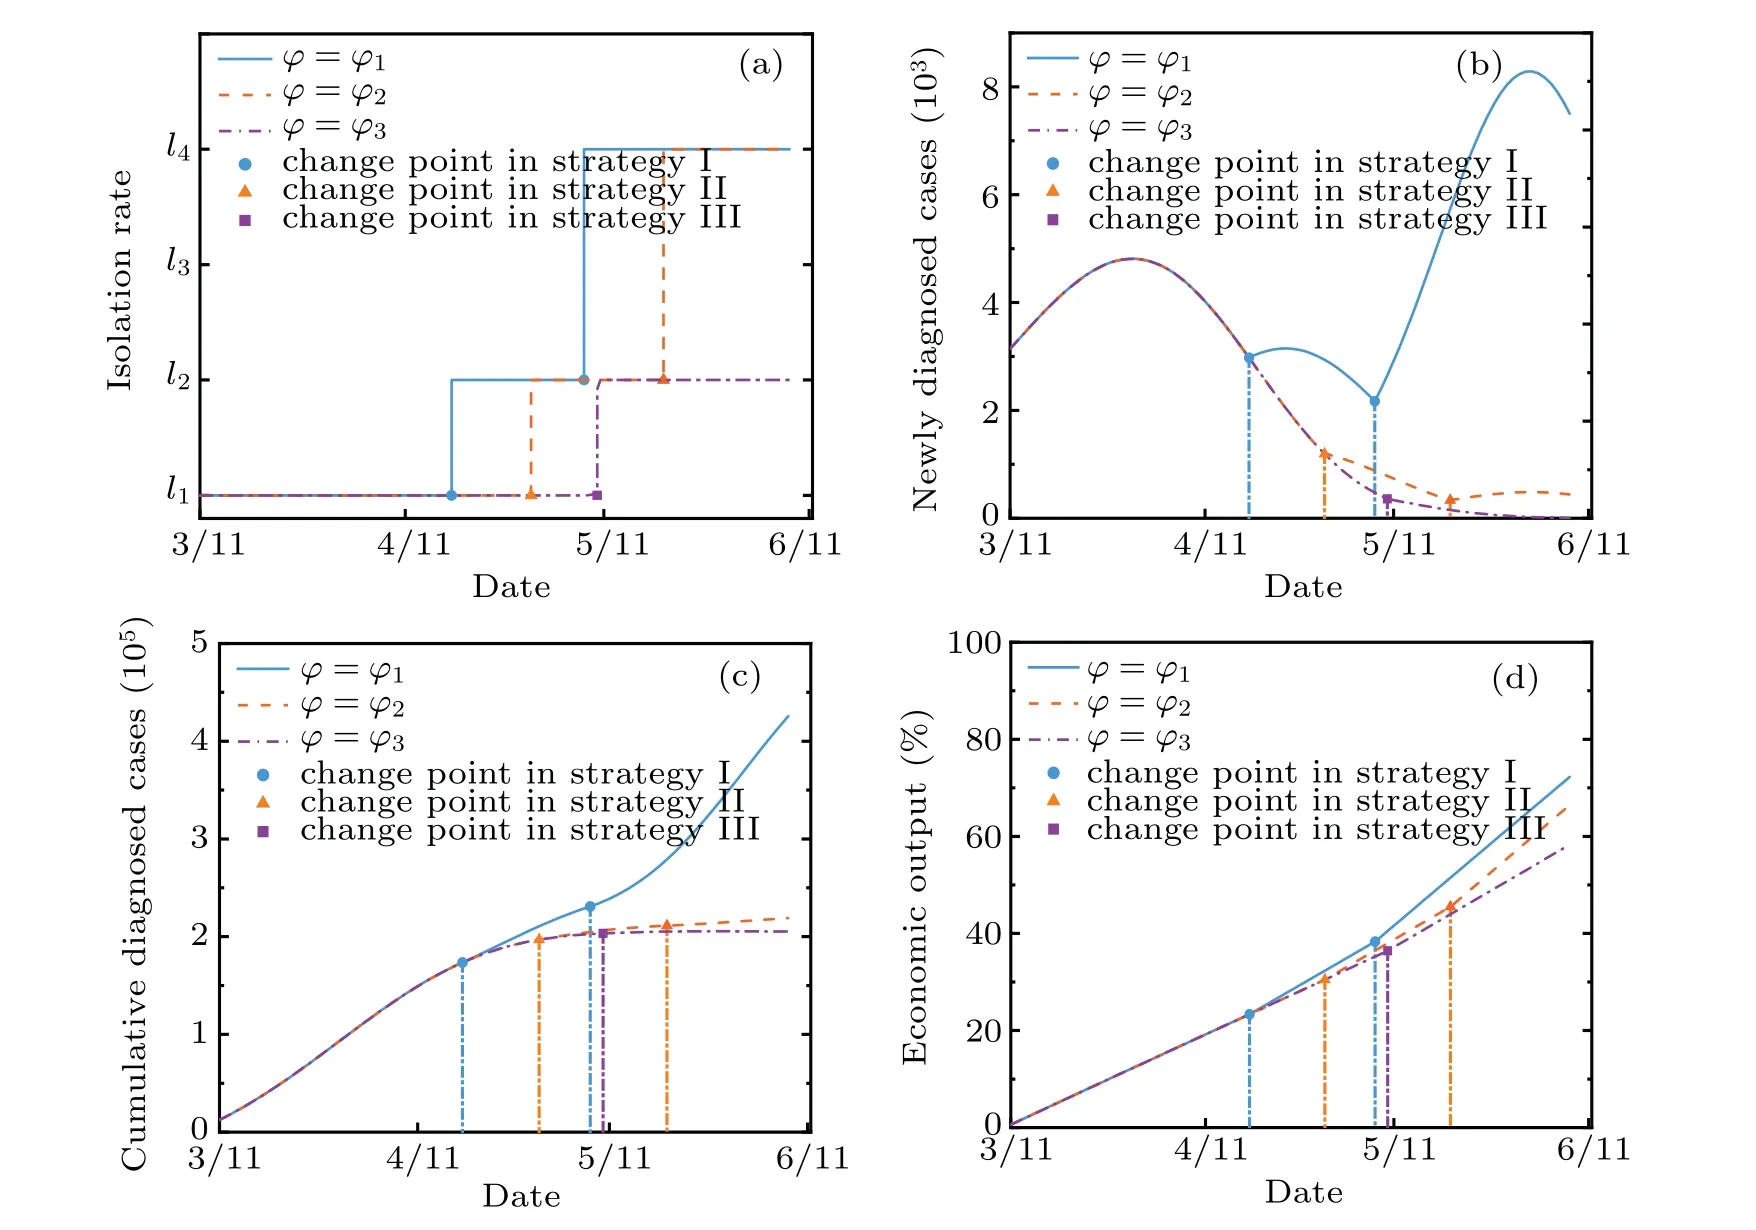
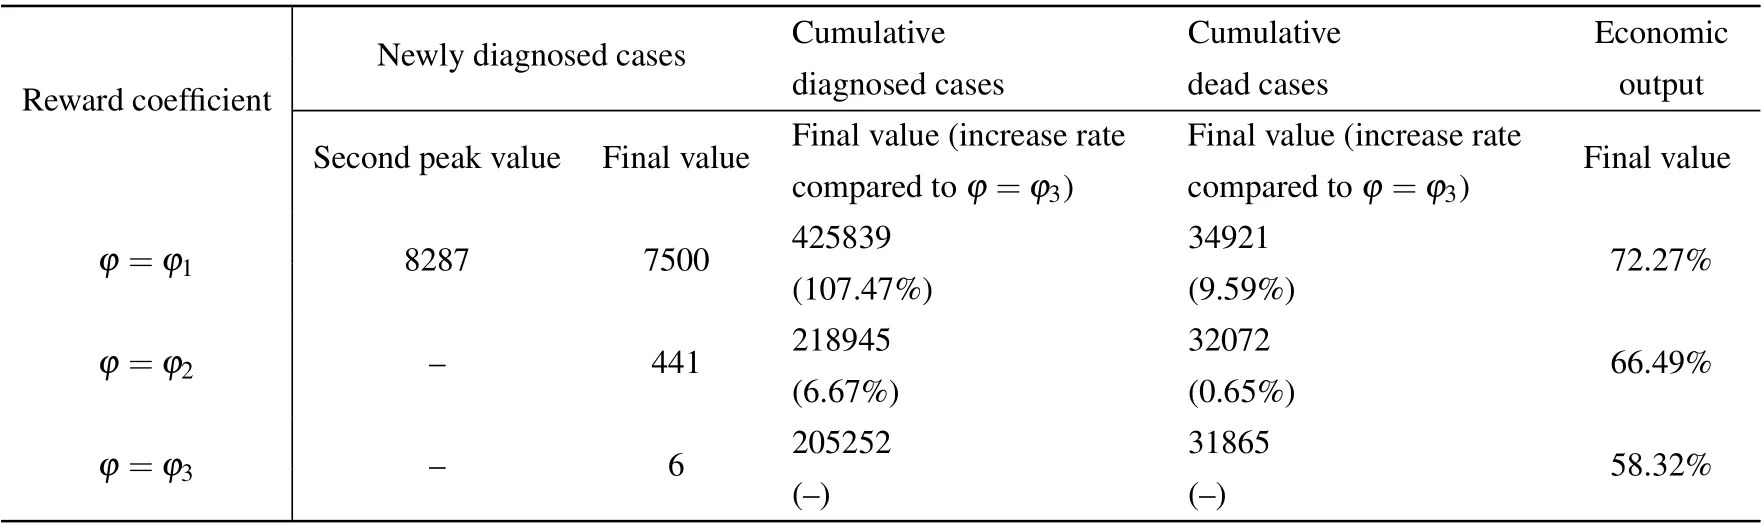
Action space includes isolation rates corresponding to isolation measures of different strengthsl1,l2,l3,l4andl1 Besides, the isolation ratelrepresents the actionathat the government can perform,which meansa=l. The reward function penalizes the increase of the number of diagnosed cases,and also rewards the cumulative economic output.v−(st,at)ensures that the epidemic can be controlled,v+(st,at) ensures the maximization of cumulative gross production value. The reward function is expressed as wherev+(st,at)=G,v−(st,at)=ϕC/N, andϕis the reward coefficient, representing the government’s emphasis on the economy. In this paper,we propose a short-term economy-life optimal algorithm based on deep RL,and its overall flow is shown in Fig.4. I)The original COVID-19 data is divided into several different stages to fit the SIHR model. Then the model is used to provide training data for RL, which can simulate the development of the epidemic under different government policies.The better the model fitted,the more reference value the optimal policy. II)The optimal policy derived from RL is mainly affected by the reward function. The reward coefficientϕrepresents the government’s emphasis on the economy. Therefore, the optimal strategy for different countries can be formulated by adjusting theϕ. Fig.4. Algorithm flow chart. It is noted that most countries are still suffering from the epidemic. The COVID-19 is far from over until the vaccine is successfully developed and put on the market on a large scale. Therefore, it is significant to adopt deep RL to study the economic-epidemic balance policies of different countries.According to the government’s response measures and the trend of newly diagnosed cases,the COVID-19 can be roughly divided into five stages: Stage I Outbreak stage. At the beginning of the epidemic, the government ignored the severity of the epidemic.The number of newly diagnoses has increased rapidly. Stage II Lockdown stage. The government implemented a strict isolation policy. The number of newly diagnoses peaked and began to decline. Stage III Gradually unblocking stage. The number of newly diagnoses has further decreased. The government began to unblock the city to recover the economy gradually. Stage IV Buffer stage. During this stage,the number of infections remained at a low level. But there is still a risk of an outbreak. Stage V Second or third outbreak stage. The number of newly diagnoses increased again after reaching the bottom,and the epidemic broke out again. The stage of the epidemic in different countries is shown in Fig.5. As shown in Fig.5,China and Iceland have entered the buffer stage early, and there has been no secondary outbreak. After entering the controllable stage of the epidemic,most European countries experienced a second outbreak. Fig.5. Stage of COVID-19 in different countries. Table 1. Fitting results of parameters. Fig. 6. Fitting curve and reported data, (a) cumulative confirmed cases, (b) newly diagnosed cases, (c) cumulative cured cases, and (d)cumulative dead cases. We notice that the Italian data is very representative.Therefore, we use data from different stages in Italy as the training data for the RL. Here, we fit the parameters ofl,α,β(t),γ(t), andd(t) by using the least square functionsfminconandlsqnonlinof Matlab.[14]The Italian government began to vaccinate the people on December 27,the number of vaccinated people(2 doses)reached 4 055 458(6.8%of the population)by April 13.[32]To avoid the influence of the vaccinated individual,twenty sets of data from February 22 to November 10 in Italy are used to fit the model. Figure 6 shows the fitting curve and the reported data. The model-based parameters by fitting the reported data are shown in Table 1. From Fig.6,we can see that the development of the epidemic in Italy can also be roughly divided into the above five stages. The fitting results are excellent, and the curve fits the real data. As shown in Table 1,the transmission rateαis usually fixed in different stages of an epidemic,and only changes during the second or third outbreak stage.The quarantine ratelrepresents the intensity of the government’s policy in response to the epidemic.lis different at each stage, but in a round of the epidemic,it first declines and then rises.This phenomenon shows that the government always locks down cities when the epidemic is severe and releases the lockdown to restore the economy after the epidemic eases. The diagnosis rateβ(t)and the cure rateγ(t) increase over time, while the mortality rate is the opposite. It is noted that in the second round of the epidemic,althoughlis nearly unchanged andαis significantly lower than the previous stage,a second outbreak still occurred.This phenomenon is due to the relaxation of vigilance by the government and the public during the second outbreak stage,resulting in a significant decrease in the diagnosis rate compared to the previous stage. Hidden virus carriers were not isolated,which led to a second outbreak. We adopted the coefficient of determinationR2to evaluate the goodness of the fitting results,[11]and the closer theR2is to 1, the better the fitting results. TheR2can be expressed as whereyi, ˆyi,and ¯yirepresent the value of reported data,average value of reported data, and the fitted value in Italy from February 22 to November 10. Table 2 shows theR2of the cumulative diagnosed cases,daily diagnosed cases,recovered cases, and dead cases. The mean ofR2at different stages reached more than 0.84 and most value ofR2reached more than 0.9 or even 0.99. These results indicate that our model can fit the real data well, which is conducive to the training process of deep reinforcement learning and come up with an effective scheme. Table 2. Goodness of fitting results. On the premise of controlling the spread of the epidemic,recovering the economy as much as possible has become a concern for governments of many countries. We take the first day of the Italian government’s lockdown (March 10) as the starting point, 90 days later as a round, and assume that the government can take new quarantine measures at least 20 days after. Based on the TensorFlow framework,a fully connected neural network with a 3-layer network structure as theQ-value network of DQN has been designed. The input layer is a 5-dimensional feature tensor, including susceptible individualsS, infectious individualsI, hospitalized individualsH, timetand actiona. The hidden layer has five layers of the network,with each layer of the network having 20 neuron nodes. The output layer is a 4-dimensional tensor,which represents theQvalue of different actions (l1,l2,l3,l4). The memory buffer capacity is 10 000,and the random batch size is 64. We use the e-greedy strategy to train the agent,[22]which helps the government obtain a better strategy. The agent randomly explores actionsain the initial stage,and gets the corresponding reward valuevafter performing the actionato update theQvalue of Eq.(3). As the training progresses,it gradually replaces random exploration with network predictions.The agent selects the actiona=lwith the maximumQvalue of Eq.(6)in the output layer of the neural network and sends it to the SIHR model of Eq.(12)as the isolation rate at the next moment. Figure 7 shows the agent’s performance after 6500 episodes of training(90 days after the initial date is episode).In each episode,the agent made 90 action choices and updated the parameters in the neural network. The abscissa represents the number of training episodes, and the ordinate represents the rewards obtained by the agent in each episode. The result shows that as the number of training rounds increases,the agent gets convergent and steady rewards,which indicates that the agent already has some intelligent features. Figure 8 shows the optimal control strategy and epidemic development trend obtained by the agent after 20 000 episodes of training. We provide four isolation rates, as shown in Fig. 8(a), corresponding to the government’s isolation measures in different training periods. The agent decides to select which isolation rate according to the training. Consequently,figures 8(b), 8(c), and 8(d) show the newly diagnosed cases,the total diagnosed cases,and the cumulative dead cases after the government took quarantine measures using the deep RL. Fig. 8. Impact of government’s control after March 11 on, (a) isolation rate based on isolation measure, (b) newly diagnosed cases, (c)cumulative diagnosed cases,and(d)economic output compared to the pre-epidemic period. Fig.7. Training process. Figure 8(a)shows the optimal selection using the deep RL training. From Figs.8(a)and 8(b),in the outbreak stage when the newly diagnosed cases are increasing,the strategy given by the agent tends to adopt the most stringent isolation measures in the early stage of the epidemic becausel1that is the least number in the early stage is taken. After the epidemic is basically controlled,the agent recommends gradually lifting the lockdown measures to recover the economy.In the unblocking process,the isolation rate rises froml1tol2,then skipsl3and directly rises tol4.The rate of decrease in the number of newly diagnosed patients slowed down,but after the second release,the number of newly diagnosed people rose slightly.However,as the government stepped up the virus detection measures,the number of newly diagnosed people continued decreasing. In Fig.8(d),we can see that as the government gradually relaxes the isolation measures, the economic growth rate has also increased. These results indicate that the government should immediately adopt the most severe isolation measures in response to the rapidly spreading epidemic. In the process of gradual unblocking,the time and degree of unblocking not only affect the speed of economic recovery, but also determine whether there will be a second outbreak in the future. After accumulating experience through thousands of training episodes, the RL can formulate effective prevention and control strategies for the epidemic. Considering the differences in the industrial structure and economic risk resistance of different countries,too strict isolation measures may bring greater risks to economically vulnerable countries. Therefore, the epidemic prevention and control policy should be combined with the conditions of different countries. What is directly related to the government’s concern for the economy is the reward coefficientϕin the reward function.The reward coefficient will affect the weight of the economy in the reward function—the smaller theϕ,and the more economical the policy. We take different reward coefficientsϕ1,ϕ2,ϕ3(ϕ1<ϕ2<ϕ3)for training under the assumption that other parameters are unchanged. Figure 8 show the optimal policies and the trend of the epidemic under differentϕ. Figure 9(a) compares the isolation rate corresponding to the optimal control scheme under different parametersϕ. The smallerϕis, the more emphasis is on recovering the economy,and the earlier the first unblocking and gradual unblocking. And in the case ofϕ=ϕ3, the degree of unblocking is more conservative. Figures 9(b)and 9(c)show the trend of the newly diagnoses and total diagnoses under different strategies.Compared with the reward coefficientϕ3, the final cumulative diagnosed cases ofϕ1,ϕ2were increased by 107.47%and 6.67%, respectively, and the cumulative dead case increased by 9.59%and 0.65%,respectively. Asϕdecreases,the isolation measures become more relaxed,leading to that the newly diagnosed case and the cumulative diagnosed case increase.And a second outbreak occurred forϕ=ϕ1,which is the consequence of striving to recover the economy in the short term.Figure 9(d)shows the trend of economic output under different strategies. Compared with the reward coefficientϕ3, the final economic output ofϕ1,ϕ2were increased by 8.17%and 18.95%,respectively. With the decrease ofϕ,the average isolation rate decreases,which means more people are engaged in production activities, and the cumulative gross product value increases. Table 3 compares the specific data. Compared with theϕ2,the final economic output ofϕ1is not much higher,and it pays a huge price with the much higher hospitalized people and deaths. Part of the reason is that the second outbreak has led to more diagnosed cases and medical expenses. Fig.9. Impact of government’s control after March 11 in different ϕ,(a)isolation rate based on isolation measure,(b)newly diagnosed cases,(c)cumulative diagnosed cases,and(d)economic output compared to the pre-epidemic period. Table 3. Comparison of data of different reward coefficients on March 11. These results show that based on different reward coefficientsϕ, the epidemic control strategies given by the agent after training are also different. The smaller theϕ,the weaker the country’s ability to resist risks in the economy. The economy in short term will be more considered when formulating policies. The time for unblocking will come earlier and the intensity of unblocking will be greater, which will lead to an increase in the diagnosed cases and even a second outbreak.However, economically biased policies can only reduce economic losses in the short term. In the long term, looser policies will lead to more diagnosed cases and deaths,and a higher probability of recurrence will lead to a longer duration of the epidemic,which will delay the economic recovery. The above policies have one thing in common: the government implemented lockdown measures in the early stages of the outbreak to avoid significant medical expenses and deaths caused by the increasing diagnosed cases. We assume that the government did not lock down the city to maintain the economy and only adopted minimal quarantine measuresl2within 90 days after March 11. Figure 10 compares the economic growth curve of this policy and the optimal strategy recommended by the agent. It can be seen from the figure that although the adoption of loose quarantine measures can achieve rapid economic growth in the short term,as the number of diagnosed cases and deaths further increases, medical expenditures increase. The growth rate of the economy slowed down and reached an inflection point on April 24,which means that most of the population in the environment has been diagnosed and hospitalized without considering the carrying capacity of the medical system. They were unable to work,and the medical expenses exceeded the economic output of the whole society,and the economy began to grow negatively. After the epidemic was basically controlled,the economy of negative policy began to grow again,but the speed was significantly lower than the optimal strategy. Compared with the optimal policy given by the deep RL, the economic output decreased by 37.8%under the negative policy that the government adopted minimal quarantine measurel2. Fig.10. Economic output curve under different control strategies. The above results indicate that whether it is from the perspective of ensuring economic growth or controlling the spread of the epidemic,the strictest isolation measures should be taken during the outbreak stage when the newly diagnosed cases increasing rapidly. When the epidemic is under control,gradual unblocking will help recover the economy. Due to the economic pressure caused by the long-term lockdown, European countries have gradually unblocked the city after the epidemic was basically under control. However,there have still been some virus carriers in the environment.The epidemic is far from over until the vaccine is successfully developed and put on the market on a large scale. As time passed,the newly diagnosed cases in most European countries,including Italy,began to rebound,and the epidemic entered the second outbreak stage or even the third outbreak stage. The conclusions we got in the first outbreak stage are still applicable to the second or third outbreak stage. Specific government policies can be given after the RL training. In this section, we have set September 26, October 6, and October 16 as the starting date for the government to adopt isolation measures to study the impact of the control strategy on the epidemic and economy on the different dates of the second outbreak stage. From Fig. 11, although the control strategy on different dates has little effect on the epidemic’s duration,the sooner control measures are taken, the fewer cumulative diagnosed cases and cumulative dead cases,and the higher the total economic output. Table 4 compares the specific data. In Fig. 11(a), after the government implemented lockdown measures, the number of cumulative diagnosed cases began to slow down and eventually stabilized. Besides, in Figs.11(a)and 11(b),compared with the date of lockdown on September 26,the final cumulative diagnosed cases of October 6,and October 16 were increased by 17.54%and 64.37%,respectively, and the cumulative dead case increased by 4.94%and 15.81% respectively. According to Fig. 11(c), the later the government takes lockdown measures,the greater the economic loss,even if the government can obtain more economic growth in the early stage. The reason for this phenomenon is that the later the government lockdown the country, the more infections and hospitalizations in the environment, and the time for unblocking will be later,which will lead to more significant economic losses. The results indicate that if the government can take effective prevention and control measures in time during the second explosion, it can effectively reduce the number of people infected with the epidemic and ensure continued economic growth. Although the policy of balancing economy and epidemic has controlled the spread of the epidemic,the virus carriers in the population have not completely disappeared. If the government relaxes inspections or the people’s awareness of epidemic prevention declines, the epidemic may break out again. Therefore, the government should strengthen personal nucleic acid testing and establish the case tracing mechanism to increase the diagnosis rate. Fig. 11. Impact of the same reward coefficient on: (a) cumulative diagnosed cases, (b) cumulative dead cases, and (c) economic output compared to the pre-epidemic period. Table 4. Comparison of data after adopting optimal policy at different dates. At present, the global COVID-19 epidemic is still severe. More and more countries have experienced second or even third outbreaks. The epidemic is far from over until the vaccine is successfully developed and put on the market on a large scale. Under the premise of controlling the spread of the epidemic, how to ensure economic development as much as possible has become a major problem considered by many countries.In the above research,we improved the SIHR model to simulate the spread of COVID-19 in Italy at different stages and the determination coefficientR2is used to evaluate the goodness of the fitting results. On this basis, we established an economic model affected by the quarantine measures. We used the effective regeneration number and the eigenvalues at the equilibrium point of the model as indicators of controllability and stability of model.We adopted the DQN-based deep reinforcement learning method and introduced the cumulative diagnoses and cumulative gross production value into the reward function as rewards and punishments. After adequate training, an economy-life balanced policy at different stages of the epidemic was formulated. The research results show that our model and scheme are effective,to control the spread of the epidemic effectively,the government should adopt the most stringent blockade measuresl1during the outbreak stage,and the timetfor unblocking should be determined by the country’s ability to resist economic risks. These results also suggest that optimal policies may differ in various countries dependent on the level of disease spread and anti-economic risk abilityϕ. For example,in countries with more vulnerable economies and a lower transmission rateα, the consequences of the disease may be less than those of other countries. In contrast, the consequences of blockade policies may cause an economic crisis which will lead many people to be unemployed and difficult to live.In the second outbreak stage,the sooner the lockdown measures are taken, the smaller the losses caused by the epidemic will be.Although the economic outputGwill suffer in the short term,it will benefit the long term. The research is not only applicable to Italy,but also provides references for other countries to formulate policies.Similarly,deep reinforcement learning can also be applied to different models. When the model is closer to the real world,the optimal strategy given by deep reinforcement learning will be more accurate. Data availability statement The data that supports the findings of this study are available within the article[and its supplementary material].

3.5. Economy-life optimal algorithm

4. Experimental results and analysis


4.1. Control strategy during outbreak stage

4.2. Control strategy in different situations in outbreak stage

4.3. Public policy in different time points of the second outbreak stage


5. Conclusion
猜你喜欢
数学大王·趣味逻辑(2021年6期)2021-09-27
小天使·二年级语数英综合(2020年9期)2020-12-23
小天使·三年级语数英综合(2020年4期)2020-12-23
小学阅读指南·低年级版(2020年4期)2020-06-15
小天使·三年级语数英综合(2018年10期)2018-10-16
陶瓷科学与艺术(2018年1期)2018-07-13
神州·时代艺术(2017年6期)2018-01-13
儿童故事画报(2016年2期)2016-04-18
中国领导科学(2015年10期)2015-02-05
领导文萃(2013年22期)2013-08-15

- Chinese Physics B的其它文章
- Transient transition behaviors of fractional-order simplest chaotic circuit with bi-stable locally-active memristor and its ARM-based implementation
- Modeling and dynamics of double Hindmarsh–Rose neuron with memristor-based magnetic coupling and time delay∗
- Cascade discrete memristive maps for enhancing chaos∗
- A review on the design of ternary logic circuits∗
- Extended phase diagram of La1−xCaxMnO3 by interfacial engineering∗
- A double quantum dot defined by top gates in a single crystalline InSb nanosheet∗