
Mode structure symmetry breaking of reversed shear Alfvén eigenmodes and its impact on the generation of parallel velocity asymmetries in energetic particle distribution
2022-03-10 03:49GuoMENG孟果PhilippLAUBERXinWANG王鑫andZhixinLU卢志鑫
Plasma Science and Technology 2022年2期
Guo MENG(孟果),Philipp LAUBER,Xin WANG(王鑫)and Zhixin LU(卢志鑫)
Max-Planck-Institut für Plasmaphysik,D-85748 Garching,Germany
Abstract In this work,t he gyrokinetic eigenvalue code LIGKA,the drift-kinetic/MHD hybrid code HMGC and the gyrokinetic full-f code TRIMEG-GKX are employed to study the mode structure details of reversed shear Alfvén eigenmodes(RSAEs).Using the parameters from an ASDEXUpgrade plasma,a benchmark with the three different physical models for RSAE without and with energetic particles(EPs)is carried out.Reasonable agreement has been found for the mode frequency and the growth rate.Mode structure symmetry breaking(MSSB)is observed when EPs are included,due to the EPs’non-perturbative effects.It is found that the MSSB properties are featured by a finite radial wave phase velocity,and the linear mode structure can be well described by an analytical complex Gaussian expressionwith complex parameters σ and s0,where s is the normalized radial coordinate.The mode structure is distorted in opposite manners when the EP drive shifted from one side of qmin to the other side,and specifically,a non-zero average radial wave number 〈ks〉 with opposite signs is generated.The initial EP density profiles and the corresponding mode structures have been used as the input of HAGIS code to study the EP transport.The parallel velocity of EPs is generated in opposite directions,due to different values of the average radial wave number 〈ks〉,corresponding to different initial EP density profiles with EP drive shifted away from the qmin.
Keywords:reversed shear Alfvén eigenmode,symmetry breaking,energetic particles,nonperturbative effects
1.Introduction
Alfvén eigenmodes can be excited by the energetic particles(EPs)in tokamak plasmas and may limit the achievable EP concentration in the plasma core due to radial transport.Various theoretical and numerical methods have been developed for the modelling of EP transport[1-6].Previous perturbative models calculate the linear mode structure without considering EP kinetic effects and give a good estimate of the linear growth rate and saturation level when the growth rate is much smaller than the real frequency[7].A special case is then=1 fishbone,for which the assumption of perturbative EP effect on the MHD step-function mode structure still holds,while non-perturbative EP response is important for the correct assessment of modefrequency and growth rate[8].The EPs’ non-perturbative effects on Alfvén mode broadening was theoretically predicted in[9,10],and has been observed from gyrokinetic simulations of EP driven Toroidicity induced Alfvén eigenmodes(TAEs)[11-13],and thus,an enhanced EP transport was observed.The‘distortion’ of the 2D mode structure has been also observed experimentally by electron cyclotron emission imaging(ECEI)[14-16],and the 2D ECEI data has been used to compare with simulation results to identify the Alfvén eigenmodes excitation and to verify the various codes with experiments[17].
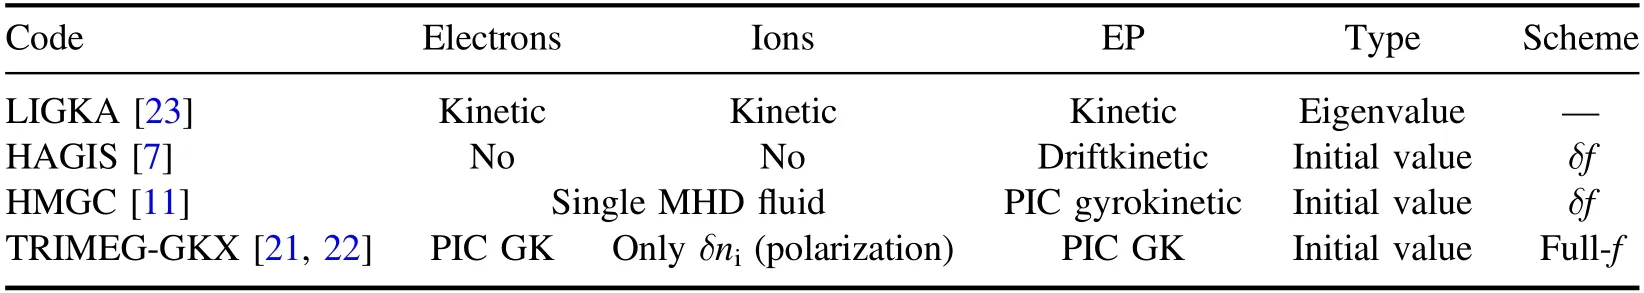
Table 1.Comparison of simulation models used in this benchmark.
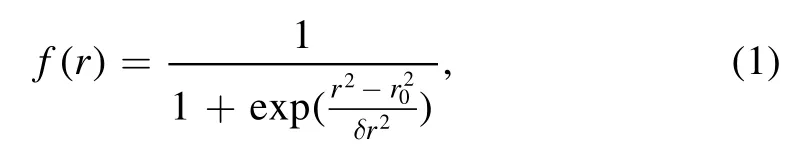
For identifying the origin and the consequence of the mode structure distortion,recent work shows that the up-down asymmetry of the 2D mode structure can be induced by EP's non-perturbative effect[18,19],and can change the EP transport properties,especially the parallel velocity profiles[20].As shown in our previous work[19,20],a complex Gaussian representation of the mode structurewith complex parameters σ ands0is adopted to describe the nonperturbative symmetry breaking features,wheresis the normalized radial coordinate.The mode structure symmetry breaking(MSSB)of the reversed shear Alfvén eigenmodes(RSAE),especially imaginary part of the parameters0,has an important effect on EPs parallel velocity profiles[20].The complex radial wave vector iswhose real part represents the wave propagation in radial direction.By employing gyrokinetic simulations,it is shown that the mode location of the TAE driven by EPs depends on the EP gradient location[13].Nevertheless,the MSSB of beta induced Alfvén eigenmode is related to the distance between the location of the maximal EP drive(i.e.the maximum radial gradient)and the rational surface as shown in simulations and analytical studies[19].These studies show that both the Alfvén mode location and propagation change due to the EPs’non-perturbative contributions.
In this work,RSAEs driven by EPs and the related EP transport are studied by hybrid and gyrokinetic codes based on ASDEX-Upgrade parameters.The gyrokinetic full-f(fis the distribution function in phase space)code TRIMEG-GKX[21,22],gyrokinetic/MHD hybrid code HMGC[11,12]and gyrokinetic eigenvalue code LIGKA[23]are employed to identify the quantitative connection between the MSSB and the EP profiles such as the maximum EP drive location.For RSAE,the location of the maximum EP drive with respect to the location of the minimumqsurface is the key parameter that determines the MSSB.This paper is organized as follows.In section 2,we list the physical models and the parameters used in the simulations.In section 3,the RSAE simulations without EPs have been benchmarked by the three codes.Then,the RSAE symmetry breaking due to non-perturbative EP effects has been compared by the three codes and quantitative parameters describing the mode symmetry breaking properties are fitted.The EP transport due to the interaction with RSAE has been studied using HAGIS[7]with the more consistent mode structure and EP profiles.In section 4,a summary and an outlook for EP driven MSSB work are given,with emphasis on its impact on EP transport,especially in future burning plasmas.
2.Simulation models and parameters
In this work,the EP non-perturbative effects on mode structures and EP transport are studied using several codes.While the EP-AE interaction takes place as a resonance phenomenon that requires a kinetic treatment of the EPs,the bulk plasma can be treated with different levels of approximations.The gyrokinetic codes are closest to first principles with the most important physics included,but require long simulation times and consume significant amount of computing resources,especially when studying the nonlinear,multiple spatial and temporal scale physics[13,21,24].A variety of codes made specific simplifications to achieve the balance between the computational cost and important physics.Hybrid codes such as HMGC[11,12],M3D-K[25]and MEGA[26]treat background plasma as MHD and EPs as a kinetic species.This simplification allows the simulations to tackle long time scale physics such as abrupt massive loss of EPs[27].As a further simplification,the Alfvén mode structure and frequency can be taken as fixed and only the wave-particle interaction is kept for studies of the saturation and transport levels of EP driven Alfvén modes[7].In this paper,we demonstrate the studies using the LIGKA,HAGIS,HMGC and TRIMEG-GKX codes,which are based on different simulation models.
2.1.Physical models
Following our previous theoretical and numerical work[19,20],we focus on the effects of MSSB on EP transport.As a new aspect in this work we consider more realistic AE mode structures for the further analysis in order to assess the importance of the MSB effects in present-day experiments.In the complex Gaussian expressionof radial envelope,the MSSB parameters σ ands0are obtained by fitting the radial mode structures simulated by the gyrokinetic eigenvalue code LIGKA[23],the initial value hybrid MHDgyrokinetic code HMGC[11,12]and the full-fgyrokinetic code TRIMEG-GKX[21,22].With the more consistent σ,s0as the input of HAGIS[7]code,the EP transport is studied.The four codes employed in this work are briefly described as follows.We summarize the important properties of the employed codes in table 1.
2.1.1.LIGKA and HAGIS.The LIGKA code[23]has been originally developed as a non-perturbative,linear gyrokinetic eigenvalue solver.The quasi-neutrality equation and the gyrokinetic moment equation together with the gyrokinetic equation for the particle distribution functions form a consistent model and are solved for electromagnetic perturbations in tokamak geometry[28].It can use the precalculated orbits from the HAGIS code to integrate the kinetic equations for all species(electrons,ions and fast ions).Finite Larmor radius(FLR)effect and the finite orbit width(FOW)effect are taken into account up to 4th order[29],consistent with the small parameterk⊥ρt,EP≪1,where ρt,EPis the EP Larmor radius.For this work,the analytical coefficients as given in[29]are used,and the nonlinear eigenvalue problem is solved using an inverse vector iteration method[30].
HAGIS[7]is an initial value particle code.HAGIS uses the linear AE information as given by LIGKA.The implementation in the ITER Integrated Modelling&Analysis Suite(IMAS)framework[31]enables the convenient access to the experimental data and the interface with other codes.In HAGIS,particles are pushed according to the guiding centre’s equation of motion,and the wave-particle nonlinearity is modelled via the Lagrangian equation of the wave-particle system.The non-perturbative mode structures,frequencies and damping rates can be taken from the simulation results of LIGKA code,HMGC code or TRIMEG-GKX code.
2.1.2.Hybrid code HMGC.The code HMGC[11,12]is a hybrid MHD-gyrokinetic code.It describes the bulk plasma by a set of nonlinear reduced MHD equations expanded to the third order of inverse aspect ratio O(∊3)[32],where ∊≡a/R0is the inverse aspect ratio,aandR0are the minor and major radius,respectively.Thus,the HMGC adopts a equilibrium with circular shifted magnetic surfaces,also assuming zero bulk plasma pressure,Te=Ti=0.This is the case we consider in this work,although there is an extended version of the HMGC which can treat thermal electrons as massless fluid and thermal ions as a driftkinetic species[33].The EPs are described by the nonlinear driftkinetic equations,and coupled in the momentum equation of the bulk plasma[34]via the divergence of the pressure tensor term of the EP species.Due to the underlying O(∊3)-reduced MHD equations,the reference equilibrium analyzed by HMGC is reshaped to a circular one with ∊=0.1.
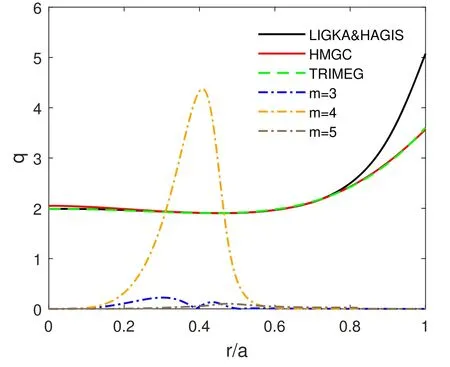
Figure 1.A typical mode structure and q profiles.The q profile agrees well for r ∈[0.1a,0.8a]withqmin=1.903at r/a=0.451.
2.1.3.Gyrokinetic full-f code TRIMEG-GKX.TRIMEG is a TRIangular MEsh based Gyrokinetic code with multiple species.It is originally developed using δfmethod and the electrostatic kinetic model,using particle-in-cell in the poloidal plane and a particle-in-Fourier scheme in the toroidal direction[21].It has been extended to handle electromagnetic kinetic problems including kinetic electrons using a full-fmethod,named TRIMEG-GKX[22].The implicit particle-field solver has been developed in order to treat the fast parallel motion and large accelerations of electrons in the ‘symplectic(v‖)’ formula,and to avoid the numerical issues which corresponds to the ‘cancellation problem’ in the ‘p‖’ formula.The finite element method is applied in radial direction and the Fourier decomposition is used in the toroidal and poloidal directions.Correspondingly,the particle-in-cell is used in the radial direction and the particle-in-Fourier in the poloidal and toroidal directions.A certain amount of Fourier harmonics are kept in poloidal and toroidal directions.In this work,we keep then=2 toroidal harmonic and the poloidal harmonics in the range ofm∈[2,6]for RSAE simulation.
2.2.Parameters
We use a circular equilibrium with Grad-Shafranov shift with parameters matched to ASDEX-Upgrade in the same way as in previous studies[20]with LIGKA and HAGIS.We use flat density and temperature profiles for both electrons and ions,i.e.ne=ni=1.71×10¹⁹m-3,Te=Ti=2 keV.The equilibrium used in HAGIS and LIGKA is the same as in our previous studies[20].As radial coordinate we usewhere ψpolis the poloidal flux and ψpol,edgeis the poloidal flux at plasma edge.When converting the flux surface coordinates to the normalized radius,we use the normalized radial coordinate r=r/a,whereris the radius of flux surfaces,anda=0.4696 m is the radius of last closed flux surface.Other parameters are as follows:major radiusR0=1.666 m,magnetic field strength at axis isB0=2.208 T.The Alfvén velocity isvA=8.265×10⁶m s-1.The minimum ofqisqmin=1.903atsmin=0.494while(HAGIS and LIGKA use the same circular equilibrium with Grad-Shafranov shift.Radial coordinatesFor HMGC,we use the nominalabut an inverse aspect ratio ∊=a/R0=0.1.TRIMEG-GKX uses concentric circular magnetic flux surfaces.Theqprofiles used in different codes are shown in figure 1,together with a typical RSAE mode structure.Theqprofiles used in all codes agree well forr∈[0.1a,0.8a]withqmin=1.903atr/a=0.451.
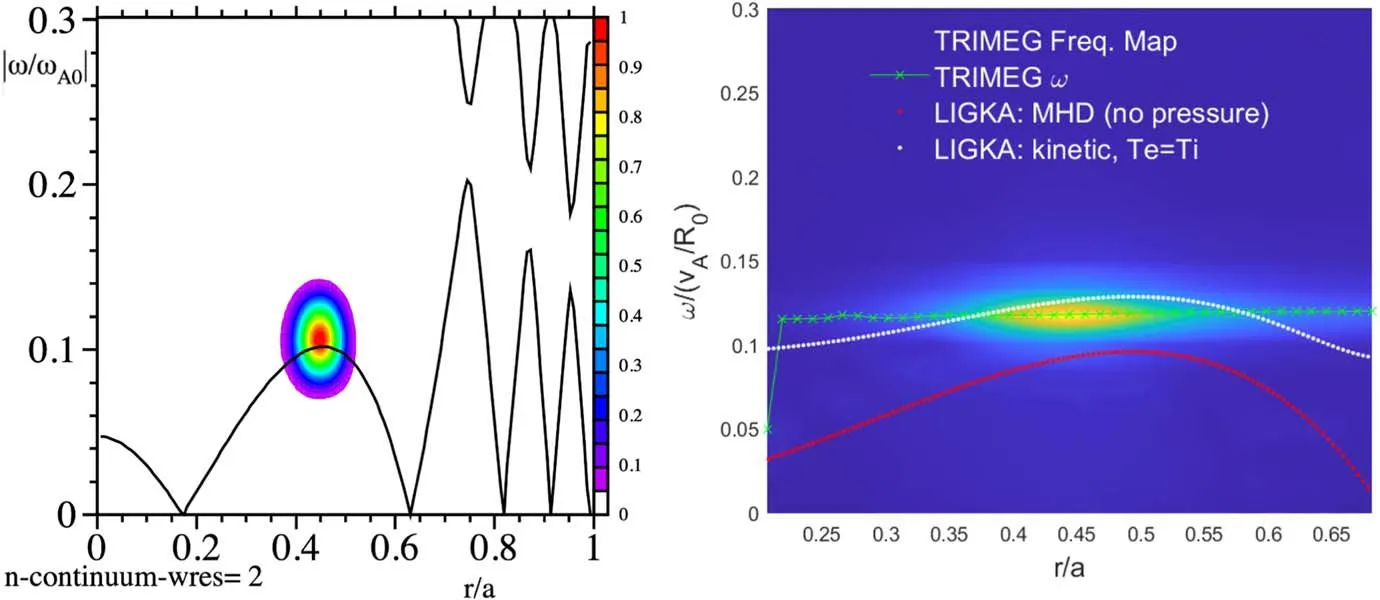
Figure 2.Left:antenna excitation of n=2,m=4 RSAE using HMGC.Alfvén continua and frequency spectrum w/o thermal ion pressure.Right:spectrum of the scalar potential in the(r,ω)plane obtained from TRIMEG-GKX simulation(with kinetic electron and polarization ion density perturbation).The green cross dots are the fitted mode frequency.The shear Alfvén continuum of n=2 is calculated by LIGKA.The same continuum for MHD(no pressure)and that including the thermal ions and electrons kinetic effect(Te=Ti)are shown by red and white dots,respectively.

Table 2.Mode frequency.
3.Simulations and analyses
3.1.Linear results w/o EP benchmarked by LIGKA,HMGC,TRIMEG-GKX
The simulations of RSAE without EPs are benchmarked using LIGKA,HMGC,and TRIMEG-GKX.In HMGC,an antenna is used to excite the weakly damped ideal MHD RSAE in the simulations.In TRIMEG-GKX,a density perturbation is initialized and the simulation runs until clear and steady mode structure is generated and the mode frequency is measured by fitting the wave phase.The simulation is with only kinetic electron and the ion response is described with the polarization density perturbation.As described above,the LIKGA employs an inverse vector iteration method to calculate the mode structure and its complex frequency.
The left frame of figure 2 shows the HMGC results of antenna excitation of the RSAE.The Alfvén continuum and frequency spectra are calculated w/o thermal ion pressure.On the right frame of figure 2,the color map of the spectrum of the scalar potential in the(r,ω)plane is from TRIMEG-GKX simulation.The green cross dots are the fitted mode frequency.The shear Alfvén continua ofn=2 are calculated by LIGKA.The red dot line is them=4 branch in the reduced MHD limit and the white dot line is up-shifted due to the inclusion kinetic effects related to the finite background pressure.Next,the frequencies and mode structures from LIGKA,HMGC and TRIMEG-GKX are compared.As shown in table 2,the mode frequency agrees very well.The imaginary part of the mode structure’s radial profile is negligible(LIGKA and TRIMEG-GKX)or much smaller than(HMGC)the real part,indicating the relatively(compared with the EP driven RSAE in the next section)up-down symmetric 2D mode structure when no EPs are applied,as shown in figure 3.The inverse aspect ratio(∊)of 0.1 has been used in HMGC and thus the frequency gap at the TAE frequency is smaller than that for the nominal value.The mode width from HMGC in figure 3 is smaller than those from LIGKA and TRIMEG-GKX.
3.2.EP profiles for different nEP curvatures at qmin
In the following part,EP driven RSAEs are simulated.A Maxwellian EP distribution withE0=40 keV is used.Different EP radial density profiles are chosen to investigate the nonperturbative EP effects.Three typicalnEPprofiles referred to as‘inner’,‘standard’and‘outer’cases are used in the simulation as shown in figure 4.The EP radial density profile is
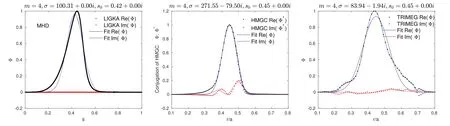
Figure 3.Mode structures from LIGKA(left),HMGC(middle)and TRIMEG-GKX(right)without EPs applied.

Figure 4.EP density profiles for standard,inner and outer drive cases.
wherer0and δrindicate the center and the width of the EPs’radial profile.The EP density at magnetic axis of the standard and outer cases isnEP,0=9.163×10¹⁷m-3.The on-axis parameters are:vEP/vA=0.1686,ρt,EP=1.3114 cm,andnEP,0/ni≈0.05,whereis the EP thermal speed and ρt,EP=mEPvEP/eBis the gyro-radius.The EP gradient is relatively localized for the inner and outer cases;the EP profile of the standard case with a wider full width at half maximum(FWHM)is the same as in our previous study[20].The gradient of the density,dnEP/dratqminis similar for the inner,standard and outer cases;the second derivative of EP density,d2nEP/dr2has an opposite sign atqminfor inner and outer cases.By adopting these EP radial profiles,the EP drive is shifted away fromqminandΔr=r0-rqminindicates the distance from EP drive toqminas shown in table 3.The density at axisnEP,0of the inner case is 1/2 of the standard and outer cases,then the linear growth rate is similar for three cases.With the uniform EP temperature and the EP density profiles shown in figure 4,thevolume average beta of EP for inner,standard and outer cases is 0.0223%,0.0871%and 0.0925%,respectively.The effect of EP on equilibrium is ignored.
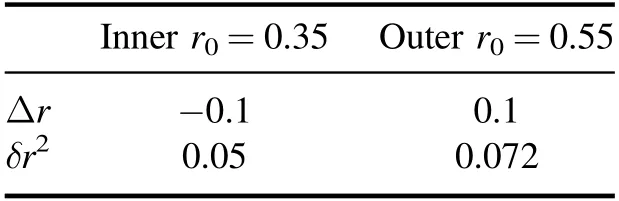
Table 3.EP drive distance of inner and outer cases.
3.3.MSSB due to non-perturbative EP effects
The workflow of the numerical studies is introduced in this section,by making use of the different codes,namely,LIGKA,HMGC and TRIMEG-GKX.The purpose of this workflow is to make maximum use of physics models with different levels of fidelity while make the simulation computationally affordable.Firstly we calculate the mode structures with LIGKA,HMGC and TRIMEG-GKX simulations;then we fit the mode structure to get the parameters σ ands0by using the least-squares method;then substitute the more consistent σ,s0and the corresponding EP profiles in HAGIS,and study the effects σ,s0on EP transport,especially onu‖,whereu‖=∫δf·v‖dv3/∫fdv3.More selfconsistent simulation of EP transport in a gyrokinetic full-fcode requires much more expensive computational resources and is beyond the scope of this work.
The 2D mode structures for inner and outer cases are compared as shown in figure 5.The mode is located near theqminand the frequency is close to the Alfvén continuum.The dominant poloidal harmonic ism=4.In the MHD limit,the Alfvén mode structure is up-down symmetric.EPs break this symmetry and lead to distorted mode structures(symmetry breaking).Due to the different orientation of the poloidal angle of HMGC and TRIMEG-GKX,the 2D mode structures of the electrostatic potential perturbation R(δφ)of TRIMEGGKX results are flipped over vertically to facilitate the comparison.As shown in figure 5,the radial wave-front of the mode has similar curvature compared with the results of HMGC and TRIMEG-GKX.The two initial value codes both show the clear and steady clockwise mode rotation at this moment.It indicates that the wave has a radial propagation from the wave-packet center towards outside in both inward and outward radial directions.

Figure 5.Mode structure symmetry breaking due to EP non-perturbative effects.
Since δfscheme is used in HMGC and the mode grows starting from a very small magnitude,the mode structure is clear in the whole linear stage before saturation.For TRIMEG-GKX code,the initial density perturbation is set so that the corresponding perturbed electric potential δφ containsm=2-6 poloidal harmonics with certain notable magnitude.Due to the EP excitation,the RSAE grows with the dominantm=4 component,while the relative magnitudes of other harmonics get smaller.Since the full-fscheme is adopted in TRIMEG-GKX,the linear growth stage is much shorter than that in HMGC.As them=3 perturbation is damped to the noise level,the relative magnitude ofm=3 harmonic is larger than that in HMGC.Nevertheless,them=4 component is always dominant during the linear and nonlinear saturation stage in TRIMEG-GKX,which is consistent with the HMGC and LIGKA results.In the following analyses,we will focus on the dominant harmonicm=4.
The more consistent parameters σ,s0which account for the symmetry breaking induced by the non-perturbative EP effects are determined by fitting the the radial mode structures of linear stage obtained from HMGC and TRIMEG-GKX.As shown in figure 6,the complex Gaussian expression,provides a good description of them=4 mode structure.The mode frequency of HMGC results as shown in table 4 varies of order 10% compared with no-EP case.The parameters σ ands0capture the dominant features of various mode structures as shown in figure 6.The mode structure depends strongly on the location of the strongest EP density gradients due to the EP non-perturbative effects for the inner and outer cases.
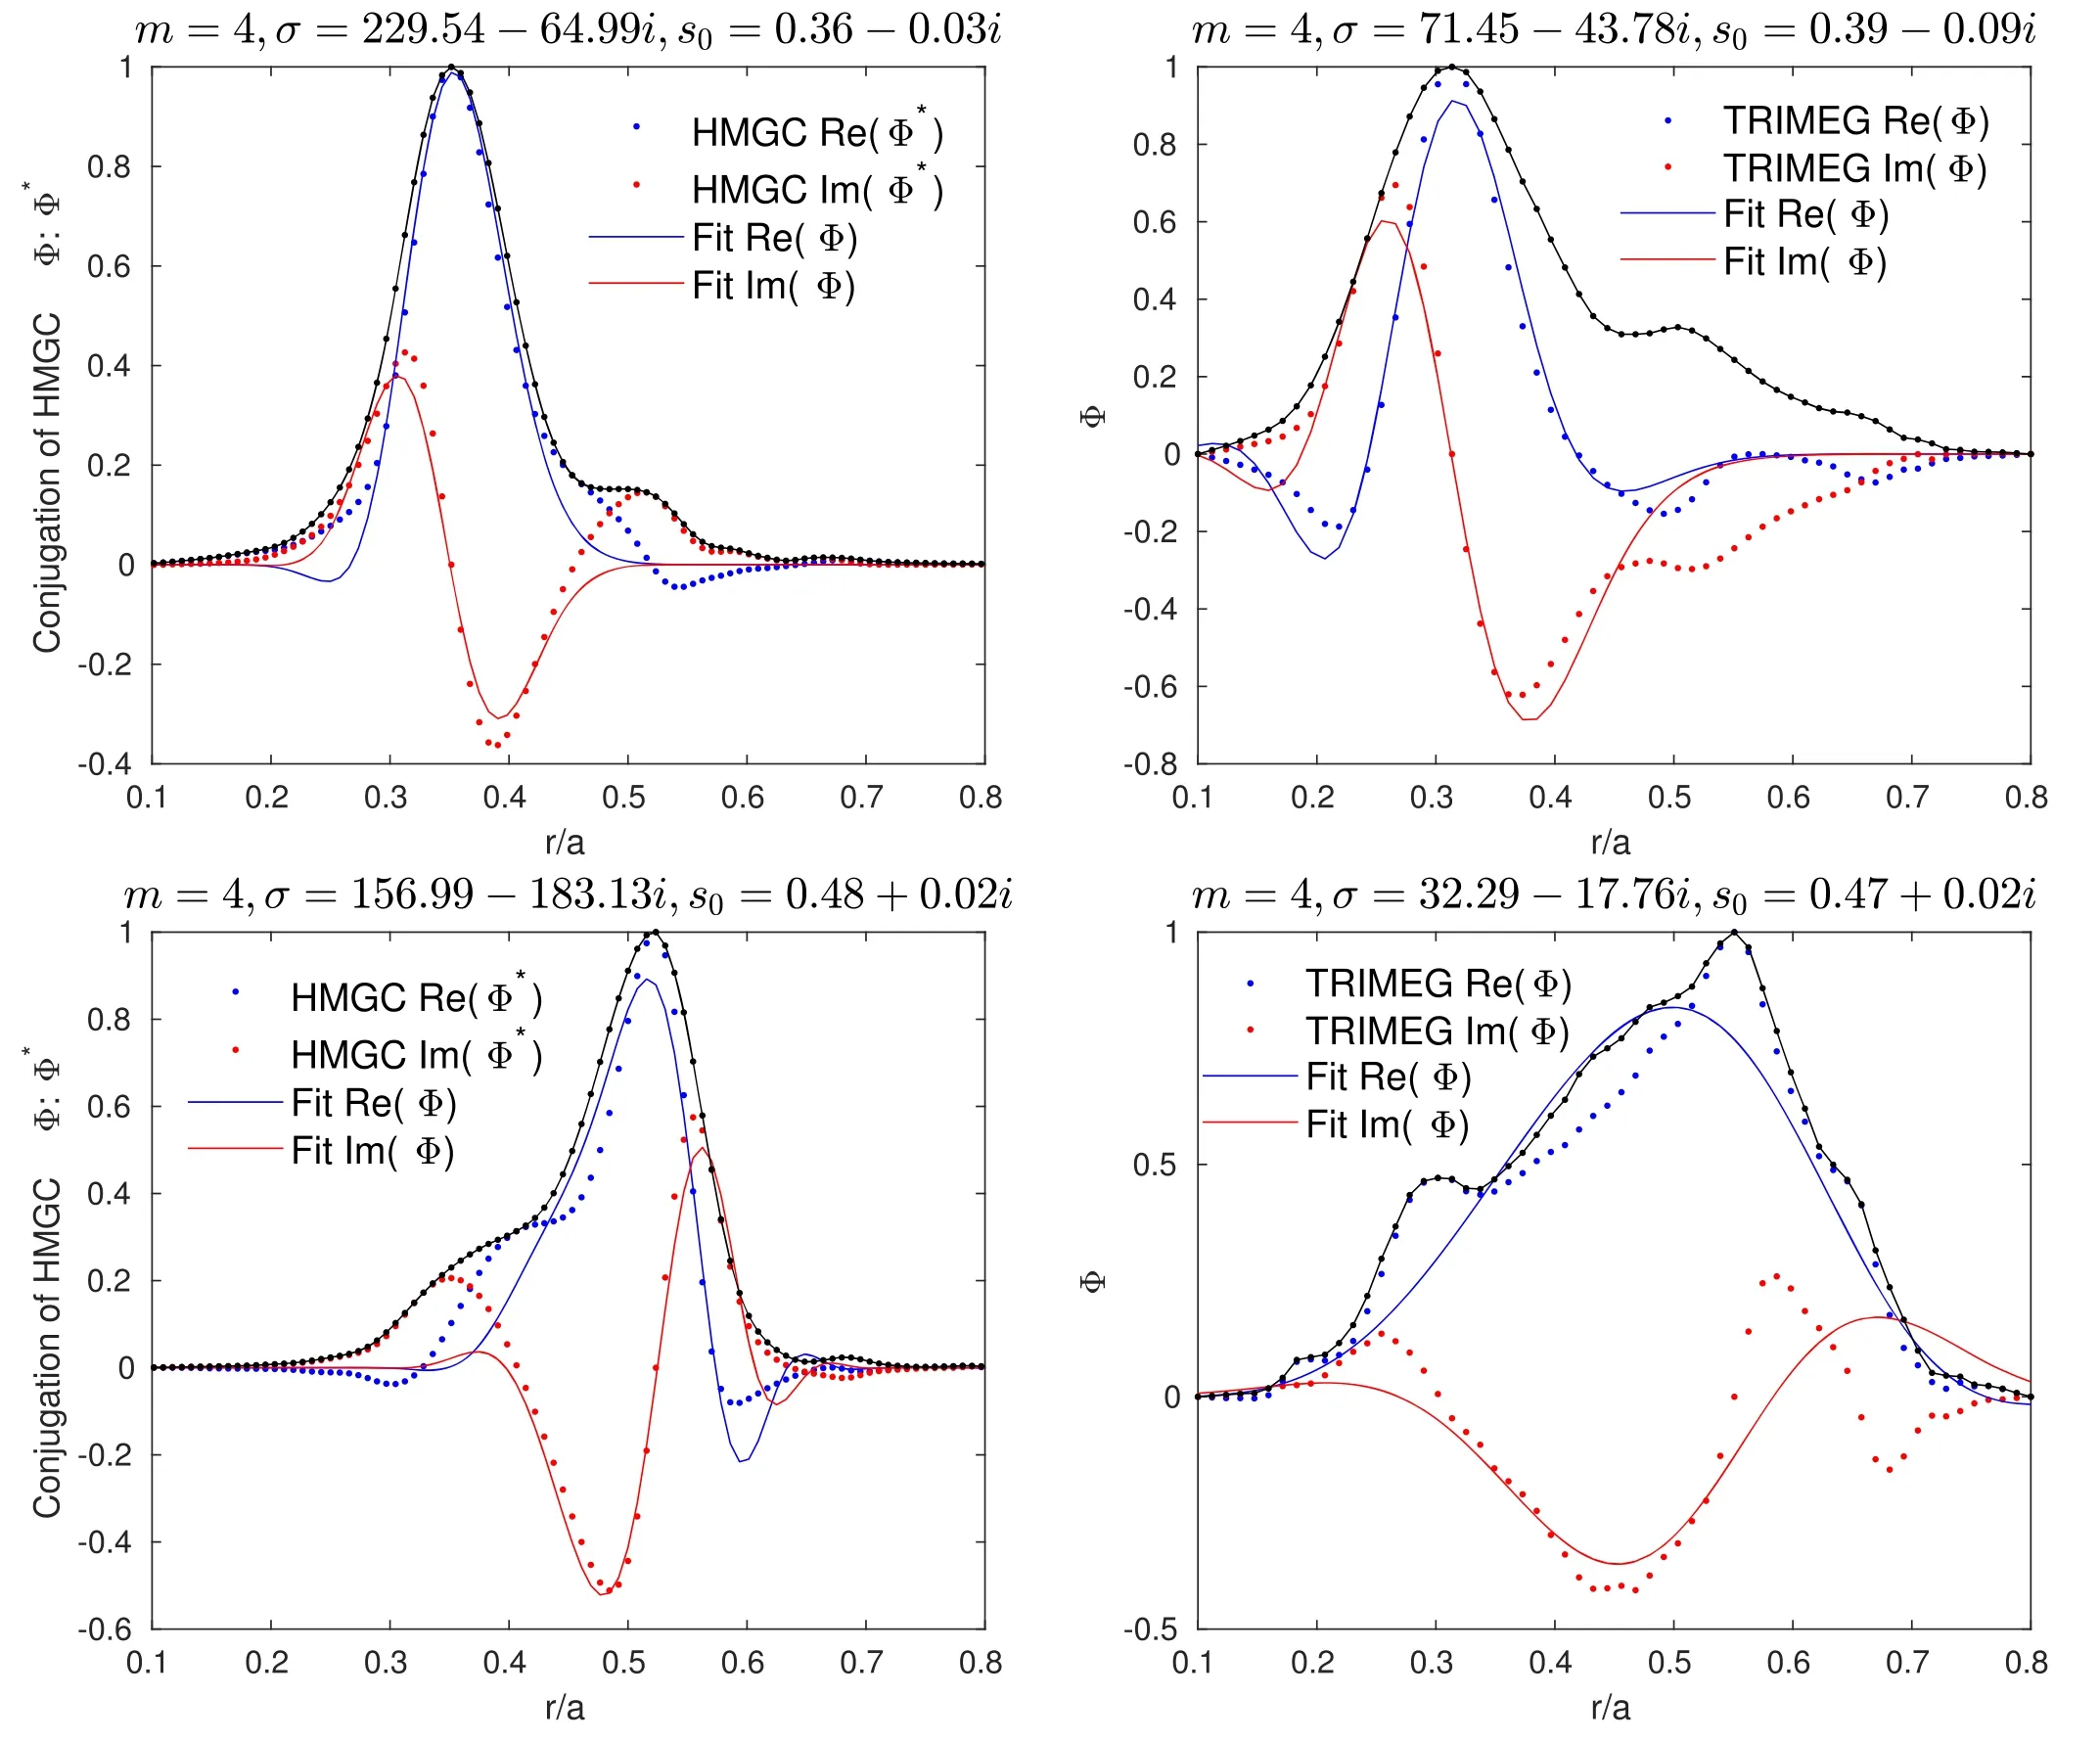
Figure 6.Mode structure of m=4 harmonic of linear stage from HMGC and TRIMEG-GKX.The arrangement is the same with figure 5.
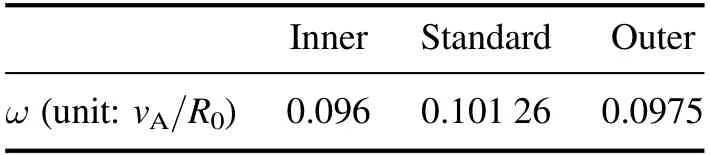
Table 4.Mode frequency of HMGC results.
The σ ands0with respect to Δr,the EP drive deviation from theqmin,is shown in figure 7.The radial width of the mode structure is proportional toThe FWHM of the mode normalized to minor radius,is 0.1665 when R(σ)=100.The R(σ)of HMGC is relatively larger,i.e.the mode is narrower.This is due to the aspect ratio of 10 and the slightly differentqprofile used in HMGC as shown in figure 1.The R (s0)dominantly defines the mode peak location.As shown in figure 7(b)R (s0)tends to follow the EP drive center.As shown in figure 7(c), I(σ)<0for inner,standard and outer cases of HMGC and TRIMEG-GKX results.It is consistent with that both HMGC and TRIMEGGKX show that the wave propagates from the wave-packet center towards two sides in radial direction.The I(σ)of LIGKA results is relatively small,which means that the mode propagates in the radial direction mainly in one direction.The origin of this difference is related to the eigenvalue approach:due to the flat background profiles,the radial eigenstates are almost degenerated in the frequency domain.That means,various RSAEs with a different radial mode numbers can be found for this case.Whereas in an initial value code these states mix and form an overall linear mode structure,in an eigenvalue code they all appear separately,but with very similar frequency and damping/growth rates.Multiple eigenstates corresponding to radial node numbers can lead to the difference between LIGKA and initial value codes TRIMEG-GKX and HMGC.TheI (s0)value shows similar trends as HMGC/TRIMEG-GKX,which is the key of EPu‖reversal,while the Iσ()does not affectu‖reversal too much[20].TheI (s0)for the results of the three codes changes sign for inner and outer cases as shown in figure 7(c).It means that the averaged radial wave vector 〈ks〉 changes from negative to positive.Here,the averaged radial wave vector is defined asThe purple lines are the averaged σ ands0as shown in figure 7.We fit a linear function to the results of each code and evaluate the σ ands0at points Δr=-0.1,0,0.1 by the polynomial coefficients.Then we average the three fitted σ ands0at Δr=-0.1,0,0.1,respectively.Note that the averagedRes[0]shown in figure 7(c)is up shifted by 0.043 due to the difference of radial coordinatessandUsing the average parameters(σ,s0)from the three codes,the fitted mode structures are constructed for the inner,standard and outer cases,and shown together with the EP density gradients in figure 8.The mode location follows the EP drive and is between the maximum EP density gradient and the location ofqminfor inner and outer cases.These are used as the input of HAGIS to study the EP transport next.
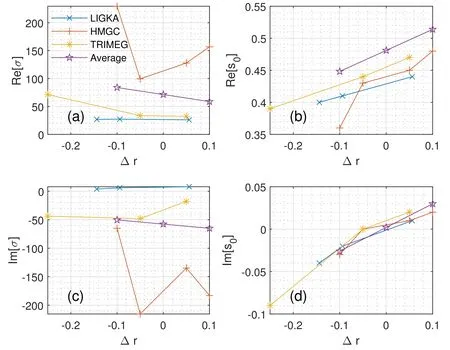
Figure 7.Δr:EP drive distance from qmin.AveragedRes[0 ]is up shifted due to the difference of radial coordinates s and r/a.
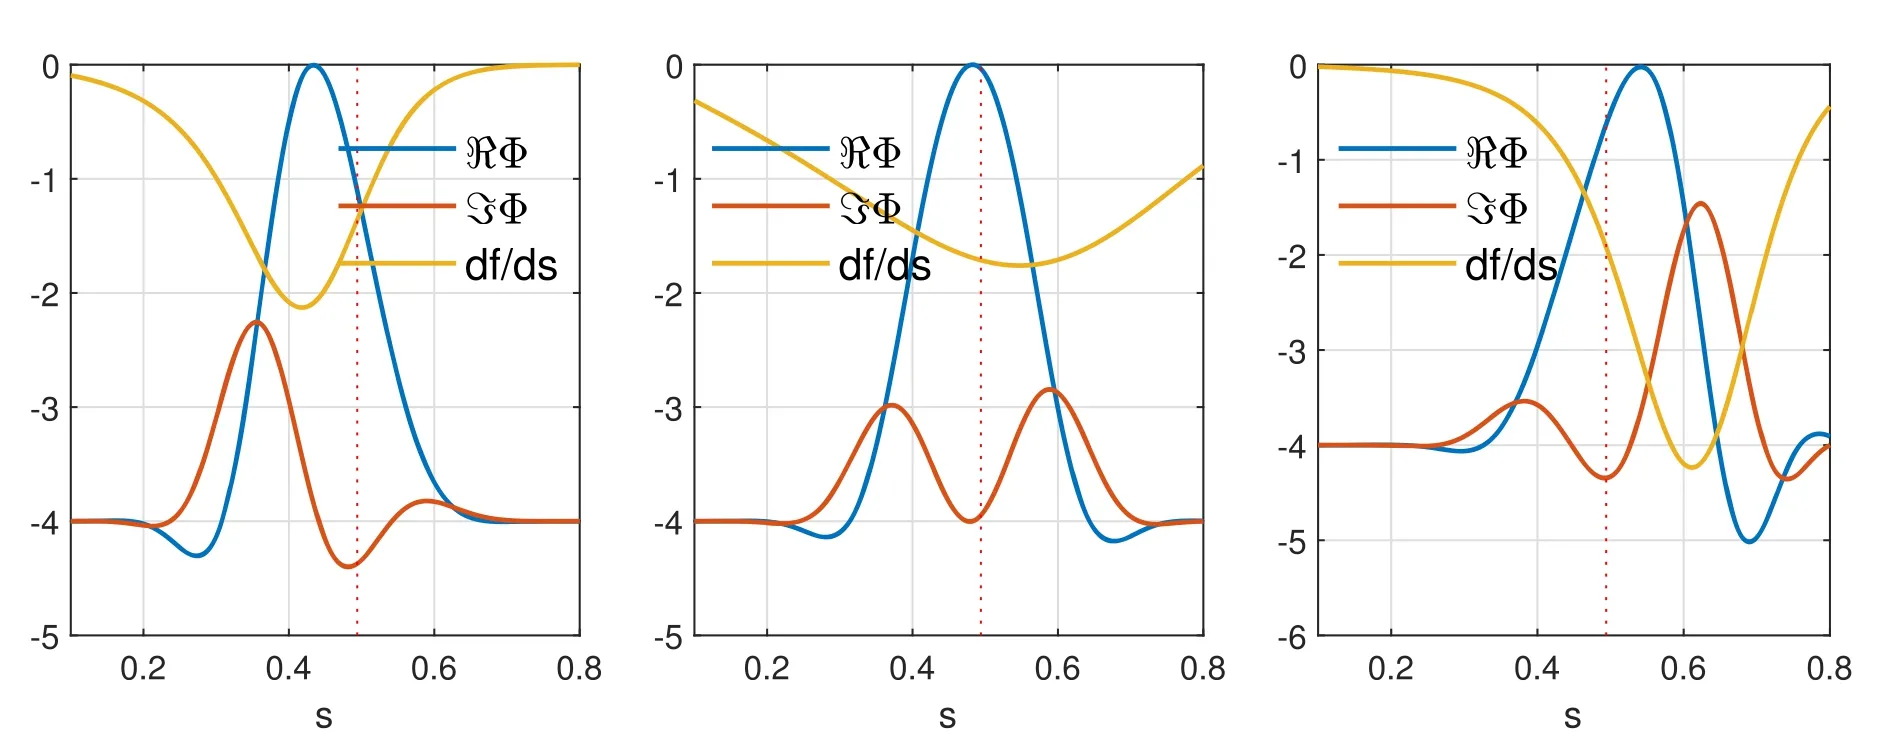
Figure 8.The mode radial structures with their corresponding EP drives for inner(left),standard(center)and outer(right)cases.The vertical red dash line shows the minimum q location(sqmin=0.494).
3.4.EP transport with the effects of MSSB

Figure 9.(a)Mode evolution of 3 cases.(b)The comparison of linear growth rate γL,the frequency shift δω and the saturation level Asat.

Figure 10.The radial profiles of the initial EP density n0 and the perturbed EP density δn(left),perturbed energy δE(middle)and the parallel velocity u‖(right),where δn=∫δfdv3/∫fdv3,δE=∫δf·Edv3/∫fdv3,and u‖=∫δf·v‖dv3/∫fdv3.The integration is performed over velocity space and other configuration space coordinates in obtaining the radial profile.The initial EP distribution is Maxwellian with temperature E0=40 keV(indicated by the red dashed line in the middle frame)for all three cases.The initial parallel flow velocity of EPs is zero as indicated by the red dashed line in the right frame.The thermal velocity of EP is vEP=1.389×10⁶ m s-1.For particle(left)and energy(middle)transport,RSAE tends to flatten the local density and temperature profiles.For momentum transport(right),the flux-surface averaged parallel velocity of the EPs depends on the location of the EP gradient with respect to the mode location(inner,standard,outer as described above),even changing sign.
The EP transport is studied taking into account the MSSB.The EP profiles and the more consistent,fitted mode structures from LIGKA,HMGC and TRIMEG-GKX are adopted as the inputs of HAGIS.The eigenmode frequency ω=0.1066(vA/R0),i.e.f=79.2 kHz,is used for inner,standard and outer cases.The time evolution of the mode amplitude,mode phase and particles are solved using HAGIS.For the outer,standard and inner cases,the saturation levelAsatand EP induced linear growth rate γLand frequency shift δω are similar,as shown in figure 9.The saturation levelAsatand the frequency shift δω in figure 9(b)are averaged values over the time window as shown in figure 9(a).The mode has a similar saturation level such that the EP transport is studied at similar wave intensity levels.The EP density and energy profile flattening occurs at the mode location as shown in figure 10.Especially,the momentum transport depends significantly on the initial EP profile.As shown in the right frame of figure 10,as the EP density gradient shifts from the inner to the outer position,u‖changes from negative to positive,with a magnitude of order of 100 km s-1.With stronger EP drive in this more consistent simulation,the magnitude ofu‖is larger than that in the previously investigated weaker EP drive case[20].
The wave-particle interaction and the plasma response in the phase space are the key issues in interpreting and predicting the saturation level and nonlinear behaviors of the EP driven instabilities[6,35].For the momentum transport studies,the flow generation is closely connected to the different plasma responses in the co-moving and counter-moving(with respect to the toroidal magnetic field),as demonstrated in the electrostatic turbulence studies[24].In order to demonstrate the underlying physics of theu‖profile generation,the perturbed distribution function δf(λ,s)in radial and pitch angle is shown in figure 11,where λ=v‖/v.For the inner,standard and outer cases,the contour of δf(λ,s)is very similar except in the region of 0.2 <λ <0.8,0.1 <s<0.4.The change of the δfvalue is more visible for the co-moving(λ >0)particles(especially those near λ ~0.5),indicating the close connection betweenu‖reversal and the phase space structure of the wave-particle interaction.For the outer case,the co-moving particles interact with the wave strongly and contribute to the generation of the positiveu‖in the inner(s<0.4)region,as indicated in the right frame of figure 10.While the asymmetric particle response of thermal ions to the microturbulence has been studied in previous work[24,36],our results demonstrate that for EP driven RSAEs,the asymmetric mode structure also plays an important role in particle response and theu‖generation.
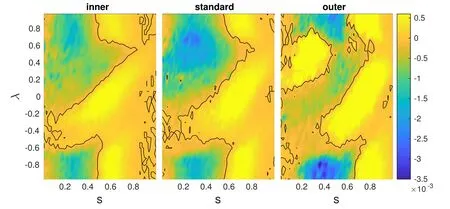
Figure 11.δf(λ, s)of EPs for inner,standard and outer cases,where λ=v‖/v.The black line is the contour of δf=0.
In order to put this result into a broader context and point out its importance,we briefly discuss the conservation properties of the total toroidal angular momentum(waves and particles)for an isolated system,as described by the angular momentum evolution equation[36-38],∂tPφ+∂tgφ+∇·Πφ=0 wherePφis the particles’ toroidal momentum,gφis the toroidal component of the electromagnetic field momentum,and Πφis the toroidal momentum flux.The momentum density →gof the Alfvén wave is not large enough to lead to theu‖reversal in shown figure 10,as analyzed in our previous work[39].Thus although the direct momentum source from the wave could contribute tou‖,other mechanisms in Πφneed to be considered to fully capture all contributions to theu‖generation:the complete form of the Reynolds-Maxwell stress(Πφ)[37,38]needs to be derived with the consideration of various important effects such as the polarization drift effect[40],the turbulence acceleration mechanism[41]and the EP physics such as the FLR/FOW effect[10,19,29].Also the MSSB needs to be taken into account when calculating Πφfor the evaluation of the velocity profile evolution.
4.Summary and conclusion
In this work,simulations of RSAE with or without EP have been performed using the gyrokinetic eigenvalue code LIGKA,the initial value gyrokinetic δfparticle code HAGIS,the hybrid MHD gyrokinetic code HMGC and the full-fgyrokinetic particle code TRIMEG-GKX.Self-consistent simulations of EP driven RSAE demonstrate the MSSB due to the EP effects.It is shown that the mode structure and frequency agree well between LIGKA,HMGC and TRIMEG-GKX and the mode structure is more symmetric when EPs are not applied.The analytical complex Gaussian expressionexp{-σ(s-s0)2} provides a good description of the mode structure in linear stage and with properly fitted parameters σ ands0,it captures the dominant features of various mode structures with symmetry breaking properties.The modes symmetry breaking has a non-ignorable I(σ)when EPs are included for typical parameters in ASDEXUpgrade discharges[42];theI (s0)has opposite signs when the EP drive moves from one side ofqminto the other side.Theu‖reversal is observed as EP initial profiles varies in HAGIS simulation,when the more consistent RSAE structures are adopted.Thus,our result shows that the EP-RSAE interaction inducedu‖changes direction when the EP drive moves from one side to the other side ofqminfor the parameters studied in this work.
While in this work,the effects of the mode structure distortion on EP transport is demonstrated,further work will be done in future by using more realistic parameters,simulation models and developing the EP transport model for interpretive and predictive studies.With more realistic equilibrium and profiles used,the simulation is expected to be more quantitatively accurate in EP transport for non-circular tokamak plasmas.While the turbulence induced transport has been studied using gyrokinetic simulations[24,36],the gyrokinetic simulations and analyses of toroidal/parallel flow generation with electromagnetic and EP physics have not carried out so far.Consistent simulations in the presence of EPs require the proper treatment of kinetic effects of Alfvén waves and EPs[6],consistent gyrokinetic ordering[43]and proper treatment of conservation properties[37].Meanwhile,the development of EP transport models serves as an extension of this kind of near-first-principle studies with the aim to support the interpretation and prediction of experimental results[1,5,39,44,45].
Acknowledgments
The authors would like to thank Dr.F.Zonca,Dr.X.Garbet and Dr.Simon Pinches for fruitful discussions,partially within the EUROFUSION Enabling Research Projects Projects ‘NLED’(ER15-ENEA-03),‘NAT’(CfP-AWP17-ENRMPG-01),‘MET’(ENR-MFE19-ENEA-05)and ‘ATEP’(ENR-MOD.01.MPG).This work has been carried out within the framework of the Eurofusion Consortium and has received funding from the Euratom research and training programme 2014-2018 and 2019-2020 under grant agreement No.633 053.The views and opinions expressed herein do not necessarily reflect those of the European Commission.
ORCID iDs
 Plasma Science and Technology2022年2期
- Plasma Science and Technology的其它文章
- Investigation of short-channel design on performance optimization effect of Hall thruster with large height-radius ratio
- Multi-layer structure formation of relativistic electron beams in plasmas
- Interaction between energetic-ions and internal kink modes in a weak shear tokamak plasma
- Investigation of the compact torus plasma motion in the KTX-CTI device based on circuit analyses
- Anomalous transport driven by ion temperature gradient instability in an anisotropic deuterium-tritium plasma
- Nonlinear excitation of a geodesic acoustic mode by reversed shear Alfvén eignemodes