
Growth,characterization,and Raman spectra of the 1T phases of TiTe2,TiSe2,and TiS2
2022-03-12 07:45XiaoFangTang唐筱芳ShuangXingZhu朱双兴HaoLiu刘豪ChenZhang章晨QiYiWu吴旗仪ZiTengLiu刘子腾JiaoJiaoSong宋姣姣XiaoGuo郭晓YongSongWang王永松HeMa马赫YinZouZhao赵尹陬FanYingWu邬钒颖ShuYuLiu刘姝妤KaiHuiLiu刘开辉YaHuaYuan袁亚华HanHuang黄寒JunHe何军
Chinese Physics B 2022年3期
关键词:徐文
Xiao-Fang Tang(唐筱芳) Shuang-Xing Zhu(朱双兴) Hao Liu(刘豪) Chen Zhang(章晨) Qi-Yi Wu(吴旗仪)Zi-Teng Liu(刘子腾) Jiao-Jiao Song(宋姣姣) Xiao Guo(郭晓) Yong-Song Wang(王永松) He Ma(马赫)Yin-Zou Zhao(赵尹陬) Fan-Ying Wu(邬钒颖) Shu-Yu Liu(刘姝妤) Kai-Hui Liu(刘开辉)Ya-Hua Yuan(袁亚华) Han Huang(黄寒) Jun He(何军) Wen Xu(徐文) Hai-Yun Liu(刘海云)Yu-Xia Duan(段玉霞) and Jian-Qiao Meng(孟建桥)
1Key Laboratory of Materials Physics,Institute of Solid State Physics,Chinese Academy of Sciences,Hefei 230031,China
2University of Science and Technology of China,Hefei 230026,China
3School of Physics and Electronics,Central South University,Changsha 410083,China
4State Key Laboratory for Mesoscopic Physics,Collaborative Innovation Center of Quantum Matter,School of Physics,Peking University,Beijing 100871,China
5Beijing Academy of Quantum Information Sciences,Beijing 100085,China
Keywords: transition-metal dichalcogenides,chemical vapor transport,Raman,phonon
Following the discovery of graphene, layered transitionmetal dichalcogenides (TMDCs) with the chemical formulaTX2(T: transition metal;X: chalcogen) have attracted more attention.The quasi-two-dimensional(2D)TMDCs,attracted by relatively weak van der Waals-like forces, have rich physical properties such as topological superconductivity(SC),[1,2]charge density wave (CDW),[3,4]extremely large magnetoresistance,[5]and Dirac semimateal.[6,7]Due to the weak interaction between layers,it is possible for TMDCs materials to break the dimension limit and realize the application of few layers,[8]or even monolayer devices.[9,10]
Titanium disulphides (TiX2,X=Te, Se, and S) are typical representatives of TMDCs. They have been studied extensively for their fascinating properties and potential applications. TiTe2[11-13]and TiSe2[14-16]are typical semimetals.Most researchers consider TiS2to be a semiconductor,[17,18]but some consider it to be semimetal.[19]1T-TiTe2has been considered as a textbook Fermi liquid system.[20]CDW and SC have been confirmed in both TiTe2[4,21,22]and TiSe2.[23-27]Bulk TiSe2undergoes a CDW phase transition at 202 K,[28,29]and that of the monolayer TiSe2increased to over 232 K.[25-27]Recently, CDW phase transition has been revealed in singlelayer TiTe2samples at 92±3 K,[4]while no CDW has been found in bulk TiTe2. For TiS2, theoretical calculation suggests that CDW and SC can be tuned by doping.[30]1Tphases of TiTe2[21,31,32]and TiSe2[33]have been suggested as possible candidates for exploring topological SC.In TMDCs compounds,both CDW and SC are considered to be closely related to phonons.[21,30,34]The systematic study of phonon properties in TiX2is helpful to understand CDW and SC better.
High-quality large-size single crystals of TiX2were grown utilizing the chemical vapor transport method. Ti(99.99%, powder) andX(99.99%, powder) was mixed with a molar ratio of 1:2. Iodine (99.95%, powder) was used as the transport agent. We found that the growth of TiX2single crystals depends closely on many parameters, such as mixture heating temperature,crystal growth temperature,temperature gradient,growth time,and iodine concentration. We have tried different conditions, and the following parameters were applied to obtain high-quality large-size TiX2crystals. The mixture was sealed into quartz tubes in a vacuum(10-3Torr,1 Torr = 1.33322×10²Pa) and placed in a two-zone furnace,and then heated to specified temperatures for nearly two weeks. For the growth of TiTe2, the mixture at one end was heated to 900°C, and the growth end was set at 800°C. For TiSe2and TiS2,the temperatures are set at 800°C and 700°C,700°C,and 600°C,respectively. For all three materials, the temperature gradient is~5°C/cm and the iodine concentration is~5 mg/mL.
After two weeks of growth,Ti powder and chalcogenide powder can fully react to form large-size crystals. As-grown single crystals with the shiny surface are obtained,as shown in Figs.1(a)-1(c). The crystal size of TiTe2reaches centimeters.All three crystals show different metallic lusters and have distinct 120°angles related to their crystal structure. Figure 1(d)displays the x-ray diffraction(XRD)pattern for cleaved TiX2single crystals. All the observed diffraction peaks can be indexed by(0,0,h)withhbeing an integer,indicating a pure single phase of the obtained TiX2single crystal. It can be found from TiTe2to TiSe2to TiS2, the diffraction peak of the same indexed number shifts to the right. It means that thec-axis lattice constant decreases as chalcogens’ionic radius decreases.Thec-axis lattice constant is calculated from XRD data, as listed in Table 1. Our results are consistent with the results reported before.[20,35]

Table 1. The chemical composition and c axis of the TiX2 single crystals.
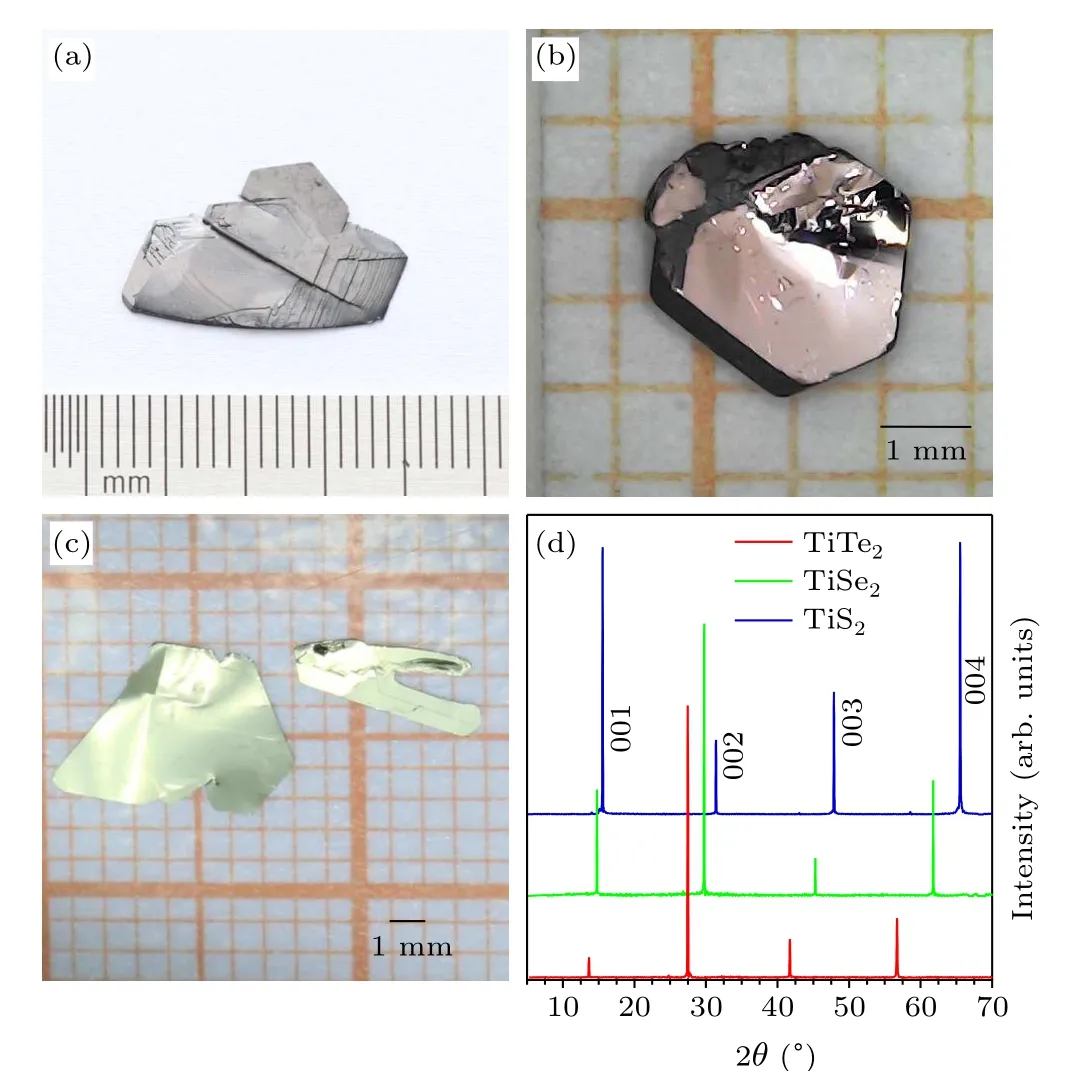
Fig.1.(a)-(c)Photograph of the as-grown crystals of TiTe2,TiSe2,and TiS2,respectively. (d) XRD patterns for cleaved single crystals of TiTe2, TiSe2,and TiS2,respectively. All peaks are indexed by(0,0,h).
A scanning electron microscope(SEM)equipped with the energy dispersive spectrometer (EDS) was used to characterize the surface morphology and the chemical composition of the single crystals. Figures 2(a)-2(c)show the SEM observed smooth surfaces of TiTe2, TiSe2, and TiS2, respectively. Because of their layered structure, it can be readily cleaved to get sizeable, clean, and smooth surfaces, which is necessary for surface-sensitive experiments like angle-resolved photoemission spectroscopy and scanning tunneling microscope. As shown in Fig.2(a),the fracture between layers is usually along the edge direction.
Figure 2(d) displays a typical EDS spectrum for TiSe2.The weight or atomic percentages of Ti and Se can be extracted.Table 1 summarizes the average chemical composition of TiX2single crystals.It can be seen that the actual atomic ratio of Ti andXin the three materials is close to 1:2,which is the ideal atomic ratio. Single-phase and accurate atomic ratios mean that we have obtained high-quality and stoichiometry TiX2single crystals.
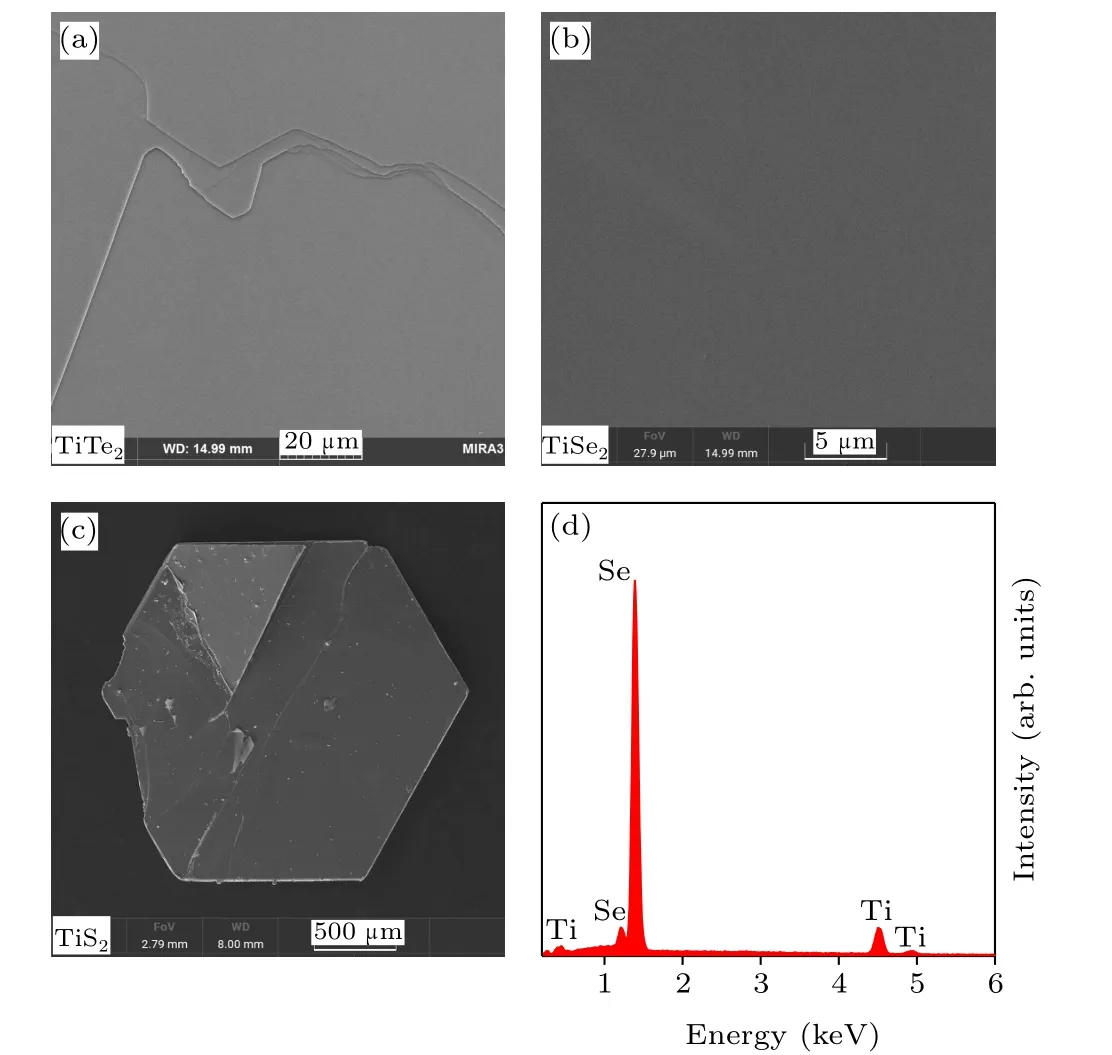
Fig.2.(a)-(c)The surface morphology of the TiTe2,TiSe2,and TiS2,respectively. (d)Typical EDS spectrum of for the single crystal TiSe2. The atomic ratio of Ti:Se=1:2.01.
Raman spectroscopies were used to investigate the temperature-dependent phonon behavior of TiX2single crystals. Raman spectroscopy on TiTe2was measured using selfbuilt equipment in the range of 10 K-270 K, where the signal was excited by 532-nm laser and recorded by a Princeton SP2500 spectrometer equipped with a nitrogen-cooled silicon charge-coupled device camera. Raman spectroscopy (Renishaw)on TiSe2and TiS2single crystals were performed in the backscattering configuration under 633-nm laser excitation in the range of 80 K-300 K.
The group-theoretical analysis suggested that the layered 1Tstructured TiX2has nine vibrational modes atΓpoint:[36]

whereEgandA1gare Raman-active, andEuandA2uare infrared-active.TheEgandA1gmodes represent atomic vibrations along theabplane and parallel to thecaxis,respectively.
Figures 3(a1)-(a3) show 2D pseudocolor maps of Raman spectra of TiTe2, TiSe2, and TiS2, respectively. The corresponding temperature evolution of Raman spectra of Figs. 3(a1)-(a3) at selected temperatures are displayed in Figs. 3(b1)-(b3). Several phonon modes with different strengths are observed in all three samples. These modes also behave differently with temperature.
For TiTe2, five modes are observed at all temperatures[Figs. 3(a1) and 3(b1)]. At 10 K, the weak phonon modes at~105 cm-1(10 K)and~142 cm-1(10 K)are attributed toEgandA1gmodes,respectively.[36-38]A peak significantly stronger than theEgandA1gmodes was also observed at~125 cm-1,named theMmode and considered a zone-folded Raman-active mode.[37]However, in addition to these three phonon modes, we also observed two previously unreported modes at~183 cm-1(10 K)and~85 cm-1(10 K),respectively. Based on the existing theoretical calculations, the former phonon mode could be assigned toEusymmetry.[36,39]Follow the same analysis as Rajajiet al., the latter mode(namedKmode)could be a Raman mode resulting from zonefolding of phonon mode fromKorMof the Brillouin zone.However, it should be noted that CDW phase transition has not yet been detected in bulk TiTe2, which is different from TiSe2,[40]TaSe2,[41]and TaS2[42]with 1Tstructure referenced in Rajajiet al.’s analysis.[37]ForMandKmodes,further theoretical and experimental studies are necessary.
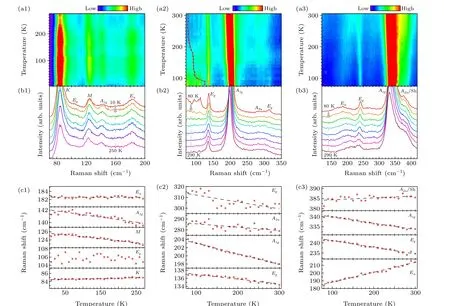
Fig.3. (a1)-(a3)Raman intensity maps a function of Raman shift(horizontal axis)and temperature(vertical axis)for TiTe2,TiSe2,and TiS2,respectively.(b1)-(b3)Corresponding Raman spectra of panels(a1)-(a3)at selected temperatures. The temperature intervals are 40,30,and 30 K,respectively. (c1)-(c3)Temperature-dependence of Raman shift of phonon modes of TiTe2, TiSe2, and TiS2, respectively. The black-dashed lines represents the result of linear fitting.
For TiSe2, two strong and sharp Raman peaks at~137 cm-1(80 K) and~204 cm-1(80 K) are observed[Figs. 3(a2) and 3(b2)], which can be attributed toEgandA1gmodes, respectively.[36,40,43]Other prominent features in the spectrum include broadbands at 70 cm-1-115 cm-1and 280 cm-1-320 cm-1. For the latter, the second-derivation method was used to extract the position of the phonon modes.Two modes were obtained at~285 cm-1(80 K) and~315 cm-1(80 K), respectively. The mode at~285 cm-1was identified as due toA2u.[44]The mode at~315 cm-1was assigned toEgphonons, which was due to two-phonon processes.[40,43]However, it is not easy to distinguish the phonon mode in the broad band at 70 cm-1-115 cm-1.We track the change of integrated intensity with temperature in this range, showing by the red dotted line in the inset of Fig. 3(a2). It can be seen that the intensity decreases with increasing temperature, and it decreases faster around 210 K.This behavior may be related to the CDW phase transition,and similar phenomena have been reported in previous studies.[45,46]At present,there is no good explanation for the sudden change of intensity at~100 K, which needs further study.
As shown in Figs. 3(a3) and 3(b3), two sharp Raman peaks at~242 cm-1(80 K) and~340 cm-1(80 K) are observed in TiS2, which are assigned toEgandA1gmodes,respectively.[36,47,48]In addition,two significant structure features were observed, a broad peak appears at~185 cm-1(80 K)on the low energy side ofEgpeak,and a shoulder appears at~382 cm-1(80 K)on the high energy side of theA1gpeak. The former mode is possibly due to theEumode.[36]While the latter mode has been reported,[47-51]its origin is still much debated. Researchers have proposed various possible origins, including overtone and/or summation processes,[47]excess interlayer Ti atoms,[49,52]A2usymmetry,[36,51]and so on. In this work,it was noted as“A2u/Sh”.
We quantitatively analyze the phonons’ evolution with temperatures. For phonons with distinct peaks,their positions are obtained by curve fitting. While for phonons with only the broad bands, their positions are obtained by the secondderivation. Figures 3(c1)-3(c3) show the detailed temperature dependence of positions for phonons of TiTe2, TiSe2,and TiS2, respectively. The evolution of the Raman modes wavenumbersωwas fitted with a linear function
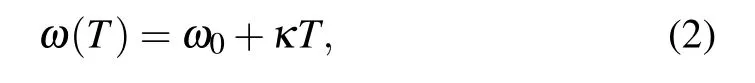
whereω0is the phonon wavenumber for temperature extrapolated to 0 K,κis the temperature coefficient, andTis the temperature. The fitting parameters are listed in Table 2.
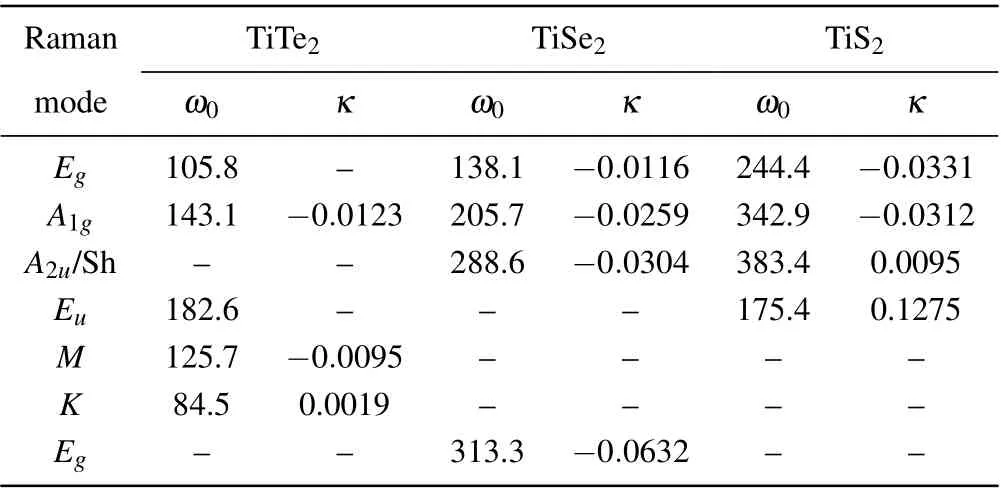
Table 2. Frequency ω0 (in unit cm-1) and temperature coefficients κ (in unit cm-1/K)of Raman modes of 1T-TiX2.
Because of the anharmonic effects, phonons usually harden as the temperature decreases,meaning thatκis a negative number.EgandA1gmodes were found to harden with decreasing temperature. Because it is difficult to obtain the exact location ofEgmode of TiTe2, it is not fitted here. We note that the effect of temperature onA1gmode increases significantly from TiTe2to TiSe2and then TiS2. This may be becauseA1gmode vibrates parallel to thecaxis,that the effect of temperature is opposite to the change of thec-axis lattice constant. For TiSe2, theκvalue forEgmode is significantly lower than that ofA1gmode, which may be due to the different bonds in in-and out-of-planes. In contrast,theκvalue forEgandA1gmodes are identical for TiS2,which is inconsistent with the results obtained in the flake samples.[48]
We also notice some abnormal features that several phonons soften with the decrease of temperature, such asKmode of TiTe2,A2u/Sh andEumodes of TiS2. Theκvalue(0.0095 cm-1)for theA2u/Sh mode of TiS2is more than one order of magnitude lower than the results obtained in the flake samples(0.0592 cm-1).[48]While theEumode of TiS2has a huge redshift (κ=0.1275 cm-1) with the decrease of temperature. Since the properties of some phonons, such as theA2u/Sh mode,are not fully understood,further theoretical and experimental studies are needed.
Finally,we focus on the line shape of Raman spectra.Figures 4(a)-4(c) display the lowest temperature Raman spectra of TiTe2,TiSe2,and TiS2,respectively.As shown in Figs.4(b)and 4(c),the sharp Raman peaks of TiSe2and TiS2show good symmetry, which can be well fitted with the Lorentzian line shape. For TiTe2, a striking feature is an asymmetric line shape,indicating electron-phonon(e-ph)coupling in the system. The asymmetric line shape caused by e-ph coupling can be better fitted by Fano resonance line shape[53,54]

whereA,ω0,q,andΓare the intensity,renormalized phonon frequency in the presence of e-ph coupling, asymmetry parameter,and linewidth,respectively.Generally,1/qreflects the strength of e-ph coupling. When the coupling is very weak,that is,|1/q|→0, the equation (3) reduces to the Lorentzian line shape. In Fig. 4, the solid curves are the fitted results with Eq.(3). For TiTe2,theqvalues ofK,M,andA1gmodes are about 4.1,2.9,and 3.8,respectively,which means a strong e-ph coupling. For TiSe2and TiS2, all modes haveqvalues greater than 8, indicating weak e-ph coupling. This conclusion can also be drawn from the fact that curves can be fitted well with the Lorentzian line shape(green dashed lines). Because the laser excitation wavelengths of the three samples are different,there is no quantitative comparison of the e-ph coupling strengthλ.
In conclusion, high-quality and large TiTe2, TiSe2, and TiS2single crystals have been successfully prepared by the chemical vapor transport method. XRD,SEM,and EDS characterizations demonstrate the high crystalline quality of our sample. TiTe2phonon properties in the temperature range of 10 K to 270 K and TiSe2and TiS2phonon properties in the temperature range of 80 K to 300 K were measured by Raman spectroscopy. Multiple phonons were observed in all materials. In addition to the widely reported Raman modes such asEgandA1g, we also observed unreported Raman modes such asK(~84.5 cm-1)andEu(~182.5 cm-1)modes for TiTe2,A2umode for TiSe2,andEumode for TiS2.These phonons exhibit different temperature-dependent behaviors. TheKmode of TiTe2and theEuandA2u/Sh modes of TiS2soften with temperature decreasing, while the other phonons harden with temperature decreasing. Our findings add to the understanding of TiX2.
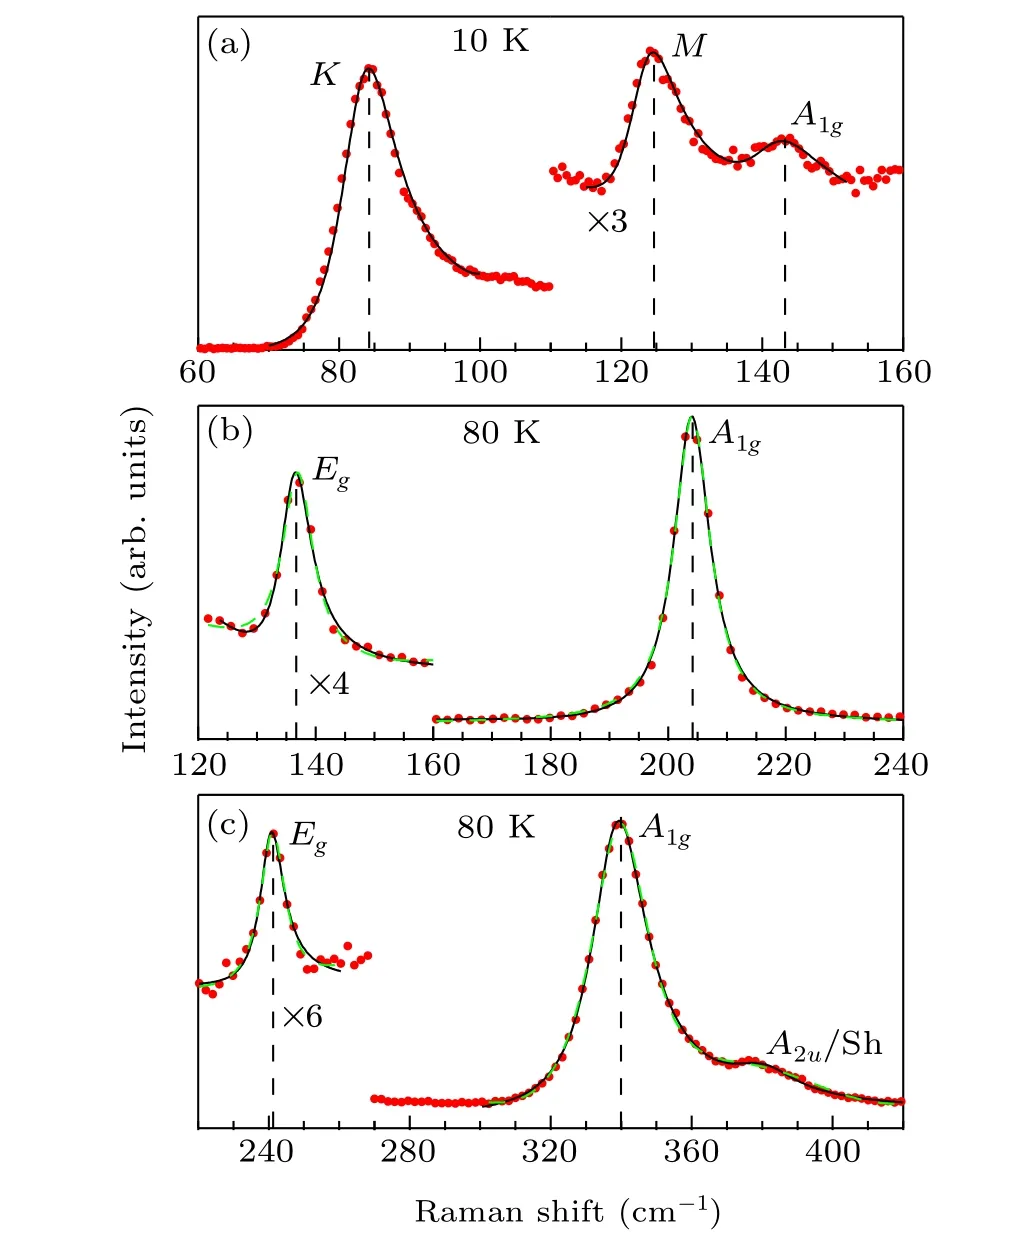
Fig.4. (a)-(c)Low temperature Raman spectra of the TiTe2,TiSe2 and TiS2,respectively.The black solid lines and green dashed lines represent the fitting results of Eq.(3)and Lorentzian line shape,respectively.
Acknowledgments
Project supported by the National Natural Science Foundation of China (Grant Nos. 12074436 and U1930116) and the Innovation-driven Plan in Central South University(Grant No.2016CXS032).
猜你喜欢
民间故事选刊(2022年16期)2022-08-23
民间文学(2022年3期)2022-03-31
Plasma Science and Technology(2020年12期)2020-12-02
北京文学(2019年3期)2019-03-12
江南(2016年1期)2016-01-08
创新作文(5-6年级)(2015年12期)2015-12-17
现代营销·经营版(2015年10期)2015-10-14
新农村(2014年17期)2015-03-24
诗潮(2014年9期)2014-11-15
散文诗世界(2014年6期)2014-02-12
- Chinese Physics B的其它文章
- Measurements of the 107Ag neutron capture cross sections with pulse height weighting technique at the CSNS Back-n facility
- Measuring Loschmidt echo via Floquet engineering in superconducting circuits
- Electronic structure and spin-orbit coupling in ternary transition metal chalcogenides Cu2TlX2(X =Se,Te)
- Characterization of the N-polar GaN film grown on C-plane sapphire and misoriented C-plane sapphire substrates by MOCVD
- Review on typical applications and computational optimizations based on semiclassical methods in strong-field physics
- Quantum partial least squares regression algorithm for multiple correlation problem