A measurement of vibrations of sensor holders of a container in lifting and moving operations
2022-03-16 03:17TIANHaoHUANGQiWUZengwenWANGJi
宁波大学学报(理工版) 2022年2期
TIAN Hao, HUANG Qi, WU Zengwen, WANG Ji*
A measurement of vibrations of sensor holders of a container in lifting and moving operations
TIAN Hao1, HUANG Qi2, WU Zengwen1, WANG Ji1*
( 1.Faculty of Mechanical Engineering & Mechanics, Ningbo University, Ningbo 315211, China; 2.Institute of Civil Engineering, Huzhou Vocational & Technical College, Huzhou 313000, China )
In the process of container handling with cranes, vibrations and impacts can damage substructures of a container such as a sensor holder. To ensure the normal operation of sensor holder during transportation, it is necessary to monitor conditions of sensors and take remediation. A theoretical analysis and experimental measurement are combined to investigate vibrations of the sensor holder of a container structure. The results show that the sensor holder has a large displacement response in the frequency range of 12–25Hz. The sensor holder has a large acceleration response in the frequency range of 4100–5000Hz. A preliminary vibration isolation scheme design can be proposed with the consideration of these two frequency bands, and feasibility analysis and optimization targets are discussed.
vibration; measurement; laser; analysis; structure; container
1 Introduction
All structures in industry or nature are subjected to vibrations of certain kinds due to their dynamic characteristics and environmental factors[1]. While it is pleasant to have small vibrations in daily activities in places like home and office, excessive vibrations, which happens in industry more often due to operations of heavy duty and larger power machines with moving or rotating parts[2-3], are always on the lists for elimination. It is natural to seek possible methods for the control of vibrations in applications which the excessive vibrations are always prohibited[4-5]. This objective can be achieved with the vibration analysis which are closely related with a structural model with the needed vibration frequencies and mode shapes[6]. In addition, the analytical results of structural vibrations and properties are generally required for validation with vibration tests and measurements concerning the targeted applica- tions[7-8], because the difference between analysis and actual results are important in applications for the control of vibrations in certain conditions such as in the critical region of resonance[9-10]. Besides, installations of vibration control mechanisms are time consuming, disruptive, and also expensive[11]. Precise planning, design, fabrication, and implementation are important for the goal of a better and safer operation. In a dynamic environment, these are the general principles and concepts for the vibration control and test in engineering applications based on vibration analysis.
Recently, the Piezoelectric Device Laboratory of Ningbo University (piezo.nbu.edu.cn) was asked to investigate the excessive vibrations on the sensor holders[12-13], a substructure of a container, because damages and disruptions have been experienced in the moving of containers by heavy cranes during the transportation process. The logistic company asked to be kept anonymous, would like the laboratory to identify the source of vibrations and provide a solution to the problem with the design and installation of vibration control apparatus tailored to the existing equipment. The vibration analyses and measurements are the core expertise of the laboratory with extensive experiences in dealing with industrial problems and relatively advanced instrumentation for vibration testing[14-16]. The laboratory accepted the request and checked the container structure for a plan for the identification of the vibration source[17]with the combination of analysis and measurement. A plan for vibration control will be proposed after careful evaluation of the data and requirements.
It turned out that the analysis and measurements are quite useful from the planned approach, and the results are fully confirmed and a solution has been presented to the logistic company. It is believed that a full account of the analysis, test, and design will demonstrate the procedure and methods for the solution of the vibration control problem from engineering point of view in similar situations.
2 The analysis of vibrations of sensor holders of a container
A close examination of the sensor holders of a container as the targeted structure was made on the logistic company freight yard. The sensor holders are fully attached to the container with a strong support of steel plates. The sensor is used for the positioning during the moving of the container between different platforms. The crane will lift the container in a relatively fast action, causing noticeable collision and impact to the container and subsequent vibrations of sensor holders in top corners of containers. As it is planned, vibrations of the sensor holder will be analyzed to obtain essential properties, then it will be checked by the measurement to validate the analysis. This will be essential in identifying the dynamic properties of the structure and design vibration control structures accordingly[18].
With the sensor holders as shown in Fig. 1, it is necessary to calculate the natural frequency of the sensor installation for the initial design of a needed vibration isolation system. As illustrated, the current sensor holder is actually a cantilever plate of steel attached to the container. We can use plate material properties and dimensions for the natural frequency of the holder structure. For a simple estimation, the lowest flexural vibration frequency of the sensor hold is[19]
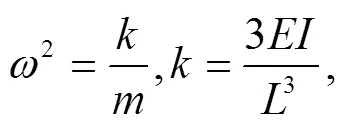
where k, m, E, I and L are the equivalent stiffness, mass, Young’s modulus, cross-section inertia, and length of the beam, respectively.
With known parameters of the steel plate, the frequency of flexural vibrations of the beam with center of sensor mass as the length in Eq. (1) is around 4000Hz.
For vibrations of the sensor, which can be simplified to a single-degree-of freedom (SDOF) model as shown in Fig. 2 with the consideration of the supporting plate and rubber pad. In this case, the damping will be included in the analysis. Since the sensor will be under the external excitation from the supporting plate, the analytical model will consider the input as a displacement from the supporting plate as() in Fig. 2.

Fig. 2 The SDOF vibration model of the sensor
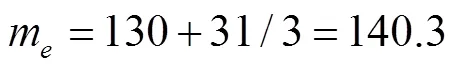
As in Fig. 2, the rubber pad has a smaller stiffness in comparison with the sensor and supporting plate. In the calculation of vibration frequency of the sensor, the mass will be mainly of the sensor, and the stiffness is the steel plate under the rubber pad. For approximation, the equivalent mass of the sensor is[19]

wheremandmare mass of the sensor and rubber pad, respectively.
As a result, the natural frequency of the sensor without considering the damping will be

and the equation of vibrations under excitation displacement() from the steel plate is[19]

with the usual consideration of generic mass, damping, and stiffness.
In order to obtain the vibration properties of the sensor, the model in Fig. 2 is analyzed with Eqs. (2)–(3) and the finite element method with Ansys (Ansys Corporation, Pittsburgh, USA)[20]for comparison and verification. The finite element model used is shown in Fig. 3 with the mesh scheme. For simplification, the connection of the sensor and steel plate with bolts are not included in the model and analysis, implying the sensor is attached to the rubber pad and steel plate with a perfect bonding.
In the analysis, materials of the sensor and installation structure are
(1)The plate is made of Q235 Steel[21], and the sensor is considered as a rigid body.

Fig. 3 The finite element model and mesh scheme with analysis

(3)The dimensions of the sensor are65mm×60 mm×50mm, and its weight is 130g.
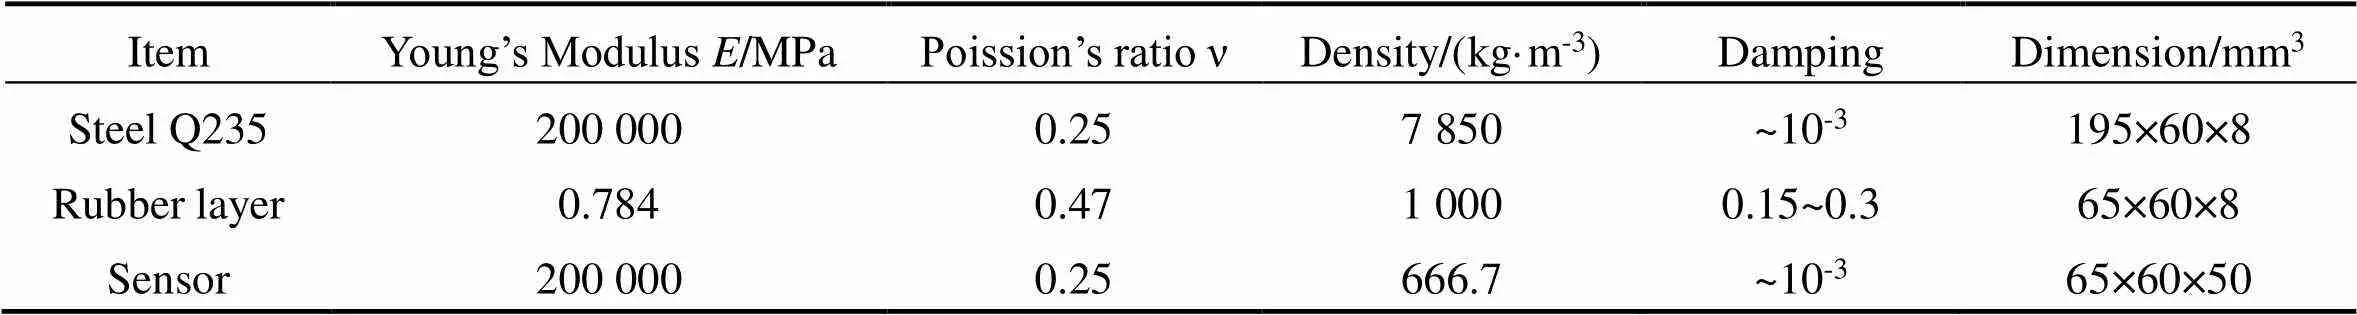
Table 1 Material properties and dimensions
The calculations are performed with material properties and parameters in Table 1. The boundary conditions of the finite element model are as shown in Fig. 3.


The approximate frequency is very close to the result from the finite element analysis for the simple vibration mode. As it is known, the simple calculation will be accurate for practical problem as this one. It is clear that the frequency is from the uniform compression of the rubber layer, and the higher frequencies are no longer associated with the sensor vibration isolation to be concerned of.

Fig. 4 Response of the sensor under an impulse excitation from the FEM and analytical solution
The calculations from approximate equation and simple FEM model are intended to confirm the vibration properties of the sensor holder for the evaluation of vibration isolation scheme and selection of structure materials. In addition, it is important to know possible resonant frequencies of the holder and sensor itself. Such calculations will also be confirmed with later measurements with prototypes of vibration isolation structures. The combination of calculations and measurements are needed for the full plan of vibration isolation structure design and evaluation as requested.
3 Vibration measurement of a container
After the completion of vibration analysis with this simple model and calculations, it is time to validate the calculation for design of vibration isolation structure. The important parameters now include the excitation to be considered, because the sensor properties have been validated. To this objective, a measurement from the container in lifting and moving processes for the properties of shock and vibrations are to be conducted. Since the vibration frequencies of the sensor are so different in different modes, it is important to find the most frequency and significant frequencies as the targeted dynamic loads. This has to be done by in-situ measurement of vibration signals in different conditions.
The actual measurement was done in the freight container yard. The standard containers were selected for routine operations of the loading and unloading process by heavy lifts. The objective of the measurement is to find out the properties of impact impulse of the lifting and moving processes and some basic properties of the container and sensor holders. To be consistent with the objective, a laser vibrometer (Sunny Optical Technology Limited, Yuyao, Ningbo, China) was used for the vibration measurement. The measurement was completed in one day in several rounds to ensure the consistency of data and loadings. The data was compared after processing and it is proved that the measurement was successful. The sensor holders and data collection point V1 are shown in Fig. 5. Data are also collected from another sensor at point denoted as V2. Since the data are similar after analysis, only the results from V1 is shown here.

Fig. 5 The data collecting spot V1 of the sensor holder for vibration measurement
The measurement was done at two spots for check and validation purpose. Because the sensor holder is small, it is expected the measured vibrations and properties should be close without significant difference. The data sweeping frequency is 12800Hz for the displacement and acceleration relative to the ground.
3.1 Vibration data from point V1 and the FFT analysis
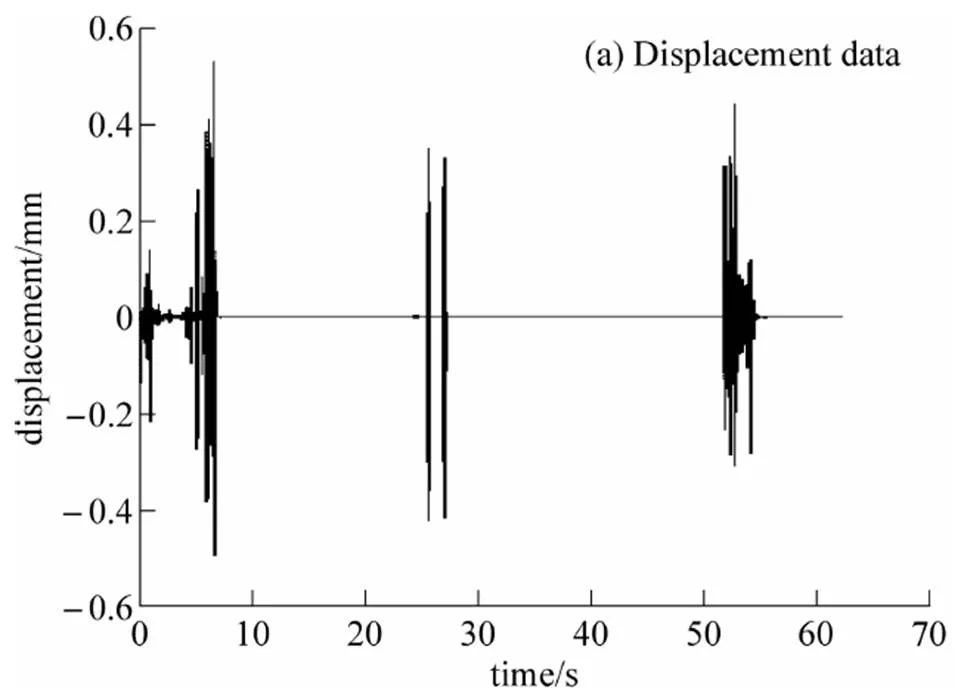
The displacement data from point V1 is plotted as the histogram and the Fast Fourier Transformation (FFT)[23]in Fig. 6. It is clear from the histogram in Fig. 6(a) that the displacement is larger at certain times, and the large displacement is in lower frequency as in Fig. 6(b). Since the properties of data are not clear in Fig. 6, more details need to be examined by different data packs.
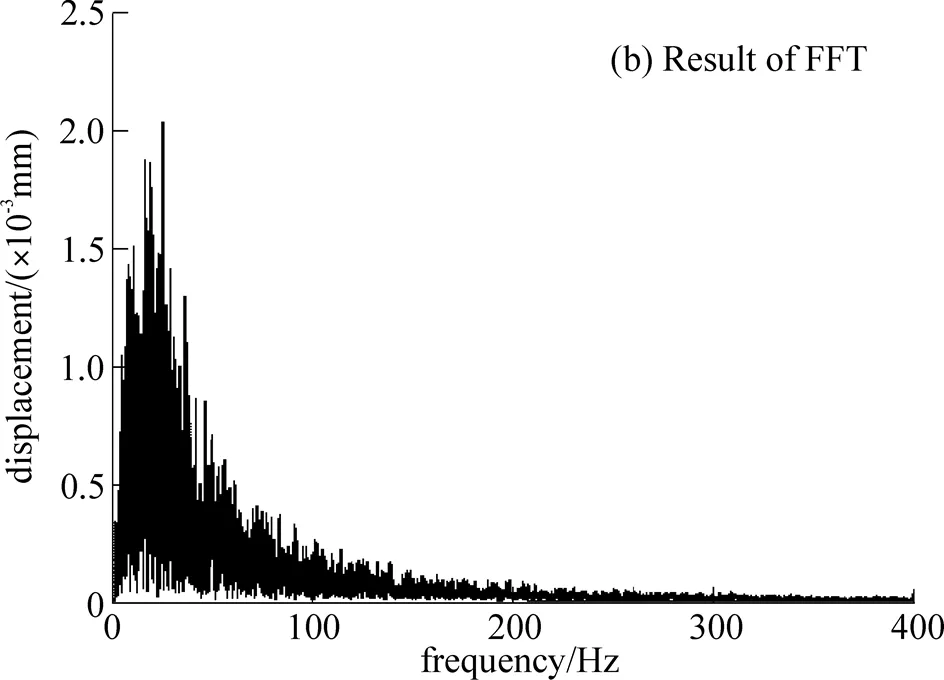
Fig. 6 Displacement data at point V1 and its FFT
Now the time series of displacement at point V1 is divided into different intervals for the FFT analysis with local details in Fig. 7.
3.1.1 The first data pack in time interval 0–1.5s
It is clear this is an impact impulse with a larger single peak and smaller displacement (Fig. 7). The peak frequency is 15.33Hz. It is likely an impact impulse from the collision between the lift hook and the container.
3.1.2 The second data pack in time interval 25.3–25.8s
The displacement is relatively large with a peak frequency at 22Hz (Fig. 8). This is also an impact impulse between the lift hook and container.

3.1.3 The third data pack in time interval 26.7–27.1s
This is similar to previous data pack (Fig. 9). It is the impact impulse with a peak frequency at 17.5Hz.
The displacement data from points V1 and V2 are highly similar in waveform and essential properties. There are differences in peak frequencies, but it is likely to be associated with the differences of the sensor holders, hook, and positions. The peak frequencies from point V1 are 15.33Hz, 17.5Hz and 22Hz, and V2 are 11.43Hz, 12.5Hz and 26Hz. The large displacements of the sensor holder surface are caused by the impact signal.

3.2 The analyses of accelerations of point V1 of the sensor holder
The data analysis of acceleration measurement is also performed in separated time intervals, just as for displacement in previous section. The results are used to check some essential properties as a way of verification.
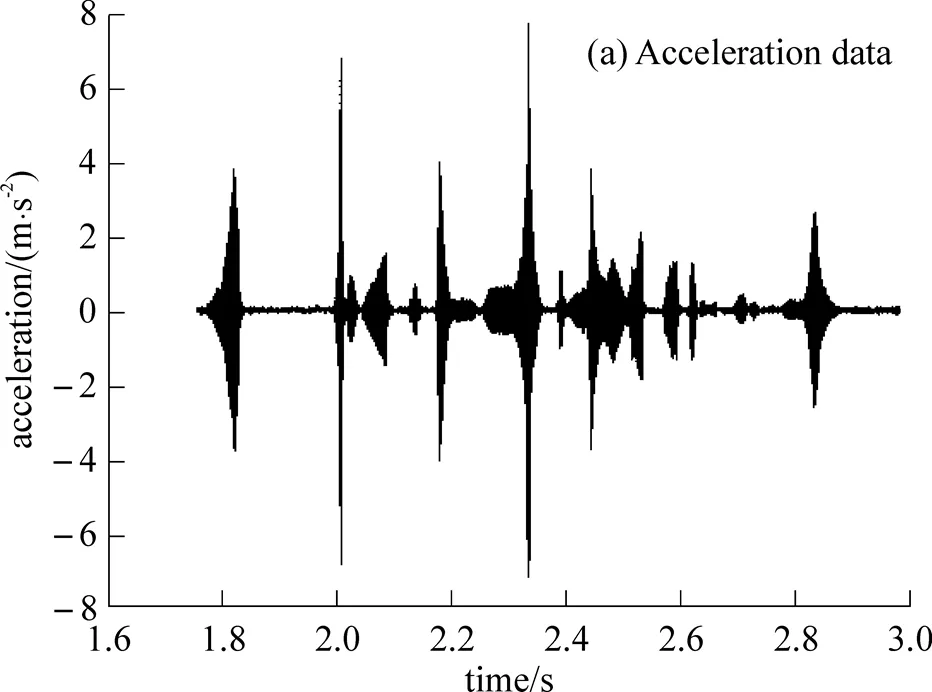
The acceleration data from point V1 is shown in Fig. 10. More peaks of acceleration can be observed with clusters of a few frequencies, just as the displacement data in previous figures. The data will be examined also in different time intervals.
3.2.1 The first data pack of acceleration in 1.76–1.83s
By comparing the time of occurrence, it is clear this is also from the impact impulse (Fig. 11). The displacement is low, as found in Figs. 7–9, but the acceleration is high. It is believed this is from the resonance induced by the high-frequency components of vibrations of the impact at the vibration frequency of the cantilever plate.

3.2.2 The second data pack of acceleration in 2.78– 2.88s
This is a perfectly damped vibration under excitation with the frequency centered at 4097Hz, which is close to the first data pack. Again, this is the resonance of steel plate caused by the high frequency components of the impact (Fig. 12).

3.2.3 The third data pack of acceleration in 2.83–2.88s
This is a damped vibration without the growth phase, implying the vibration could be further amplified by the later excitation (Fig. 13). The peak frequency is 4099Hz, similar to earlier acceleration response. It further reinforced the frequency feature of the steel plate under resonance.
From both points V1 and V2, there is a strong resonance in the vicinity of 4100Hz, although there is a small difference in the properties of accelerations from measurements of the two points. The steel plate and attachment can cause the differences, but they all are close to 4100Hz, which is believed to be the lowest flexural vibration frequency of the steel plate from the estimation at the beginning. There is always a strong resonance at this frequency induced the high frequency components of the impact vibrations.
3.3 Summary of measurement data of vibrations
From analyses of vibration data of two measurement spots, it proved that the measurement of vibrations of sensor holders is successful. These data will be useful for the design of vibration isolation and control apparatus. There are some differences which are minimal between the two measurement points, therefore, the results have been validated by each other. By summarizing the analyses of measurement data, it can be concluded that the impact vibrations have a frequency range from 12–25Hz, which causes large displacements of the bottom plate of the sensor holders. In vibration control, this low frequency vibration needs to be taken into consideration seriously.
From the acceleration data of two measurement points, large acceleration was observed at 4100Hz with clear presence of damping. It shows that there is a strong response of sensor holder acceleration at that frequency. Since there are no high frequency signals in the measured displacements, it is clear that the response is just from the excitation of the high-frequency components of impact vibrations. This is the frequency of the flexural vibrations of the steel plate, and the differences are from the structure, position, and possibly materials.
In summary, the peak responses are observed in ranges of 12–25Hz and 4100–5000Hz from measure- ments. Therefore, the vibration control design for the sensor holders should be focused on vibrations at 15Hz and 4100Hz for both free and forced vibrations in relation to the design and evaluation with structure and material consideration.
4 Conclusions
Through a systematic analysis and measurement, vibration properties of the sensor holder of a container are obtained and validated as part of the efforts in the design of vibration control structure for the positioning sensor. The vibration frequencies of the holder are well separated, implying that the lower and high frequencies vibrations cannot be well controlled with the simple structure of a rubber pad. From the measurement, it is clear that one of the excitations comes at 12Hz through the impact between the hook and container. This vibration causes the largest displacement, but the interferences with sensor holders are limited. The largest acceleration comes at 4100Hz, which is the induced resonance of the cantilever steel plates. This could be the major vibration disrupting the operations of sensors. Of course, one more testing is needed on the resonance frequencies of the sensor itself, which will be fatal if there is an internal resonance caused by the impact frequency. Actually, there could be many resonant frequencies of sensor interacting with container vibrations in the lifting and moving operations with cranes. The interrupting of sensor functions and damages to sensors are the bigger concerns with noticeable economic costs, and remedies with full considerations of vibrations of the container, holder, and sensor itself will provide solutions to ensure smooth operations and savings of the equipment.
The analysis of vibrations of sensor compartment structures and impact loadings provide much needed information for the design of control apparatus. Further testing on the sensor structure will provide more information required to design solutions to improve the safety of sensors on containers. This will be major task with efforts in different areas to satisfy the objective of improving the container transporting in a large port with increasingly automatic and intelligent operations.
Acknowledgment
The authors acknowledge the participation of testing and analysis of Dr. Bin Huang, Yangyang Zhang, and Lijun Yi of Piezoelectric Device Laboratory, Ningbo University, and Messrs. Yijun Zhou, Shuang Liu, and Xusheng Zhang of Sunny Optical Technology Limited.
[1] Peeters B, Maeck J, de Roeck G. Vibration-based damage detection in civil engineering: Excitation sources and temperature effects[J]. Smart Materials and Structures, 2001, 10(3):518-527.
[2] Nakra B C. Vibration control in machines and structures using viscoelastic damping[J]. Journal of Sound and Vibration, 1998, 211(3):449-466.
[3] Genta G. Vibration of Structures and Machines: Practical Aspects[M]. 3rd ed. New York: Springer Science & Business Media, 1999.
[4] Yang D H, Shin J H, Lee H, et al. Active vibration control of structure by active mass damper and multi-modal negative acceleration feedback control algorithm[J]. Journal of Sound and Vibration, 2017, 392:18-30.
[5] Hudson M J, Reynolds P. Implementation considerations for active vibration control in the design of floor structures[J]. Engineering Structures, 2012, 44:334-358.
[6] Chandrashekhar M, Ganguli R. Damage assessment of structures with uncertainty by using mode-shape curvatures and fuzzy logic[J]. Journal of Sound and Vibration, 2009, 326(3/4/5):939-957.
[7] Gibson R F. Modal vibration response measurements for characterization of composite materials and structures[J]. Composites Science and Technology, 2000, 60(15):2769- 2780.
[8] Huda F, Kajiwara I, Hosoya N, et al. Bolt loosening analysis and diagnosis by non-contact laser excitation vibration tests[J]. Mechanical Systems and Signal Processing, 2013, 40(2):589-604.
[9] Ma T F, Wang J, Du J K, et al. Resonances and energy trapping in AT-cut quartz resonators operating with fast shear modes driven by lateral electric fields produced by surface electrodes[J]. Ultrasonics, 2015, 59:14-20.
[10] Wang J, Shen L J. Exact thickness-shear resonance frequency of electroded piezoelectric crystal plates[J]. Journal of Zhejiang University: Science A, 2005, 6(9): 980-985.
[11] Keane A J. Passive vibration control via unusual geometries: The application of genetic algorithm optimization to structural design[J]. Journal of Sound and Vibration, 1995, 185(3):441-453.
[12] Uquillas D R, Yeh S S. Tool holder sensor design for measuring the cutting force in CNC turning machines [C]//IEEE International Conference on Advanced Intelligent Mechatronics. IEEE, 2015:1218-1223.
[13] de Sousa H M, Matos J C, Figueiras J A. Development of an embedded sensor holder for concrete structures monitoring[J]. Carbon, 2006, 28(3):2-58.
[14] Liu J, Zhang M H, Du J K, et al. Frequency perturbation integral for FBAR mass sensors and frequency shifts due to nonuniform mass layers[J]. Applied Acoustics, 2021, 172:107592.
[15] Wang J. The extended Rayleigh-Ritz method for an analysis of nonlinear vibrations[J]. Mechanics of Advanced Materials and Structures, 2021(3):1892888.
[16] Xie L T, Wang S Y , Zhang C Z, et al. An analysis of the thickness vibration of an unelectroded doubly-rotated quartz circular plate[J]. The Journal of the Acoustical Society of America, 2018, 144(2):814-821.
[17] Pezerat C, Guyader J L. Identification of vibration sources[J]. Applied Acoustics, 2000, 61(3):309-324.
[18] Sortino M, Totis G, Prosperi F. Modeling the dynamic properties of conventional and high-damping boring bars[J]. Mechanical Systems and Signal Processing, 2013, 34(1/2):340-352.
[19] Chakraverty S. Vibration of Plates[M]. New York: CRC Press, 2009.
[20] Kohnke P C. ANSYS[M]. Berlin: Springer Heidelberg, 1982.
[21] Huang Q X, Zhao G H, Zhou C L, et al. Experiment and simulation analysis of roll-bonded Q235 steel plate[J]. Revista De Metalurgia, 2016, 52(2):e069.
[22] Ju S H, Ni S H. Determining Rayleigh damping parameters of soils for finite element analysis[J]. International Journal for Numerical and Analytical Methods in Geomechanics, 2007, 31(10):1239-1255.
[23] Varkonyi-Koczy A R. A recursive fast Fourier transfor- mation algorithm[J]. Circuits & Systems II: Analog & Digital Signal Processing, 2002, 42(9):614-616.
集装箱提升和移动中传感器支架振动的测量
田 昊1, 黄 奇2, 吴增文1, 王 骥1*
(1.宁波大学 机械工程与力学学院, 浙江 宁波 315211; 2.湖州职业技术学院 建筑工程学院, 浙江 湖州 313000)
在起重机搬运集装箱的过程中, 振动和冲击会损坏集装箱的底层结构(如传感器支架). 为确保传感器支架在运输时正常工作, 对传感器的状态进行监测并采取相应补救措施. 通过理论分析和实验测量相结合的方式, 对集装箱结构中传感器支架的振动进行了研究. 结果表明, 在12~25Hz频段, 传感器支架有较大的位移响应; 在4100~5000Hz频段, 传感器支架有较大的加速度响应. 因此, 可以针对这两个主要频率区间进行初步隔振方案设计, 并讨论可行性分析和优化目标.
振动; 测量; 激光; 分析; 结构; 集装箱
2021−04−28.
国家自然科学基金(16472142); 宁波市科技创新2025计划(2019B10122).
田昊(1992-), 男, 吉林松原人, 在读硕士研究生, 主要研究方向: 振动测试与分析. E-mail: 261364590@qq.com
王骥(1962-), 男, 甘肃徽县人, 教授, 主要研究方向: 压电声波谐振器. E-mail: wangji@nbu.edu.cn
O329
A
1001-5132(2022)02-0079-10
宁波大学学报(理工版)网址: http://journallg.nbu.edu.cn/
(责任编辑 章践立)
猜你喜欢
丝绸(2022年5期)2022-05-25
地震研究(2021年1期)2021-04-13
民生周刊(2020年18期)2020-09-08
大陆桥视野·上(2017年5期)2017-06-27
航运交易公报(2016年49期)2017-04-17
航运交易公报(2016年9期)2016-03-19
CHIP新电脑(2016年3期)2016-03-10
CHIP新电脑(2016年3期)2016-03-10
中国篆刻·书画教育(2014年4期)2014-07-05
卫星电视与宽带多媒体(2013年12期)2013-07-23