
Discovery of 4-Thiazol-N-(pyridin-2-yl)pyrimidin-2-amine as Novel Cyclin-dependent Kinases 4 and 6 Dual Inhibitors via 3D-QSAR and Molecular Simulation①
2022-04-16 03:05FULeZHAOLiNnGUOHongMeiYUQUANWenXunCHENYiSHUMoWANGRuiLINZhiHu
结构化学 2022年3期
FU Le ZHAO Li-Nn GUO Hong-Mei YU N QUAN Wen-Xun CHEN Yi SHU Mo② WANG Rui LIN Zhi-Hu②
a (School of Pharmacy and Bioengineering, Chongqing University of Technology, Chongqing 400054, China)
b (Qianjiang Central Hospital of Chongqing, Chongqing 409099, China)
ABSTRACT Cyclin D dependent kinases 4/6 regulate the entry of cells into S phase and are effective target for the discovery of anticancer drugs. In this article, 3D-QSAR modeling including comparative molecular field analysis (CoMFA) and comparative molecular similarity indices analysis fields (CoMSIA) was implemented on 52 dual CDK4/6 inhibitors. As a result, we obtained a pretty good 3D-QSAR model, which is CoMFACDK4 with q2 to be 0.543 and r2 to be 0.967; CoMSIACDK4 with q2 being 0.518 and r2 being 0.937; CoMFACDK6 with q2 to be 0.624 and r2 to be 0.984; CoMSIACDK6 with q2 being 0.584 and r2 being 0.975. Molecular docking confirmed the important residues for interactions. Molecular dynamics simulation further confirmed binding affinity with key residues of protein, such as Lys22, Lys35, Val96 for CDK4 and Lys43, His100, Val101 for CDK6 at the active sites. Then these results offered new directions to explore new inhibitors of CDK4/6. Finally, we designed 10 novel compounds with promising expected activity and ADME/T properties, and provided referable synthetic routes.
Keywords: cyclin-dependent kinases 4 and 6 dual inhibitors, 3D-QSAR, drug design, molecular simulation;
1 INTRODUCTION
During the ordered cell cycle, cell undergoes a transition from quiescence or cytoplasmic division to cell proliferation,and checkpoints then further screen for stable genomes. It consists of four consecutive phases: G1 (pre-DNA synthesis),S (DNA synthesis), G2 (predivision) and M (cell division)[1].Cells remain quiescent by deciding to enter S phase or signaling pathways that link extracellular signals to G1 phase.At the same time, the G1 phase depends on retinal tumor cells to inhibit the expression of protein (Rbs). Rbs protein works by inhibiting the E2 promoter binding factor (E2F)transcription factor, which is essential for G1 to S phase transition. Released E2F transcription factor phosphorylates CDKs retinoblastoma protein (Rb) that promotes the transcription of genes encoding proteins (Cyclin A and Cyclin E)required for DNA replication in G1 phase. CDK4 and CDK6 are the main kinases of G1 phase phosphatization in mammalian cells[2].
Previous researches have demonstrated the CDK4/6-Rb-E2F way is blocked in ninety percent of cancers[3]. In addition, genetic researches have demonstrated that inactivation of CDK4/6 merely applies the proliferation of particular cell and that CDK4/6 is optional for mitotic cycle. Therefore,CDK4/6 is potential targets for the treatment of cancer[4]. As approved by the FDA first CDK4/6 inhibitors, palbociclib has approved for metastatic breast cancer combining with letrozole or fluvistat[5,6]. This stands for a significant scientific advance in the field. However, the discovery of new skeleton CDK4/6 inhibitors and their derivatives remains a challenge.
Since major inhibitors combine to conserved sites of ATP-binding, target selectivity is still not conquered. For example, many clinically used CDK4/6 inhibitors (palbociclib, abemaciclib and ribociclib shown in Fig. 1) disclose some additional targets for a near kinome-wide scope[7]. The off-targets can compromise drug safety and cause differential cellular efficacy and clinical responses. For instance, ribociclib and palbociclib are primarily myelotoxic. Instead,abemaciclib leads to plentiful reactions. Palbociclib and ribociclib should be used periodically, while abemaciclib should continue to be used because of the relatively less proof of neutrophil reduction[8]. Jointly, these evidences suggest that the introduction of new pharmaceutical groups may increase kinase selectivity, thereby reducing adverse side effects.
In our ongoing research for novel and highly CDK-targeting drugs, we used computational ways including 3D-QSAR, drug design, molecular docking and dynamic simulation to study 4-thiazol-N-(pyridin-2-yl)pyrimidin-2-amine CDK4/6 inhibitors with a view to designing novel, highly selective and orally bioavailable dual CDK4/6 inhibitors.

Fig. 1. Structures of CDK4/6 inhibitors
2 COMPUTATIONAL METHODS
2. 1 Data source and processing
The structures of dual CDK4/6 inhibitors were got from the literatures[9-11]. In general, the lowest-energy conformation is more stable and is theoretically thought to be active in small molecules. All molecules were optimized by adding Gasteiger-Huckel charge, Powll energy gradient mean and Tripos force field in SYBYL-X2.0 software[12]. All parameters were default except the maximum optimization limit and convergence criterion. They were set as 10000 times and 0.005 kcal/mol, respectively[13]. To build CoMFA/CoMSIA model, the dataset was randomly divided into training set(quantity = 40) and test set marked with “*” in Table 1S. At the same time, Table 1 contains active data (pKi= -logKi)[14].

Table 1. Chemical Structures of Dual CDK4/6 Inhibitors
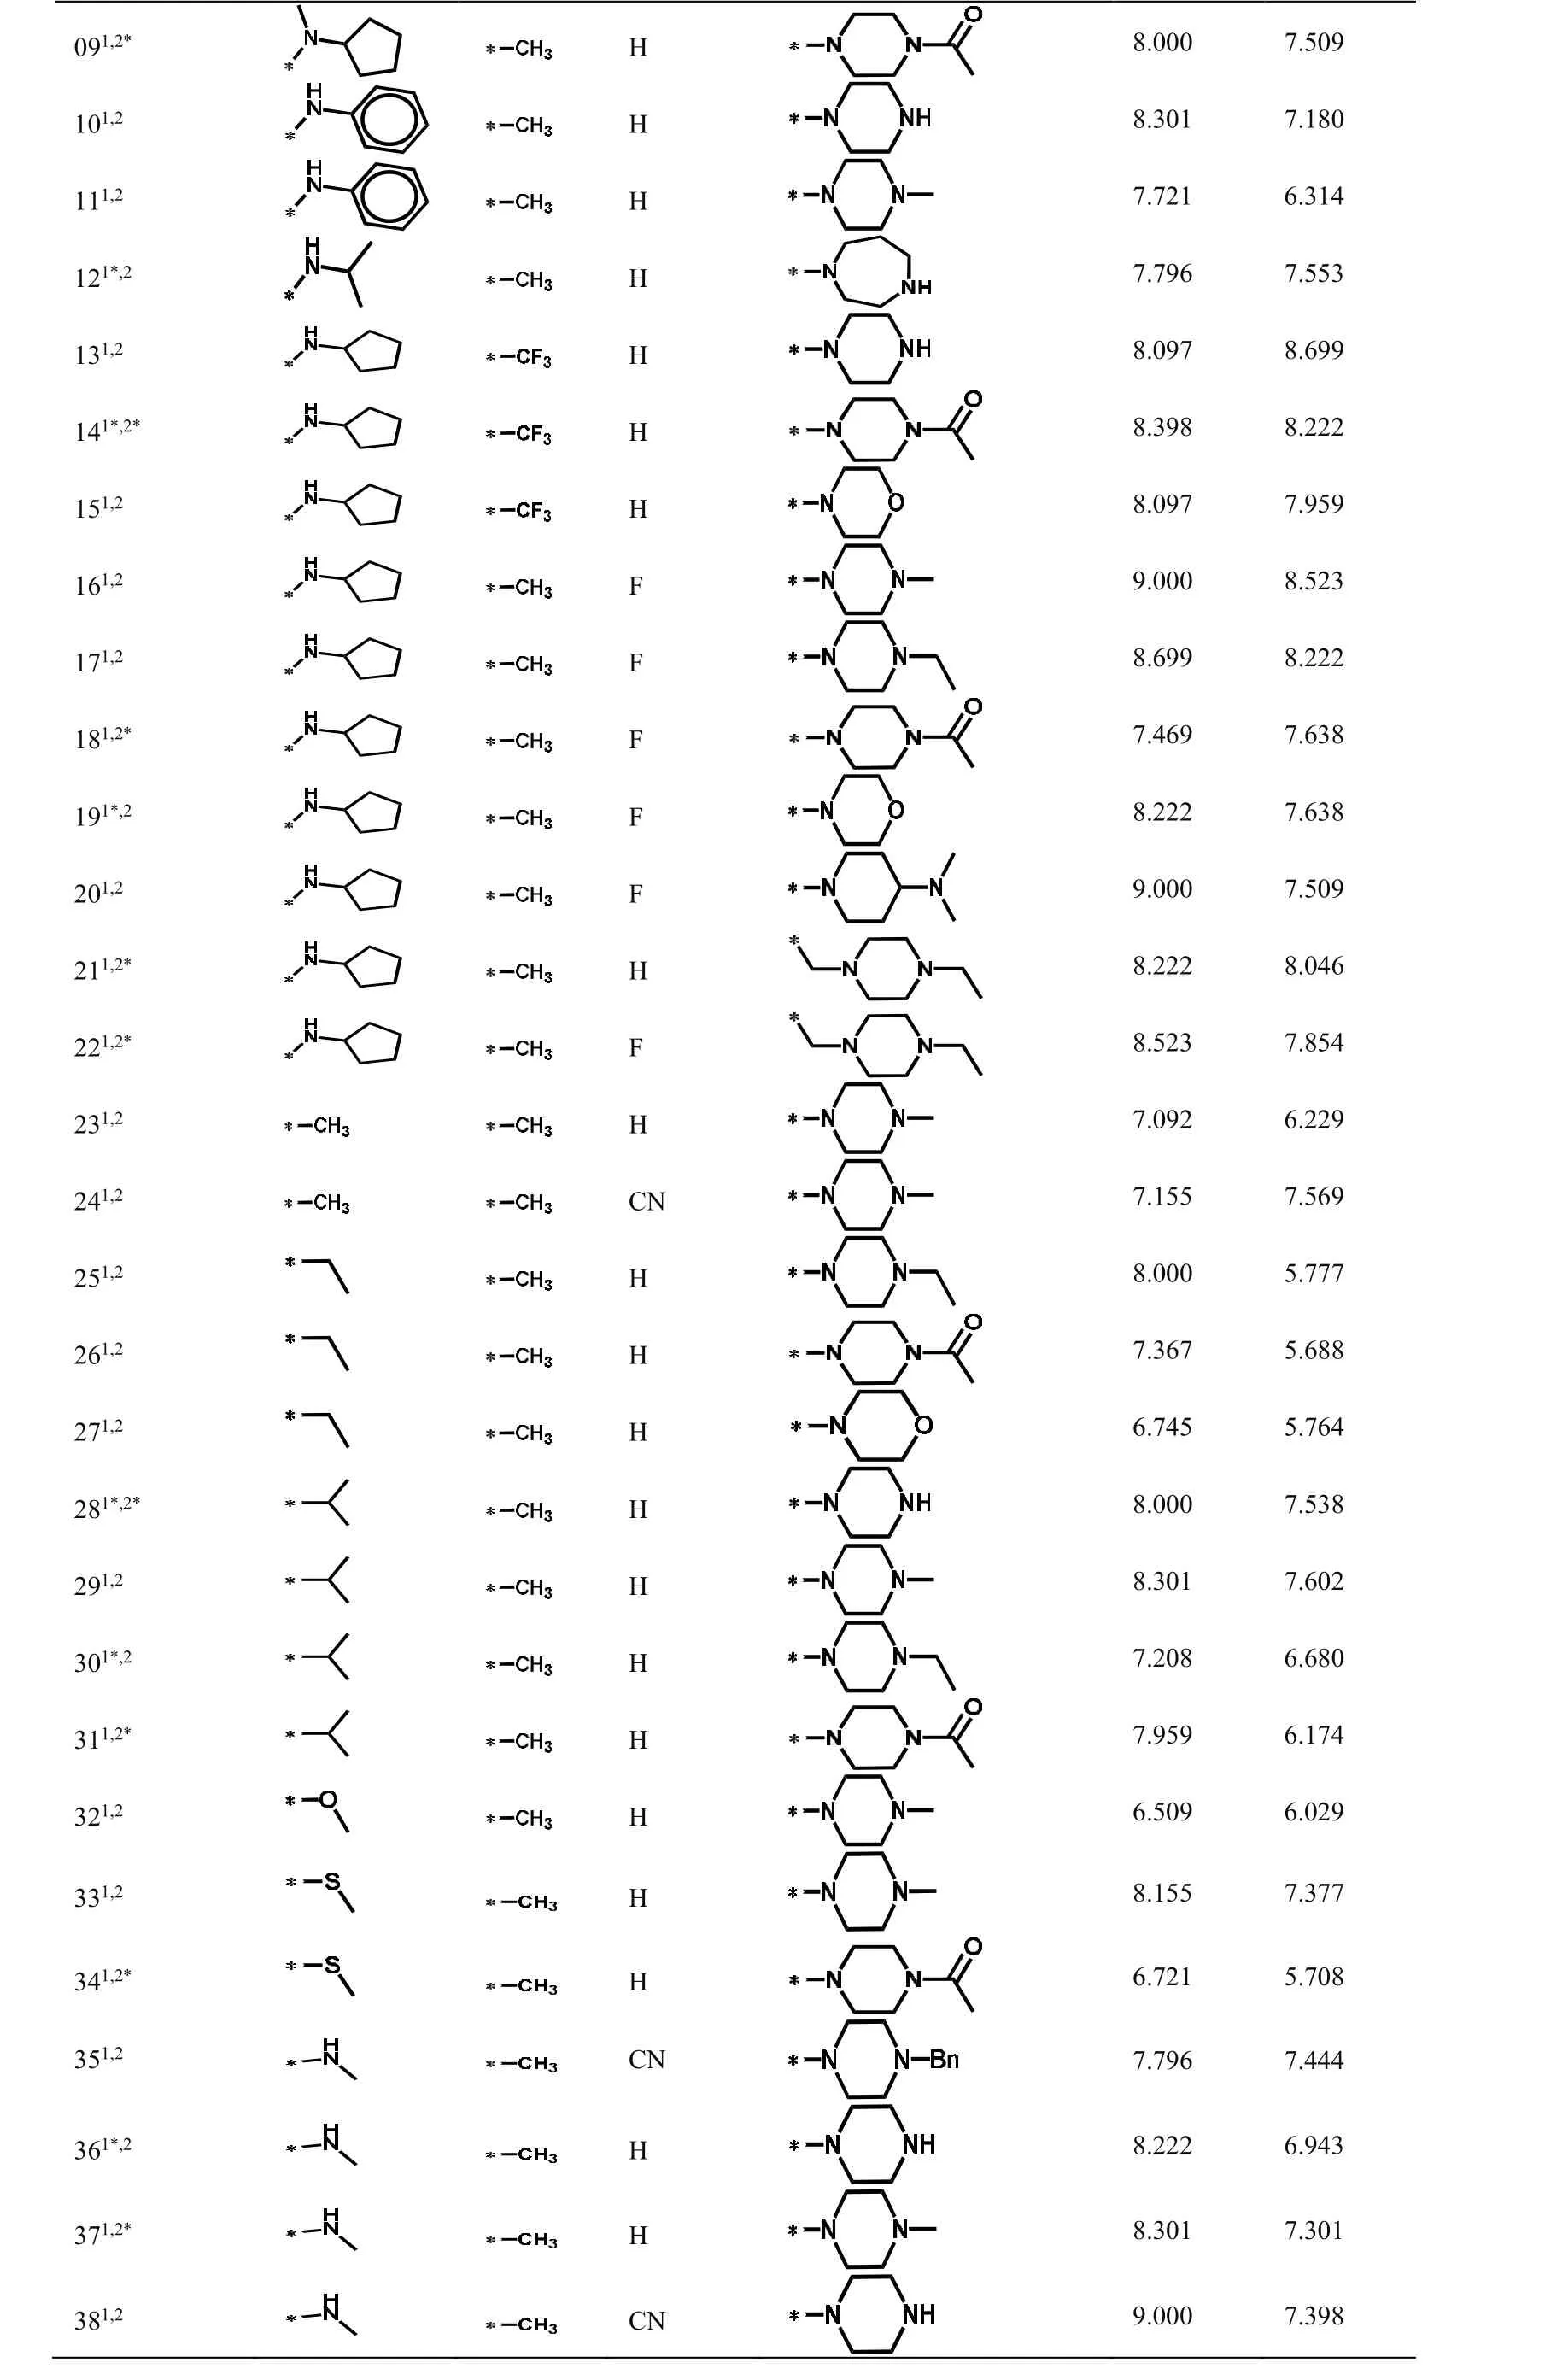
091,2*H 8.000 7.509 101,2 H images/BZ_129_1440_422_1474_443.png8.301 7.180 111,2 H 7.721 6.314 121*,2 H 7.796 7.553 131,2 H images/BZ_129_1440_693_1474_714.png8.097 8.699 141*,2*H 8.398 8.222 151,2 H 8.097 7.959 161,2 F 9.000 8.523 171,2 F 8.699 8.222 181,2*F 7.469 7.638 191*,2 F 8.222 7.638 201,2 F 9.000 7.509 211,2*H 8.222 8.046 221,2*F 8.523 7.854 231,2 H 7.092 6.229 241,2 CN 7.155 7.569 251,2 H 8.000 5.777 261,2 H 7.367 5.688 271,2 H 6.745 5.764 281*,2*H images/BZ_129_1440_2043_1474_2064.png8.000 7.538 291,2 H 8.301 7.602 301*,2 H 7.208 6.680 311,2*H 7.959 6.174 321,2 H 6.509 6.029 331,2 H 8.155 7.377 341,2*H 6.721 5.708 351,2 CN images/BZ_129_1476_2694_1506_2717.png7.796 7.444 361*,2 H images/BZ_129_1443_2794_1479_2816.png8.222 6.943 371,2*H 8.301 7.301 381,2 CN images/BZ_129_1443_2993_1479_3015.png9.000 7.398
1: CDK4 training set molecules; 2: CDK6 training set molecules; *: Corresponding test set molecules
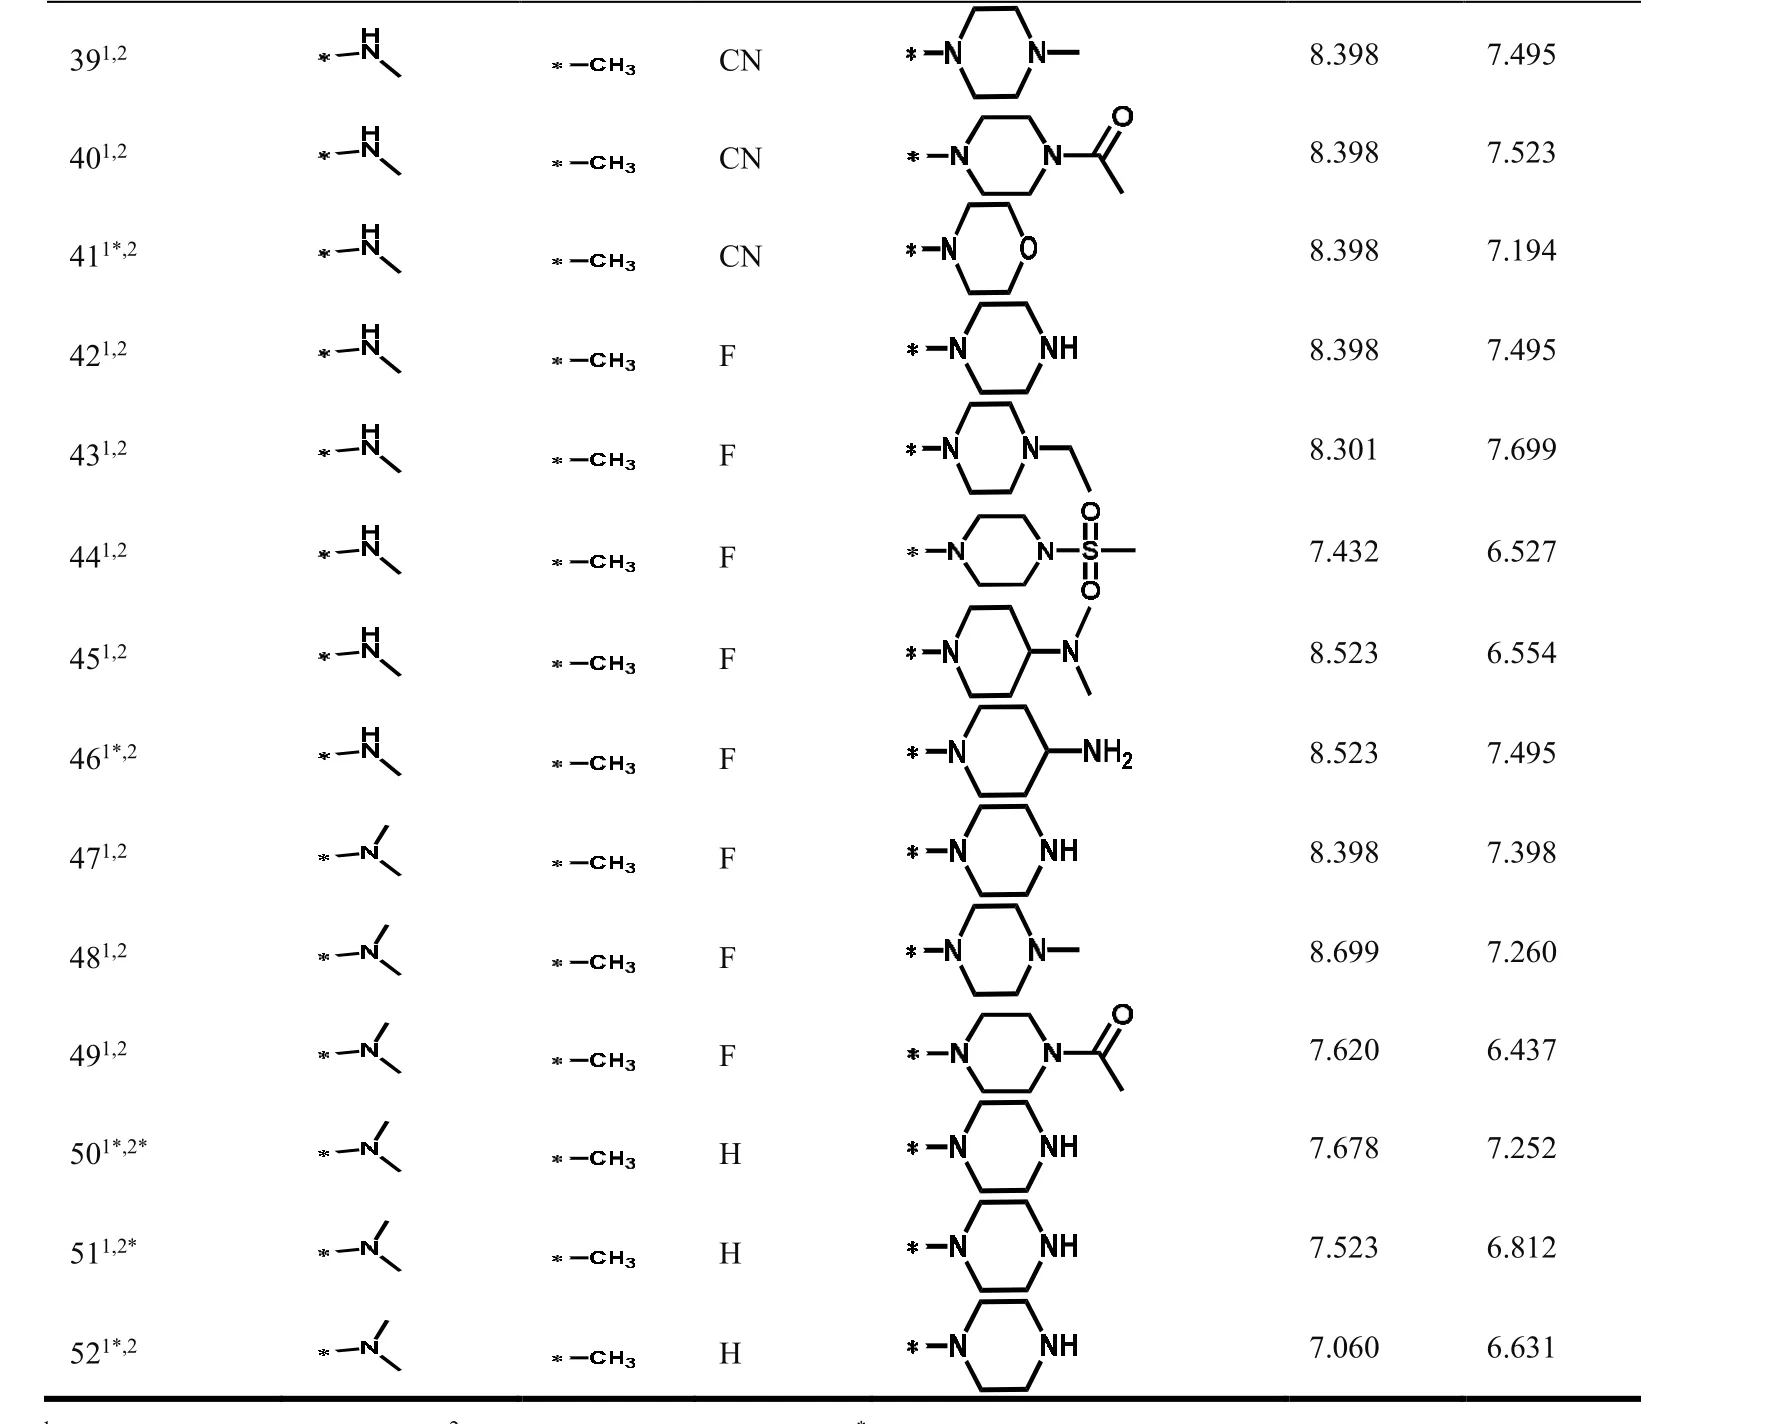
Fig. 2. (a) Alignment of dual CDK4/6 inhibitors; (b) Structure of compound 16
2. 2 Molecular alignment
Molecular alignment is a necessary preparation for obtaining reliable 3D-QSAR model[15]. Compound database alignment is the process of collecting molecular descriptors in pharmaceutical molecules and simulating action points[16].We selected compound 16 as the template, which has the highest activity. After selecting violet-red common Skeleton(Fig. 2a)[17], the superimposed structures of aligned compounds are shown in Fig. 2b.
2. 3 3D-QSAR model modeling
Using CoMFA and CoMSIA methods generated 3D-QSAR models. Using Coulomb method to compute the electrostatic field contribution and using Lennard-Jones method to compute the stereo field contribution in CoMFA model[18]. The CoMSIA model is established by introducing additional hydrogen bond application field, hydrogen bonding body field and hydrophobic field, and calculating molecular field using Gauss function[19].
In the research, the correlation coefficient (q2) and the best principal component value (n) of cross validation were determined by leave one method (LOO) for cross validation.We performed non-cross-validation using previously acquired N values to estimate the general determination factor (r2). In addition, the estimated standard error (SEE) and Fischer statistical values (F) were determined[20]. So far, we constructed the CoMFA and CoMSIA models.
2. 4 3D-QSAR model verification
2. 4. 1 Internal verification
2. 4. 1. 1 Partial least-squares analysis
PLS verification (cross-verification, non-cross-verification)of 3D-QSAR models was computed in SYBYL X2.0 software. In internal verification, a responsible 3D-QSAR model makes sure to meet the following criteria:q2> 0.5,r2> 0.9,the smaller SEE value is better, and the F value is opposite[21-23].
2. 4. 1. 2 Bootstrap analysis
After the PLS analysis of 3D-QSAR model, to further verify the statistical quality and stability of the model from the training set, the bootstrap analysis for 20 runs was implemented in Sybyl-X2.0 software[24,25]. And it means the model is more reliable because ther2bsvalue is greater than 0.9 and theSDbsvalue is smaller.
2. 4. 1. 3 Applicability domain (AD)
The applicability domain is important to check the stability of model. The applicability field requires that each compound must be within the interval of residual limits (σ±3), and its lever thresholdhimust be smaller than critical leverageh*[26,27].

wherexi(i≤n) means the descriptor row-vector of the molecules,Xthen×k-1matrix, n the number of all compounds and k is the number of model descriptors.
2. 4. 2 External verification
Usually, the responsible 3D-QSAR model should need to satisfy both internal and external verification. The external verification of the model is judged based onr2m> 0.5 in Roy’s method;r2pred> 0.5 in Cruciani-Baroni’s method andSDEPextwas calulated by the following Eqs[28,29].

2. 5 Molecular docking
The Surflex-Dock function in Sybyl-X2.0 was employed to conduct molecular docking studies to study the binding mode of CDK4/6 kinase and dual inhibitors. The 3Dstructures of modelling CDK4 (pdb code: 2W9Z, 2.45 Å) and CDK6 (pdb code: 2EUF, 3.00 Å) were used for molecular docking. A suitable docking pocket is generated in the mating mode with default values for adjustable parameters. The active pocket(light gray surface) was defined by amino acids and ranges from about 0.5 Å to the original molecules and the protomols(Fig. 3). The original molecules were re-docked to binding pockets to validate the dependability of docking method. The newly designed compounds and template molecules were docked into CDK4/6. Lastly, the binding models were analyzed using the Analytics Complex tool of PyMOL[30]and Discovery Studio 3.0[31]softwares.

Fig. 3. Binding pockets of (a) CDK4 and (b) CDK6
2. 6 MD simulation
MD simulation was executed with AMBER16 package[32,33].Receptor loaded ff99SB force field[34]and ligand loaded general GAFF[35], whole complex system was solvated in TIP3PBOX (Buffer ≥ 10.0 Å) and then the system was electrically neutral by adding sodium and chloride ions.
We optimized the system to avoid unreasonable structural areas in the system. Then the system was gradually heated to 300 K and ultimately stayed the same. Finally, the temperature fluctuated around 300 K in the next stage. The entire MD process took 2 fs as the time step. Periodic boundary conditions were used to keep constant pressure and temperature. The Langevin dynamics method was used to adjust the temperature at a collision frequency of 2 ps. The Particle Mesh Ewald (PME) method was employed to handle longrange electrostatics and the range of actual cutoff spatial interaction was less than 1 nm. Hydrogen atoms were limited by SHAKE method. Next, 100 ns MD simulation was performed, and save their trajectory every 2 ps.
The MM/GBSA algorithm was used to process procreant MD simulation trajectories and calculate the binding energy with crystal complexes of different ligands[36,37]. Total of 100 frames were collected at last 10 ns to calculate the energy.Formula is as below:

2. 7 ADME/T property and synthesizable evaluation
ADME/T, including absorption, distribution, metabolism,elimination and toxicity, is a critical parameter that is commonly used in clinical trials and the selection of the development of drugs[38]. We evaluate the synthetic availability by utilizing SwissADME website (http://www.swissadme.ch/index.php). For uploaded compounds, the web server can predict the percentage of absorption of the drug in intestine of human. When the absorbent degree (HIA) is less than 30%,poor absorption is commonly considered. A higher VD value(VDss logL/kg) indicates that the molecules are mainly distributed in the tissue. Online tools assess whether molecules may be metabolized by CYP450 subtypes, or become CYP450 inhibitors. The total clearance rate (CL tot) is about bio-utilization and the dosing rate is determined to achieve a stable state concentration (logmL/min/kg). Skin sensitivity/AMES toxicity/hepatotoxicity message was made to evaluate the possible toxicity of molecules.
The synthesizable evaluation of newly designed compounds was calculated by loading the SwissADME website(http://www.swissadme.ch). The scoresynwas closer to 10, the more difficult to synthesize. The value closer to 1 meant the synthesis route is relatively simpler. Finally, we designed a feasible synthesis route according to the existing synthesis methods in relevant articles.
3 RESULTS AND DISCUSSION
3. 1 3D-QSAR model analysis and statistical verification
The compounds of training set were modeled by CoMFA and CoMSIA methods and obtain reliable models. We can see that those force fields (Table 2) have made the main contribution to the activity and should be considered in the process of designing new compounds.
In the CoMFACDK4model, the steric and electrostatic fields contribute 77.1% and 22.9%, respectively, indicating the former is greater.
In the CoMSIACDK4model, the steric, electrostatic and hydrophobic fields in the model contribute 20.9%, 32.1% and 47.0%, respectively, indicating that the hydrogen bond donor fields and electrostatic fields contribute greater.
In the CoMFACDK6model, the steric and electrostatic fields contribute 76.7% and 23.3%, respectively. It shows that the contribution of the steric field to the model is greater.
In the CoMSIACDK6model, the steric, electrostatic and hydrophobic fields in the model contribute 18.4%, 31.9% and 49.7%, respectively. Therefore, the electrostatic and hydrogen bond donor fields have greater contributes.
Generally, the model needs to satisfy standards of internal and external verification to verify the 3D-QSAR model has a reliable predictive ability. The models all satisfy the standards (Table 2 and Fig. 4), which indicates the models constructed is statistically significant.
Finally, by observing the fit of the experimental activity value (pKi) and the predicted activity value (pKi) in Table 3 and Fig. 5, we found that almost all the compounds are close to or located on the trend line of Fig. 5, with a good linear relationship. In Fig. 4, the application domain of the model is characterized by the Williams diagrams, and the test set compounds are all within the application domain of the models. In conclusion, the established 3D-QSAR model has good predictive ability and robustness.

Table 2. Correlation Coefficients of 3D-QSAR Models
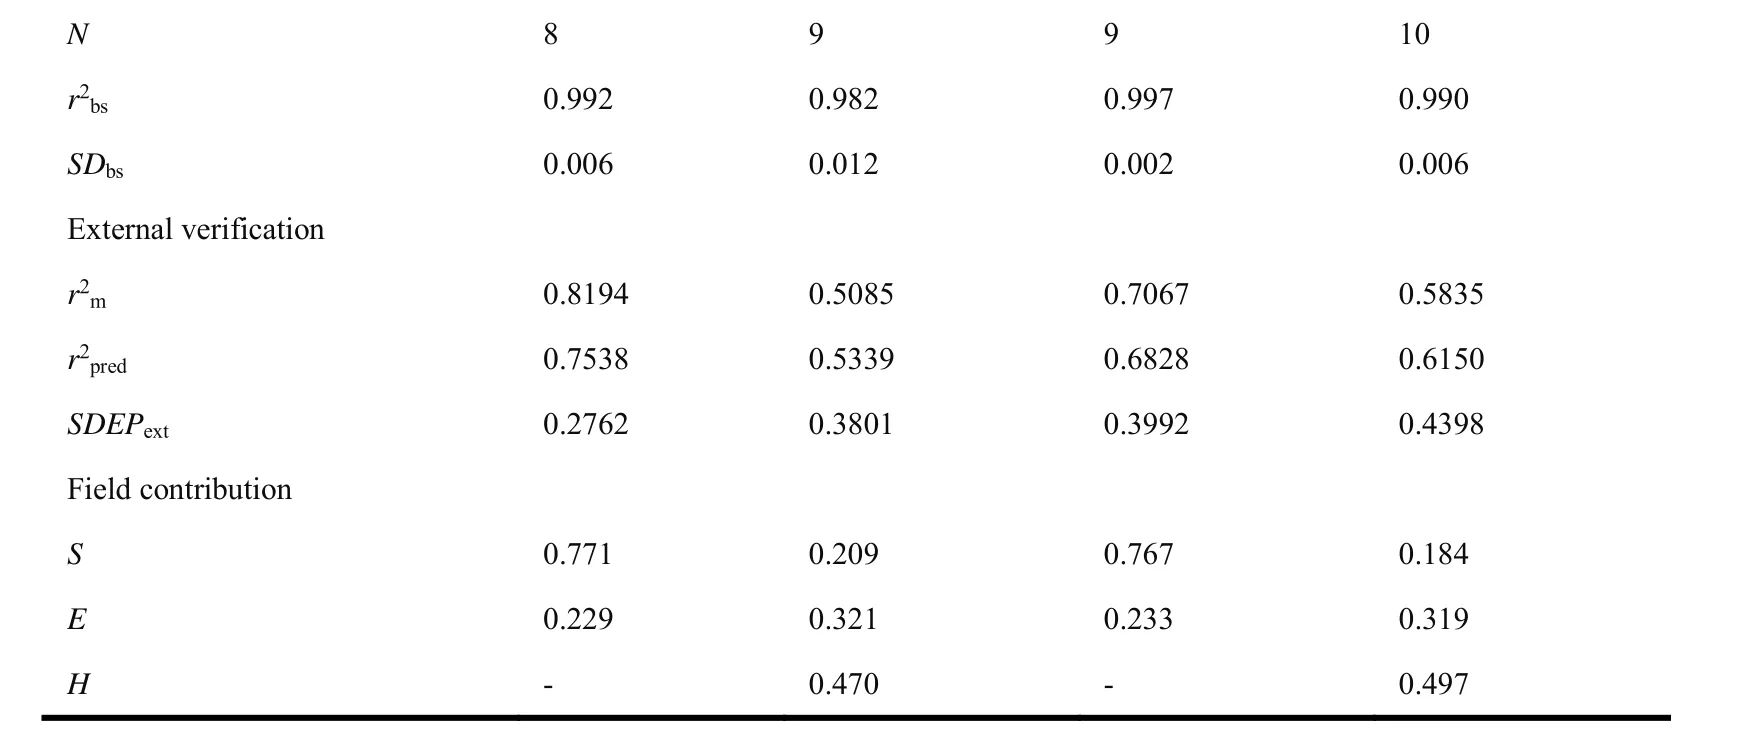
N 8 9 9 10 r2bs 0.992 0.982 0.997 0.990 SDbs 0.006 0.012 0.002 0.006 External verification r2m 0.8194 0.5085 0.7067 0.5835 r2pred 0.7538 0.5339 0.6828 0.6150 SDEPext 0.2762 0.3801 0.3992 0.4398 Field contribution S 0.771 0.209 0.767 0.184 E 0.229 0.321 0.233 0.319 H - 0.470 - 0.497
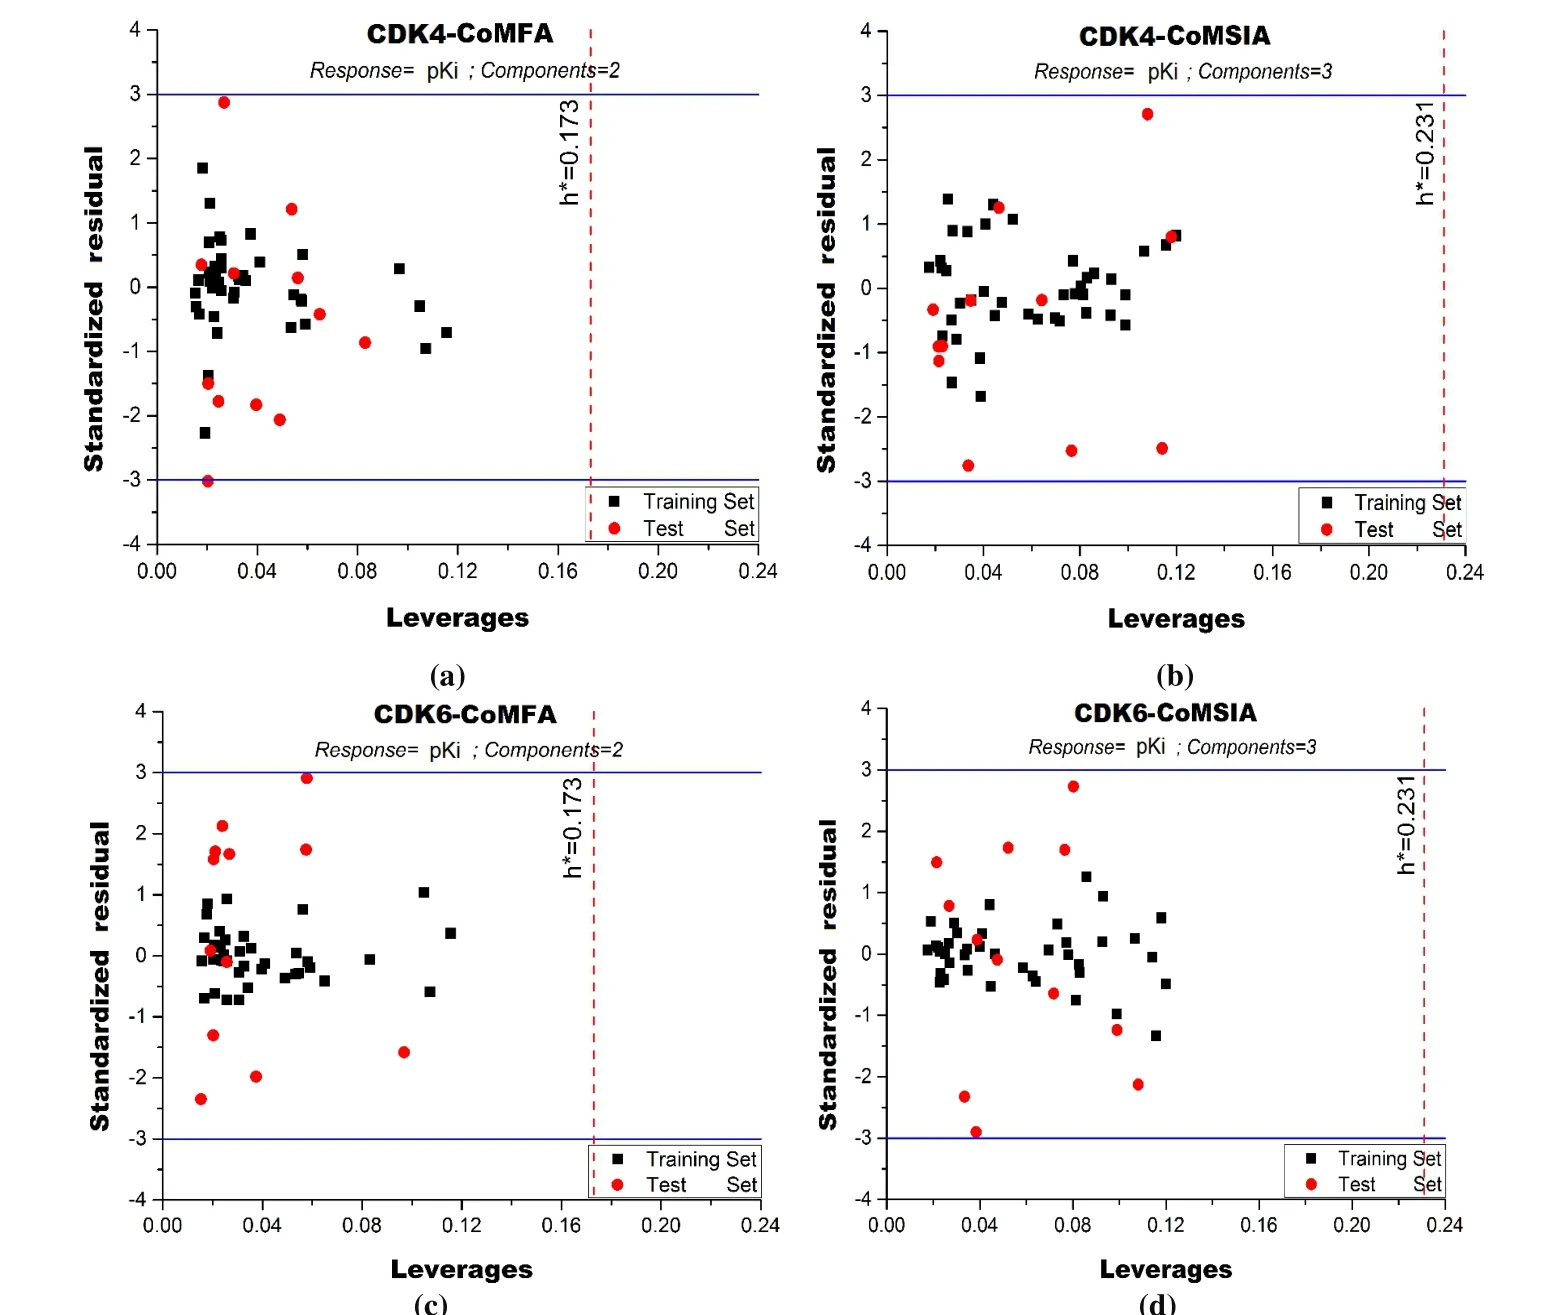
Fig. 4. Williams plots for 3D-QSAR models

Table 3. Predicted Activity Values (pKi) and Residual in the 3D-QSAR Model
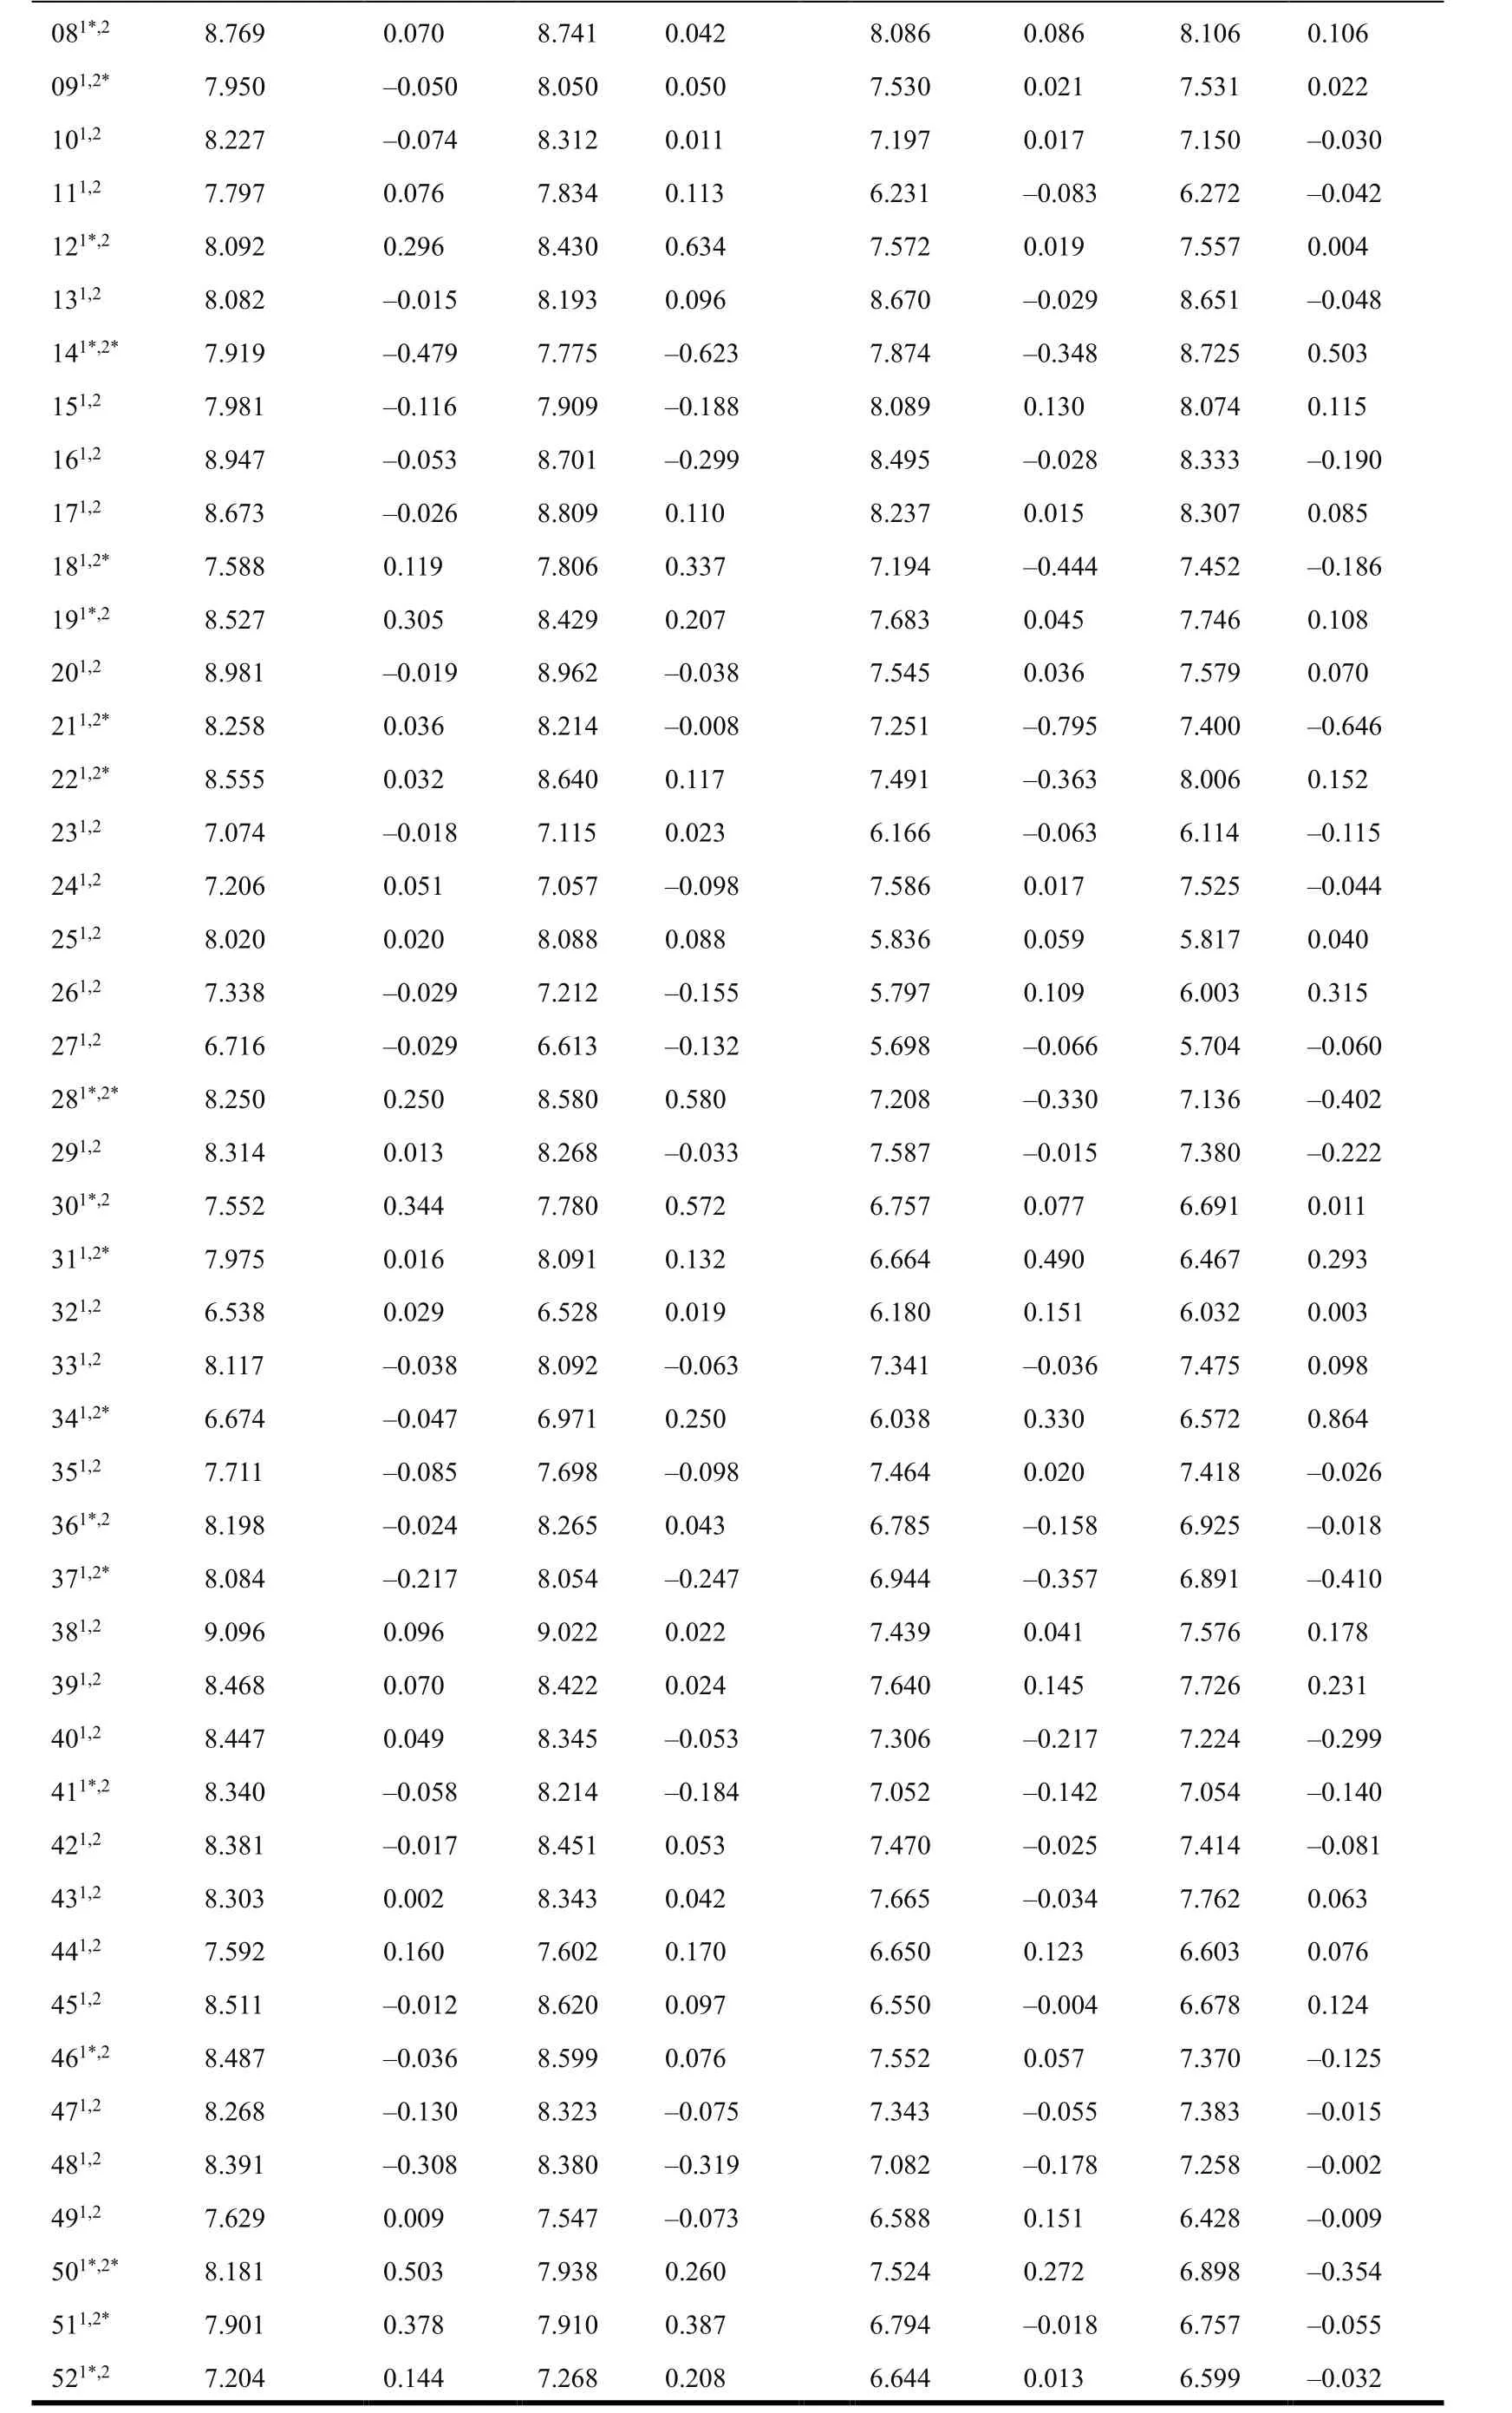
1: CDK4 training set; 2: CDK6 training set; *: test set

Fig. 5. Fitting curves of the actual and predicted activities of the training and test sets
3. 2 Contour diagrams analysis of the 3D-QSAR
We studied the counter diagrams of CoMFA and CoMSIA models by using template compound 16. Based on the feasibility of actual synthesis, it could be used for further structural modification of the template compound.

Fig. 6. Contour diagrams of CoMFA and CoMSIA. CoMFACDK4 (a) stereo (b) electrostatic;CoMSIACDK4 (c) stereo (d) electrostatic (e) hydrophobic field contour diagrams; CoMFACDK6 (f) stereo(g) electrostatic; CoMSIACDK6 (h) stereo (i) electrostatic (j) hydrophobic
Figs. 6a, 6c, 6f, and 6h show the all stereo fields of CoMFA and CoMSIA models. The green contour indicates that the activity of compound will increase with more substituent groups, but the yellow contour is unfavorite. The main color contours are distributed around rings D and E using comprehensive analysis. It implies the introduction of a large steric hindrance group or the increase of the number of groups on ring E; The positions of N(18) of ring D can be substituted, so it can be suitable to introduce small groups or not.
In the electrostatic field, the blue area showed that the activity of the compound increases gradually with the increase of positively charged groups, while the red area is the unfavorite.Some positively charged groups can be introduced on ring B to increase the biological activity of the compound in Figs. 6b, 6d,6g, and 6i. Conversely, increasing negatively charged groups on position C(19) of ring D could facilitate the activity of the molecule.
The yellow region (Fig. 6e) indicated that increasing hydrophobic groups can promote activity, and the C(30) and C(33)substituents of ring E are closer to the yellow area in Fig. 6j. In summary, when designing compounds, rings B, D and E are the main group modified region can enhance the activity.

Fig. 7. Re-docked results of the original ligand; Original conformation (yellow) and the re-docked conformation (cyan); Hydrogen bond interaction are marked with red dashed lines

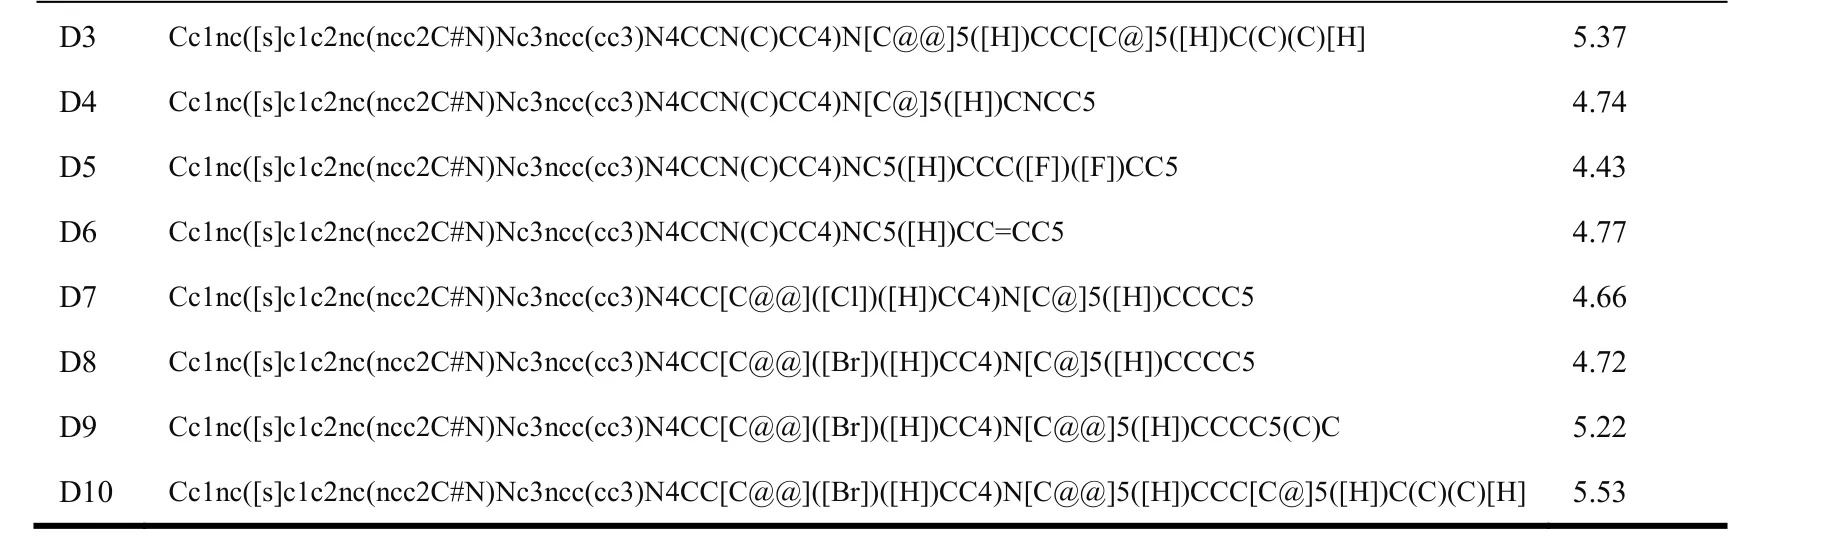
Table 4. Information of Template Compound and the New Compounds
3. 3 Molecular docking
We used the Surflex-Dock module in the Sybyl-X2.0 software to perform molecular docking. By re-docking ligand in the initial crystal structure back to the active site and then calculating the RMSD 1.143 Å in CDK4 and 1.147 Å in CDK6 (< 2.000 Å), we can see the docking results were reliable[39]. Since compound 16 is the most active, it was regarded as a template to study the interaction after molecular docking. Then, new compounds were designed.
Surflex-Docking results of compound 16 with CDK4/6 are shown. We observed that these bidentate hydrogen bonds are formed between the Val96/Val101 amino acids and compound 16 of the N(3) and N(7)-H atoms in CDK4/6 kinase,marked with a red dashed line in the results of re-docking and docking novel and template molecules (Figs.7a and 7b).Nowadays, the relevant literature also reports the contribution of these two hydrogen bonds to the inhibition. Hence, the hydrogen bonds mentioned above should be considered in the new design of compounds.
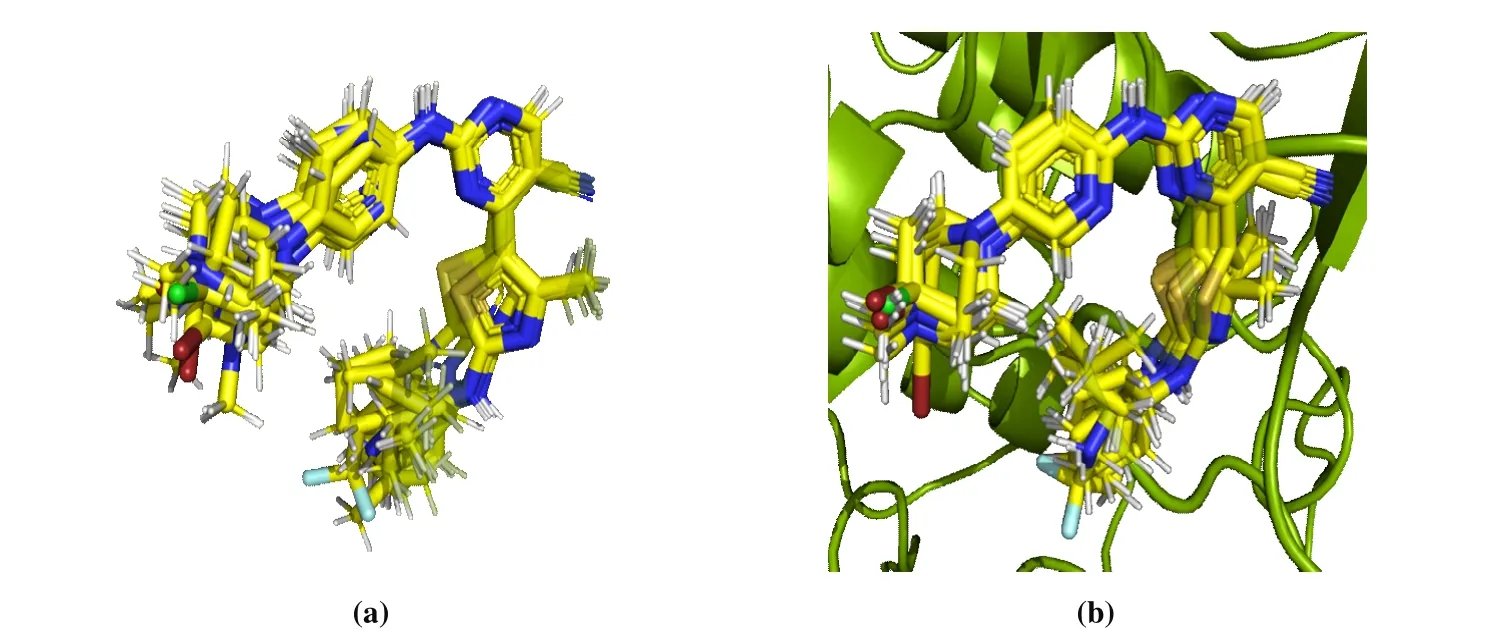
Fig. 8. Docking conformation of the CDK4/6 crystal structure with the novel and template molecules
3. 4 Design new compounds and predict activity
Lead compound 16 was modified in view of the 3D-QSAR models and related results. Subsequently, new inhibitors with higher activity were designed.
In this article, we designed 10 new compounds and used the 3D-QSAR model to predict their activity, while we also performed molecular docking to assess their binding ability with the target protein by total score. Table 4 lists the designed molecular structure, predicted activity and docking score. Most newly designed compounds have higher pKi and docking scores.
By docking the template molecule and 10 new molecules into the active site, we found that these compounds are well incorporated in the active sites (Fig. 8).
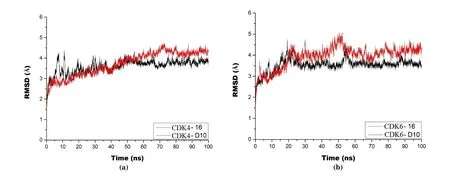
Fig. 9. RMSD of complexes CDK4/6 docking with compound 16/D10 for 100 ns simulations
3. 5 MD simulation and MM/GBSA
To validate whether new inhibitors predicted by the 3D-QSAR models and molecular docking can bind well to the CDK4/6 proteins, we performed MD simulations of compounds 16 and D10 with the best average predictive activity value and the best docking scores. The RMSD of CDK4 complexed compound 16/D10 fluctuated around ~4.25 and ~3.75 Å, respectively after 70 ns simulation (Fig. 9a).For the docking results of CDK6 and compound 16/D10, the RMSD of the complexes also remained stable at ~4.0 and~3.5 Å after 70 ns simulation (Fig. 9b). The RMSDs of above complexes were stable in the late simulation stage. The above analysis results indicated that these four complexes reached a metastable stage, and RMSD values of the designed compound D10 in the stable phase are all smaller than the template molecule, indicating that the designed molecule has better binding ability with the target proteins.
Then as shown in Fig. 10, we compared the interaction before and after MD simulation. Compounds 16 and D10 both formed hydrogen bonds with amino acid residues Val96 and Lys22 of CDK4, marked with a red dashed line. Before MD simulation, the unstable hydrogen bond formed between compound 16 and lys35 of CDK4 but lys35 changes to hydrogen bond toπ-NH interaction, which is marked with magenta dotted line. Similarly, compounds 16 and D10 both formed hydrogen bonds with amino acid residues Val101 of CDK6. Compared with compound 16, compound D10 could form stable hydrogen key with amino acid residues His100 of CDK4/6. Compound D10 also formed hydrogen bond (Lys43)in CDK6 protein, which enhanced the binding between proteins and small molecules to a certain extent.
Furthermore, it has been reported that above hydrogen bonds, Val96 (CDK4)[10], Val101 (CDK6) and His100(CDK6)[9,10]can greatly affect the activity of inhibitors, and build a further theoretical basis for the design of inhibitors.The re-docking result of original ligand in the crystal structure also proves the above-mentioned hydrogen bonding interactions.
After MD simulation, we used MM/GBSA method to decompose binding free energy to find the key residues in the binding process of CDK4/6 and the inhibitor. The binding free energies and decomposed energy items in the MD process are shown and listed in Fig. 11 and Table 5. Compared with compound 16, compound D10 has better binding energy and forms a key residue role with more amino acids, indicating compound D10 may have better bioactivity.

Fig. 10. Interaction between CDK4/6 and compound 16/D10 before and after 100 ns MD simulation

Fig. 11. Contributions of key residues of CDK4/6
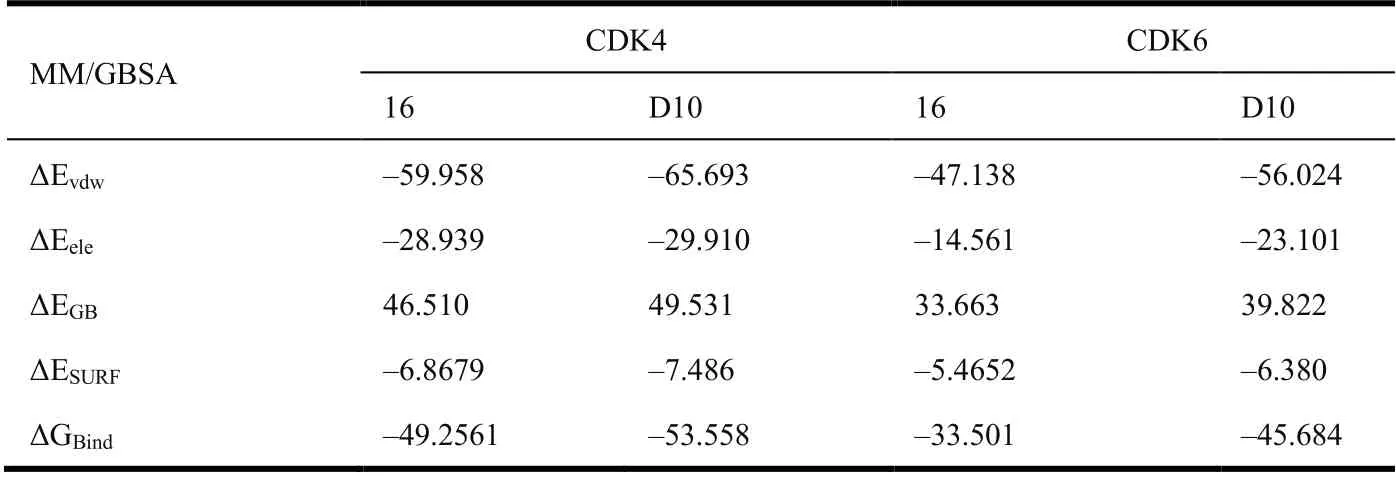
Table 5. Binding Free Energies (kcal/mol)
3. 6 Synthesizable evaluation and reference synthetic route
Then synthesizable evaluation scores (Scoresyn) of newly designed compounds ranged between 4.29 and 5.53 which are close to that of the template compound 16, thus proving we could increase the inhibitory activity of compounds by introducing related groups. Meanwhile, introducing related chemical substituents did not make the synthesis process difficult and they all had the appropriate synthesis possibilities (Table 6).
According to the existing literature[9-11], we designed a more reliable synthesis route (Fig. 12), and proved the CAS number of the required reaction substrate (Table 7), providing a reliable source of synthetic materials and further synthesis possibilities for the synthesis of the newly designed compound(Please refer to the above literatures for more detailed synthetic experiments).

Table 6. Synthesis Accessibility of New Compounds
Scoresyn: synthetic accessibility from 1(very easy) to 10 (very difficult)

Table 7. CAS Number of Substrates

Fig. 12. Reference synthesis route of the novel compounds
Reagents and conditions: (a) CS2, NEt3, Boc2O, DMAP, EtOH, rt, 30 min, ice bath, 15 min, rt, 30 min; (b) NH3, H2O, MeOH, rt, 24 h; (c)ethyl-2-chloroacetoacetate, DMAP, CH2Cl2, rt, 4 h; (d) di-tert-butyl dicarbonate, DCM, Et3N, 8 h, rt; (e) LiNiPr2, CH3CN, -78 ℃, 10 min; o/n, HCl, H2O,48%; (f) DMF-DMA, reflux, 8 h; (g) 5-bromo-2-nitropyridine, DMSO, Et3N, 120 ℃, 16 h; (h) H2, 10%Pd/C, CH3OH, 6.5~12 h, rt; (i)N,N′-bis-Boc-S-methylisothiourea, Et3N, HgCl2, DCM, 0 ℃, 0.5 h, rt, 14 h; (j) TFA/DCM/H2O (18:9:1), rt, 16 h; (k) NaOH, 2-methoxyethanol, microwave, 180 ℃, 1 h
3. 7 ADMET profiles
ADME/T profiles were predicted using pkCSM web server(Table 8) to investigate the druggability of the newly designed compounds. HIA of them changed from 88.371% to 95.057%(> 30%), explaining all newly compounds have high absorptive capacity. The VDs of most new compounds were less than compound 16 (0.71 low ~ 2.81 high), which meant all compounds fall within the proper range. For pharmacokinetics,3A4 subtypes might metabolize all compounds, and 2D6 subtypes might not metabolize. Additionally, the above molecules could not restrain CYP450 1A2 and 2D6, whereas the others could restrain the CYP450 3A4 subtype. Renal and hepatic tissues could be clear based on total clearance rate.The predicted toxicity results show the lead compound and all newly designed compounds may damage the human liver, but are not sensitizing to the skin. In summary, we considered newly designed compounds could be as potential inhibitors by ADMET.

Table 8. ADMET Properties
4 CONCLUSION
In this article, the reliable 3D-QSAR model was constructed as CDK4/6 dual inhibitors. Compared with CoMFA model, CoMSIA model introduces hydrophobic field, hydrogen bond donor field and hydrogen bond acceptor field to improve the accuracy of model. 3D-QSAR results showed that the model satisfied relevant statistical correlation and strict internal and external verification requirements, indicating the model has good predictive ability. At the same time,molecular docking and MD simulation further studied the newly designed compounds. MD simulation showed that relevant hydrogen bond andπ-NH interactions were important to the binding process. We designed new compounds with good bioactivity, good ADME/T properties, suitable synthesis possibility and reference synthesis process based on 3D-QSAR model. Besides, compounds 16 and D10 could bind to CDK4/6 by hydrogen key andπ-alkyl interaction.There are some key residues Lys22/Lys35/Val96 (CDK4) and Lys43/His100/Val101 (CDK6) in the binding sites. These results showed compound D10 may have better bioactivity and provide a theoretical foundation for the further research.Therefore, we provide here a useful reference and new idea for further study and synthesis of dual CDK4/6 inhibitors by using reliable computer-aided drug design methods.
- 结构化学的其它文章
- Structural and Electronic Properties of Lutetium Doped Germanium Clusters LuGen(+/0/-) (n = 6~19):A Density Functional Theory Investigation①
- Discovery of Benzimidazole Derivatives as Novel Aldosterone Synthase Inhibitors: QSAR, Docking Studies, and Molecular Dynamics Simulation①
- QSAR Models for Predicting Additive and Synergistic Toxicities of Binary Pesticide Mixtures on Scenedesmus Obliquus①
- Preparation, Crystal Structure and Fungicidal Activity of N-(5-(benzofuranol-7-oxymethyl)-1,3,4-thiadiazol-2-yl)amide Compounds①
- Antibiotic Silver Particles Coated Graphene Oxide/polyurethane Nanocomposites Foams and Its Mechanical Properties①
- Planar Tetracoordinate Carbon in 6σ + 2π Double Aromatic CBe42- Derivatives①