
First identification of two co-existing genome-wide significant sex quantitative trait loci (QTL) in red tilapia using integrative QTL mapping
2022-04-28 06:47ZongXianZhuYiLongLinChunHuiAiYingYingXiongDanDanHuangYinYiYaoTongDeLiuChaoHaoChenHaoRanLinJunHongXia
Zoological Research 2022年2期
Zong-Xian Zhu, Yi-Long Lin, Chun-Hui Ai, Ying-Ying Xiong, Dan-Dan Huang, Yin-Yi Yao, Tong-De Liu, Chao-Hao Chen, Hao-Ran Lin, Jun-Hong Xia,3,*
1 College of Life Sciences, State Key Laboratory of Biocontrol, Institute of Aquatic Economic Animals and Guangdong Provincial Key Laboratory for Aquatic Economic Animals, Sun Yat-Sen University, Guangzhou, Guangdong 510275, China
2 College of Traditional Chinese Medicine, Guangdong Pharmaceutical University, Guangzhou, Guangdong 510006, China
3 Maoming Branch, Guangdong Laboratory for Lingnan Modern Agriculture, Maoming, Guangdong 525000, China
ABSTRACT
Keywords: Red tilapia; QTL mapping; Sex; SNPs
INTRODUCTION
Sex determination (SD) is highly complex in vertebrates and can be classified into environmental sex determination (ESD),genetic sex determination (GSD), and their combination(Bachtrog et al, 2014; Li & Gui, 2018; Nagahama et al, 2021;Rajendiran et al, 2021; Renn & Hurd, 2021).The GSD system can be further classified into the male heterogametic system(sex chromosome: XX/XY), female heterogametic system (sex chromosome: ZW/ZZ), and polygenic SD system (Geffroy et al, 2021; Nagahama et al, 2021; Toyota et al, 2021).The two sex chromosome systems have been identified in fish, but most species have no obvious morphological sex chromosome (Feller et al, 2021; Nakamura, 2009; Sarre et al,2011; Xue et al, 2021).Recently, multiple chromosomes have been found to determine sex in distinct fish species such as Amazonian catfish (Sassi et al, 2020).
Tilapia is one of the most important fish groups in world aquaculture.In 2018, global aquaculture production of tilapia(includingOreochromis niloticus,O.aureus(blue tilapia), andOreochromisspp.(e.g., red tilapia)) reached 5.57 million tons,second only to carp (FAO, 2020).Tilapia is an excellent model for exploring sex determination mechanisms (Wessels et al,2017).Both GSD and ESD sex regulation have been identified in different tilapia species.The female ZW/ZZ system is dominant inO.aureus(Mair et al, 1991b), while the male XX/XY system is found inO.niloticusandSarotherodon melanotheron(Gammerdinger et al, 2016; Mair et al, 1991a).
Genetic markers associated with sex determination have been successfully detected on ChrLG1 (O.niloticus), ChrLG3(O.karongae,Tilapia mariae,andO.aureus), and ChrLG23 (a cross between red tilapia andO.niloticus) in various tilapia(Cnaani et al, 2008; Cnaani et al, 2004; Ezaz et al, 2004;Gammerdinger et al, 2016; Lee et al, 2004; Lee et al, 2005;Liu et al, 2013).ChrLG3 has been considered as a potential sex chromosome due to the abnormal morphology of chromosomes in blue and Nile tilapia (Cnaani et al, 2008;Triay et al, 2020).Recent progress in quantitative trait loci(QTL) mapping with high-throughput sequencing data suggests there are genome-wide significant QTL controlling sex on ChrLG1 (10.1–18.9 Mb), ChrLG3 (40–80 Mb),ChrLG20 (12.6–29.1 Mb), ChrLG22 and ChrLG23 (24–40 Mb)in Nile tilapia (Gammerdinger et al, 2016; Palaiokostas et al,2013; Triay et al, 2020).
Identification of sex-related genes is of great significance for tilapia breeding using molecular techniques.The first SD gene reported in fish,Dmy, is required for normal male development in medaka (Matsuda et al, 2002).In tilapia,amhy, a Y-specific duplicate of the anti-Müllerian hormone (amh) gene, regulates male development in Nile tilapia (Li et al, 2015; Taslima et al,2020; Triay et al, 2020).Recently, several sex-related genes,such astsp1a, have been implicated in female folliculogenesis development in Nile tilapia (Jie et al, 2020), andPaicsshows female-specific patterns during early gonadogenesis (Tao et al, 2021).However, most studies have focused on the identification of sex-related genes in Nile and blue tilapia, with limited research on red tilapia.
Red tilapia is popular in aquaculture due to its bright red appearance, fast growth rate, high salinity tolerance, high commercial value, and strong adaptability (Jiang et al, 2019; Li et al, 2019; Pradeep et al, 2014).Nevertheless, red tilapia has a complex genetic background, and may originate from Nile,blue, and Mozambique tilapia (Sandeep et al, 2012; Xia et al,2015).To increase red tilapia yield in aquaculture by controlling sex, it is crucial to explore the genetic architecture of sex.At present, however, the sex determination mechanism in red tilapia remains unclear.
In this study, we carried out integrative QTL mapping analysis for sex in four mapping populations using QTL-seq,linkage-based QTL mapping, and linkage disequilibrium (LD)-based genome-wide association studies (GWAS).Two genome-wide significant QTL associated with sex were identified and four sex-related markers were developed for red tilapia.Our findings provide a basis for the functional analysis of the sex determination mechanism and selection of all-male lines in red tilapia.
METHODS AND MATERIALS
Ethics statement
This project was conducted in accordance with the regulations and guidelines established by the Animal Care and Use Committee of the School of Life Sciences, Sun Yat-Sen University, Guangzhou, China.All experiments received approval.
Fish sources and management
Four red tilapia families were produced and raised at the hatchery of the Aquatic Science and Technology Development Company of Guangdong Wulonggang (China).A full-sibling family (named FAM1) was produced by crossing a pair of red tilapia parents.A second full-sibling family (FAM2) was generated by crossing a male red tilapia and a female Nile tilapia.A mixed population (FAM3) was generated by crossing multiple pairs of red tilapias (28 females and 10 males).In addition, we selected a male red tilapia from FAM3 and a female red tilapia from another population to produce a fullsibling F2family (FAM4).Information on all populations is shown in Table 1.

Table 1 Summary information on parents and QTL mapping for four families/populations
All fingerlings from each family at 30 days post-hatch were transferred to a pond (~1 000 m2) until sexual maturity (3–4 months).Phenotypic sex for each tilapia was determined by visual inspection.Fins from each fish were collected and stored in absolute ethanol until DNA extraction.
To identify gonadal gene expression, four male and four female red tilapia (~180 days post-hatch) were randomly selected at the fish facility of the School of Life Sciences, Sun Yat-Sen University.Indoor tanks (water depth 70 cm, volume 500 L) with a recirculating freshwater system and a 12 D:12 L photoperiod were used.The fish room was maintained at 25–28 °C and dissolved oxygen (DO) was kept at >6 mg O2/L.The fish were fed with tilapia pellets twice a day.We immediately dissected collected gonads from each individual after the tilapia had been anesthetized by MS-222.The tissue samples were immediately frozen in liquid nitrogen and stored at -80 °C.
DNA extraction
Genomic DNA was extracted from fin tissue using a HiPure Tissue DNA Mini Kit (Magen, China) according to the manufacturer’s protocols.RNA was extracted using RNase A,and genomic DNA quality was then evaluated with 0.8%agarose gel electrophoresis and quantified using a QubitFluorometer (v3.0; Invitrogen, USA).
Genotyping FAM1 using QTL-seq
FAM1 contained 204 individuals.For QTL mapping using QTL-seq, 30 females and 30 males from FAM1 were selected.Genomic DNA was extracted from each sample.We pooled 300 ng of genomic DNA from each sample to form two sexspecial bulk DNA samples.The two DNA samples were then submitted to the Novogene Company (China) for Illumina Hiseq PE150 sequencing.
Clean data were obtained by removing adapters and lowquality reads using FASTQC software (v0.11.2) and then mapped against the Nile tilapia reference genome (oreNil2.fa)downloaded from the Ensembl database (www.ensembl.org)using bowtie2 (Langmead & Salzberg, 2012).Popoolation2(Kofler et al, 2011) was applied to calculate genome-wideFst values using a sliding window approach between female and male samples with parameters set to min-qual 20, -min-count 2, -min-coverage 16, -max-coverage 200, -min-coveredfraction 0.0, -window-size 10 000, and -step-size 5 000.GeneratedFst values with single-nucleotide polymorphisms(SNPs) less than three in a window were then filtered.The empirical threshold a=0.001 was considered as the genomewide significance threshold.Only QTL intervals containing at least two genome-wide significantFst values were considered to be genome-wide significant.The data were deposited in the DDBJ BioProject database under BioProject No.PRJDB7709.
Genotyping FAM2, FAM3, and FAM4 using ddRAD-seq
Three DNA libraries (libraries 1, 2, and 3) were constructed for FAM2, FAM3, and FAM4 using previously described protocols(Nyinondi et al, 2020; Peterson et al, 2012; Zhu et al, 2021).For each sample, 300 ng of genomic DNA was used during library construction.The FAM2, FAM3, and FAM4 libraries were composed of 103, 496, and 287 samples, respectively.The libraries were submitted to Novogene Company (China)for Illumina HiSeq PE150 sequencing.
Clean data for each sample were aligned against the Nile tilapia reference genome (Oreochromis_niloticus.O_niloticus_UMD_NMBU.dna.toplevel.fa) using Bowtie2 (Langmead &Salzberg, 2012) and Stacks (v2.0) (Rochette et al, 2019).SNP calling was carried out using the mpileup pipeline implemented in SAMtools and bcftools (parameter set to Dugf)(Li et al, 2009).To identify SNPs with high confidence, a strict filtering process was established to refine the genotype data.Firstly, the output data were filtered with a total depth >2 000 reads with a Phred-scaled quality score (assertion made in alternate base) <10.For each sample, SNPs with a read depth <4, genotype quality (GQ) <10, and PL (likelihoods of given genotypes) >10 were then removed.The remaining SNPs from the two full-sibling families (FAM2 and FAM4) with missing data rates ≤1% were retained.For the mass crosspopulation FAM3, SNPs with missing data rates ≤5% were retained.All allele frequencies less than 0.1 or larger than 0.9 within each library were filtered in case of genotyping errors.
Linkage-based QTL analysis, GWAS, and population stratification assessment
Phenotypic sex was treated as a binary trait (0 for females and 1 for males).For the two full-sibling families (FAM2 and FAM4), a genetic map was first generated using JoinMap(v4.0) (van Ooijen, 2011), with QTL for sex then mapped using MapQTL (v6.0) (van Ooijen, 2009).Interval mapping (IM) was used to identify potential QTL for the initial time.Cofactor automatic selection analysis was used.Ultimately, multiple QTL mapping (MQM) analysis was performed using the recommended cofactors to identify QTL.In addition, 10 000 permutation tests were conducted, and relative cumulative values in the interval of 0.95 were used to determine the significant logarithm of odds (LOD) thresholds at the genomewide and chromosomal levels.
For GWAS analysis of FAM3 (mass cross population),TASSEL v5.0 (http://www.maizegenetics.net/tassel) was applied.The possible population structure was detected using the allele sharing coefficient matrix (K) and principal component analysis (PCA) (Menozzi et al, 1978).A mixed linear model (MLM) and general linear model (GLM) were executed on the genotypic and sex data.Significance of multiple SNP loci was adjusted using the false discovery rate(FDR) and Bonferroni method.A genome-wide significant SNP was defined by a rawP-value of <0.05/N(number of SNP loci tested in this population) (Zhang et al, 2013).Genomic inflation (λ) was applied to estimate population stratification based onP-value data by R (method=“median”),with that closest to 1.00 considered optimal (Leamy et al,2017).Quantile-quantile (QQ) plots were used to appraise deviation from the expected distribution of SNPs not associated with the trait of interest (Wang et al, 2014).The R function “CMplot” was used to draw the Manhattan plots of theassociation data and QQ plots of theP-values.
LD analysis
LDBlockShow software (Dong et al, 2021) was applied to generate an LD heatmap from VCF files after the genotype data format was converted by TASSEL v5.0 (http://www.maizegenetics.net/tassel).The region for LD analysis and method to detect Block were set using parameters “-Region”and “- BlockType”.P-values for the GWAS and GFF3 files were entered using parameters “-InGWAS” and “-InGFF”.An LD block was recognized when the lower bounds of theR2value exceeded 0.8.A map of candidate genes in the interval was downloaded from the Ensembl website(https://www.ensembl.org/index.html).
Confirmation of QTL by microsatellite genotyping
To verify the identified QTL intervals, we designed four microsatellite markers on chrLG1 and five microsatellite markers on chrLG23 using the online program Primer-BLAST(www.ncbi.nlm.nih.gov/tools/primer-blast/).The markers on chrLG1 were genotyped for 204 individuals in FAM1, and the markers on chrLG23 were used for genotyping 204 fish in FAM4.All primer sequences are listed in Supplementary Table S1.
Polymerase chain reaction (PCR) amplifications were carried out in a total volume of 20 μL containing 2×PCR master mix, 10 ng of genomic DNA, and 0.5 μmol/L forward and reverse primers (Aiji, China) in a Bio-Rad cycler (USA).The following PCR program during was applied (one cycle of 3 min at 95 °C, 35 cycles of 30 s at 95 °C, 30 s at 60 °C, and 30 s at 72 °C, final extension of 10 min at 72 °C).The PCR products were detected by electrophoresis using 8%polyacrylamide gels and silver staining.
RNA extraction and quantitative real-time PCR (qRT-PCR)analysis
Total RNA from samples was isolated using TRIzol reagent(Invitrogen, UK) according to the manufacturer’s protocols.RNA quality and quantity were assessed using a NanoDrop 2000 (Thermo Scientific, USA) and electrophoresis in 1.5%agarose gel.
RNA samples collected from four male and four female red tilapia gonads at 180 dph were used for gene expression analysis.And cDNA was reverse transcribed using 2 μg of total RNA for each sample with an RT-PCR kit (Dongsheng Biotech, China).In brief, a mixture of 2 μg of DNAse I-treated total RNA, 1 μL of oligo dT primer, and RNase-free ddH2O in a volume of 13.4 μL was kept at 70 °C for 5 min, and then placed in an ice bath for 5 min.In total, 6.6 μL of the mixture(including 4 μL of 5×first-strand buffer, 1 μL of dNTPs, 0.6 μL of RNasin, and 1 μL of M-MLV) was added to the tube and maintained at 42 °C for 60 min, then a final step at 70 °C for 5 min to end the reaction.The thermal cycles were conducted in a PCR machine (Bio-Rad, USA).The obtained cDNA was kept at -20 °C until use.
Here, qRT-PCR was conducted in a Roche photoperiod 480 real-time PCR system (Roche, Switzerland).The total volume for each reaction was 10 μL, including 5 μL of 2×SYBR green MasterMix reagents, 1 μL of 1:10 diluted cDNA template, and 0.2 μL of each primer (10 μmol/L) (Supplementary Table S2).The thermal cycling profile was composed of pre-incubation at 95 °C for 3 min, 40 cycles of denaturing at 95 °C for 15 s,annealing at 60 °C for 15 s, and expansion at 72 °C for 20 s.A final cycle including 95 °C for 15s, 65 °C for 15s and increase slowly to 95 °C was used in creating the melting curve.Four replicates were applied to each of the samples.TheEf1αgene was used as an internal reference gene.A two-sidedt-test was used to compare expression levels.
Verifying Y-specific duplicate of amh gene using amh Y chromosome markers
To verify whether there was a Y-specific duplicate of theamhgene in red tilapia, six females and six males from each of the FAM2, FAM3, and FAM4 families were randomly selected.ThreeamhY chromosome markers (amhΔY+5, amhΔY-233,and amhY-5608) were applied to verifyamhyin red tilapia males (Supplementary Figure S1) (Triay et al, 2020).The marker sequences are listed in Supplementary Table S1.The PCR amplification reaction system and program during reactions were similar to those above.The PCR products were detected using 1.5% agarose gel electrophoresis.
RESULTS
QTL analysis of full-sibling family (FAM1)
Two pooled DNA samples (male and female groups) from the full-sibling family FAM1 were submitted for resequencing.In total, 20 Gb of data were obtained for each library.After removing low-quality reads, 70 007 450 and 65 904 289 reads were retained for the male and female libraries, respectively.Overall, 91.71% of reads were successfully mapped to the tilapia genome.Furthermore, 2 975 575 SNPs and 70 946 sliding windows were detected in the two libraries.Total SNP number in each window was more than 20 (average of 41.9).TheFst values in each window ranged from 0.005 to 0.269(average of 0.053).The minimumFst value for the first 1/1 000 window was 0.208 (ranging from 0.208 to 0.269), which was empirically considered as the genome-wide significant threshold (experience threshold of α=0.001).TheFst values of each chromosome in the QTL-seq results are summarized in Supplementary Table S2.
Based on the empirical threshold, we discovered a genomewide significant QTL interval between chrLG1: 22.4 Mb and 25.7 Mb (Figure 1).The averageFst value of the QTL region was 0.230 (0.014SD, standard deviation), which was much higher than the averageFst value of each window between the two sex groups.Within the QTL interval, the peak position was ~24.0 Mb andFst value was 0.269.
QTL analysis of FAM2 data generated from red tilapia and Nile tilapia cross
In total, 103 offspring (46 females and 57 males) and two parents in FAM2 were sampled and genotyped using ddRAD-seq.A total of 120 Gb of high-quality data were obtained and 1 724 high-quality SNP markers were identified after rigorous filtering.The SNP distribution across the tilapia genome is shown in Supplementary Table S3.
A QTL interval associated with sex in tilapia on chrLG1 was identified using MapQTL (v6.0).By MQM mapping, a genome-wide significant QTL located on chrLG1 (19–23.9 Mb) was detected in the hybrid tilapia family (FAM2).According to the permutation test results, the LOD values at 95% and 99%confidence intervals at the genome-wide level were 3.4 and 4.2, respectively.The QTL explained an average of 18.2% of phenotypic variance in the family.The LOD value for the SNP(ChrLG1_21 096 680) under the QTL peak was 5.01, with a phenotypic variance effect of 20.1%.The top 10 genome-wide significant SNP markers on ChrLG1 are listed in Table 2 and Supplementary Table S4.The genome scan for sex in tilapia using MapQTL (v6.0) is presented in Figure 2A.
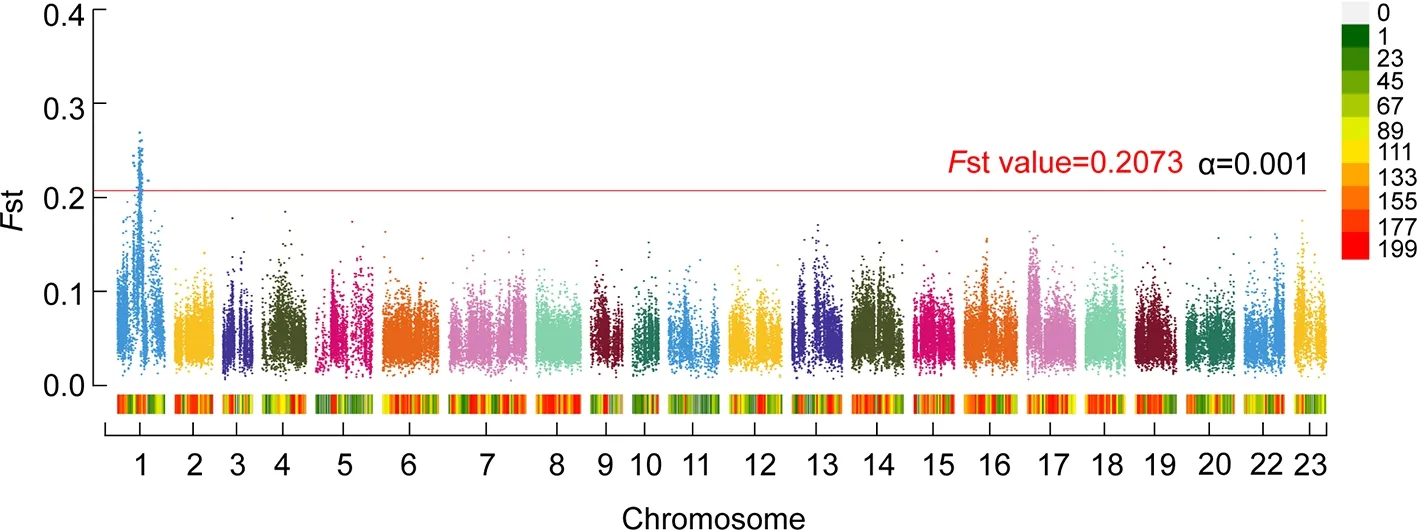
Figure 1 Genome-wide significant QTL intervals for sex identified by QTL-seq in FAM1
QTL analysis of FAM3 data using GWAS
FAM3 (mass cross population) was generated from a mixture of 38 red tilapia.In total, 496 offspring, including 286 females and 210 males, were sampled and genotyped, resulting in 210 Gb of data.After removing low-quality reads and SNPs,we retained 6 607 SNPs for QTL analysis.The SNP distributions across each chromosome were determined by GWAS and are shown in Supplementary Table S5.
The association of genotyping data with sex in red tilapia was analyzed using GWAS.Eleven PCs in the population were detected by PCA, which appropriately explained the population structure shown in the QQ plot (Supplementary Figure S2).According to theP<0.001 threshold, 26 SNPs were associated with sex on ChrLG23, with the remaining two SNPs located on ChrLG1 and ChrLG9, respectively.According to previous studies (Devlin et al, 2003; Yang et al,2005),P-value correction was necessary to effectively reduce the false positive probability of SNPs.There were only 4 genome-wide significant SNPs on ChrLG23 associated with sex when FDR value was used as a threshold (Supplementary Fig.3), and only one SNP was still significant after being corrected by the Bonferroni method (pcorr< 8.12E-6) (Table 3).

Table 2 Phenotypic variance explained by top 10 SNPs with genome-wide significance on ChrLG1 or ChrLG23 in FAM2 and FAM4
Thus, we identified a QTL interval on ChrLG23 that regulates sex in red tilapia, located between 32.4 and 36.0 Mb.The peak of this QTL was located at ChrLG23_35 663 457 bp (F=12.61,P=4.56E-6).TheP-value distribution of all SNPs across the tilapia genome detected by GWAS analysis is shown in Figure 2B.
Within the sex QTL interval on ChrLG23 in FAM3, 12 LD blocks were identified whenR2=1.The coverage distance for the larger six LD blocks was more than 50 kb, however, the distance for each of the remaining six blocks was less than 1 kb.This suggests strong LD at the gene level within the QTLregion.WhenR2=0.8, four larger blocks (LB1:32.14–32.9 Mb,LB2:32.94–33.65 Mb, LB3:33.92–35.03 Mb, and LB4:35.38–35.93 Mb) were observed in the QTL interval (Figure 3A, B).The strong LD among genes within each block suggests possible interactions in the regulation of sex in red tilapia(Figure 3B).

Figure 2 Genome-wide significant QTL intervals identified in FAM2, FAM3, and FAM4
QTL analysis of FAM4
In total, 287 offspring (143 females and 144 males) in FAM4 generated from a pair of red tilapias and their parents were sampled, with 120 Gb of raw data obtained by ddRAD-seq.The overall read alignment rate was 93.12% (0.69SD).We detected 1 422 high-quality SNP markers with missing data rates ≤1%.The SNP distribution across the whole tilapia genome is shown in Supplementary Table S6.
Two genome-wide significant QTL intervals on ChrLG1 and ChrLG23 were located by MQM mapping implemented in MapQTL 6.0.The minimum LOD values with 95% and 99%confidence intervals at the genome-wide level were 4.5 and 5.3, respectively, as estimated by permutation tests.There were 68 SNP markers with LOD values higher than 4.4(Supplementary Table 4).The top 10 SNP markers on ChrLG23 and ChrLG1 are summarized in Table 2 (Figure 2C).The QTL interval (22.5–28.8 Mb) on ChrLG1 explained 12.3%of phenotypic variance in the family, and the QTL interval(32.0–35.9 Mb) on ChrLG23 explained 33.15% of phenotypic variance (pve).The QTL peak for ChrLG1 was located at ChrLG1_25 773 945 bp (LOD value=8.03, pve=12.7%) and the QTL peak for ChrLG23 was located at ChrLG23_32 948 918 bp (LOD value=27.71, pve=37.5%).

Table 3 Summary statistics of GWAS analysis for sex in FAM3
Within the sex QTL interval on ChrLG23 in FAM4, 12 LDblocks were identified whenR2=1.The coverage distance for the larger eight LD blocks was more than 50 kb, however, the distance for one of the remaining blocks was 17.59 kb and all other remaining blocks was less than 1 kb.These results suggest strong LD at the gene level within the QTL region.Interestingly, whenR2=0.8, one large block (LB5:32.01–34.08 Mb) was observed in the QTL interval (Figure 3B, C), which contained many genes.This LD result provides additional evidence on the possible interactions of genes in blocks in the regulation of sex in red tilapia.
Validation of two genome-wide significant QTL using microsatellite markers
Two genome-wide QTL intervals were identified in the four families.In total, 104 individuals (20 females and 84 males)from FAM1 and 180 individuals (94 males and 86 females)from FAM4 were used for genotyping by microsatellite markers.Four microsatellite markers near or within the QTL on ChrLG1 and five microsatellite markers near or within QTL on ChrLG23 were developed.
For the QTL on ChrLG1, two microsatellite markers(SSR141 & SSR147) showed significant association with sex(Fisher’s exact test,P<0.000 01).For the SSR147 marker, the genotype linked to the male was J/K and to the female was J/J, and genotype accuracy was 92% for males among 204 offspring (Figure 4A).
Two of the five markers (SSR3204 & SSR3293) near or within the QTL on ChrLG23 were significantly associated with sex (Chi-square test,P<0.000 01).For the SSR3204 marker on ChrLG23, the main genotypes for males in 180 offspring were “B/C” and “C/C”, but for females were “A/B” and “A/C”.Genotype accuracy of “B/C” was 94.7% for identifying males in the population (Figure 4B).Genotype accuracy of “A/C” was 93.6% for females.Association analysis based on the microsatellite markers suggested that the QTL identified in this study were reliable.
Exploring candidate genes in two QTL intervals associated with sex
Based on the QTL data from the four populations, two QTL intervals on ChrLG1 and ChrLG23 were identified.The QTL on ChrLG1 was the major QTL in FAM1 and FAM2, and the QTL on ChrLG23 was the major QTL in FAM3 and FAM4.Totally, 105 genes were identified in these QTL.Several genes (e.g.,amhandube3a) are reported to be involved in sex regulation (Figure 3A–C).To identify the potential candidate genes in the QTL, specific primers for 12 candidate genes (tp63,ube3a,lpp,gpr17,oca2,cog4,atp10a,sox14,scly,slco2a1,dot1l, andamh) near and on the QTL peak regions were successfully developed and their expression levels were analyzed in gonadal tissue using qRT-PCR(Figure 3B).
Interestingly, three genes (lpp,sox14, andamh) were abundantly expressed in males, while the remaining genes are more highly expressed in females (Figure 5).Seven genes(scly,ube3a,lpp,gpr17,oca2,cog4, andatp10a) were significantly differentially expressed between the male and female groups (Figure 5).Moreover, there was no significant expression difference between the male and female groups for four genes (sox14,dot1l,tp63, andslco2a1).As indicated by the LD plot, strong associations between several candidate genes were identified.Three candidate genes in block LB1(sox14,scly, andslco2a1), five candidate genes in LB2 (lpp,tp63,atp10a,ube3a, andoca2), and two candidate genes in LB3 (dot11andamh) were observed, while no candidate genes were identified in LB4.All 11 candidate genes were observed in LB5 (Figure 3C).The gene expression and LD data suggested that a cluster of genes on ChrLG23 may participate in regulating sex development in red tilapia.
ThreeamhY chromosome markers were used to verify whetheramhyis a sex-determining gene in red tilapia.The genotypic data of threeamhY chromosome markers showed no significant differences between male and female individuals.The absence or presence for the AmhΔY+5(1 500 bp fragment) and amhΔY-233(767 bp fragment) markers was random in FAM2, but the products were present in all samples from FAM4.The absence or presence of the marker AmhY-5608amplifying both 8 022 bp and 2 414 bp fragments was random among males and females in FAM2 and FAM3, but only a 2 414 bp fragment was present in FAM4 males(Supplementary Figure S1).In addition, a 1 000 bp fragment was amplified for the AmhΔY-233marker in all individuals.Our results showed no obvious evidence for the presence of Y-specific replication of theamhgene controlling sex in red tilapia.

Figure 4 Significant differences for sex detected among microsatellite genotypes in mapping families (FAM1 & FAM4)

Figure 5 Expression profiles of QTL candidate genes in gonad samples between males and females revealed by qRT-PCR analysis
DISCUSSION
QTL mapping for sex in red tilapia
QTL mapping in tilapia has been conducted in relation to economic traits, including ammonia-nitrogen tolerance (Zhu et al, 2021), body traits (Yoshida & Yáñez, 2021), salt tolerance(Jiang et al, 2019), body color (Li et al, 2019), and tilapia lake virus resistance (Barría et al, 2021).QTL mapping for sex has also been explored in tilapia previously.A sex-related QTL on LG22 (according to the current version of the tilapia genome,LG22 was integrated into ChrLG23) has been reported for a hybrid Nile and Mozambique tilapia population (Liu et al,2013).Another study detected a sex-associated QTL on ChrLG1 in Nile tilapia with red body color (Palaiokostas et al,2015).However, little information is available for red tilapia.
In this study, a total of 1 090 individuals from four red tilapiaorigin populations were used to identify QTL associated with sex.Compared to previously reported tilapia data (Liu et al,2013; Palaiokostas et al, 2015), the population and genotyping data in this study were much larger, which was helpful for detecting the precise position of sex QTL intervals in red tilapia.Two genome-wide significant QTL on ChrLG1 and ChrLG23 controlling sex in red tilapia were identified in this study.The QTL on ChrLG1 was detected in FAM1, FAM2, and FAM4, and the QTL on ChrLG23 was detected in FAM3 and FAM4.This suggests it may be difficult to develop universal markers for all-male selection in multiple red tilapia populations.These results are in accordance with previous studies showing that red tilapia have a complex genetic background, which may originate from Nile, blue, and Mozambique tilapia (Sandeep et al, 2012; Xia et al, 2015).These findings are an important addition to current knowledge of sex genetic architecture in tilapia and may help in further studies on sex regulation in tilapia species.
Sex-related QTL on ChrLG1 in red tilapia
For the QTL associated with sex on ChrLG1, there are significant differences in the location among species and families.A QTL interval of 10.1–18.9 Mb is recognized in Nile tilapia (Palaiokostas et al, 2015), while a larger QTL interval of 10.1–28.0 Mb is reported forSarotherodon melanotheron(Gammerdinger et al, 2016).However, update of the tilapia reference genome resulted in tremendous changes in the QTL intervals from previous studies (Conte et al, 2019).In our research, slightly differentiated QTL intervals were found among populations.Based on QTL mapping, the interval position in the full-sibling family FAM1 (red tilapia pair) was 22.4–25.7 Mb, the position in the full-sibling family FAM2(cross of red and Nile tilapia) was 19.0–23.9 Mb, and the position for the full-sibling family FAM4 (cross of red tilapia pair) was 22.5–28.8 Mb.Therefore, the overlapping QTL interval among the three populations was 22.4–23.9 Mb.This is the first fine-mapping identification of a sex-associated QTL on ChrLG1 in red tilapia.Thus, this work provides a basis for studying genes regulating sex on ChrLG1 in red tilapia.
Identifying QTL interval across ChrLG23 controlling for sex in red tilapia
Sex-related QTL on ChrLG23 have been reported in tilapia in previous studies.Using the earlier version of the Nile tilapia genome, an interval from 0.99–2.47 Mb on ChrLG23 associated with sex was identified by SSR and SNP markers(Eshel et al, 2012).Another interval from 0.92–11.07 Mb that contained theamhgene (location in latest version: 34 498 945–34 502 800 bp) exerted a significant effect on temperaturedependent sex (Li et al, 2015; Wessels et al, 2017).However,little information on QTL on ChrLG23 is available for red tilapia.
In our study, a QTL interval from 32.4–36.0 Mb on ChrLG23 controlled sex in the mass cross family (FAM3) and an interval from 32.0–35.9 Mb in the full-sibling family crossed by a pair of red tilapias (FAM4) was identified for the first time in red tilapia.The position of QTL on ChrLG23 differs from previously reported data, which is likely due to the application of different versions of the tilapia reference genomes or linkage maps.However, we found that theamhgene was located within the QTL in red tilapia, suggesting that our results are reliable.This study provides the latest referenced QTL interval for sex determination in red tilapia.
Candidate genes controlling sex in red tilapia
Only a few genes have been identified to regulate sex development in fish.For males, Doublesex and mab-3 related transcription factor (dmrt1) is an essential gene that regulates testicular development and differentiation in male zebrafish and Nile tilapia (Li et al, 2013; Lin et al, 2017; Webster et al,2017).Amhyacts in sex determination in tilapia (Li et al,2015).GsdfYis the main SD gene and shows high malespecific expression during sex differentiation inOryzias luzonensis(Myosho et al, 2012).In females, forkhead box l2(foxl2)is a potential SD gene involved in the promotion of ovarian differentiation by up-regulating the expression of cyp19a1a and inhibiting the expression of male regulatory genes (Dai et al, 2021; Zhang et al, 2017).
LD mapping is an approach for identifying candidate genes of natural phenotypic variation (Alqudah et al, 2020; Courtois et al, 2013).Interestingly, four large LD blocks in the sexrelated QTL on ChrLG23 in FAM3 and one large LD block in FAM4 were observed.Several candidate genes showedsignificant LD in both populations.These results suggest that a cluster of genes in this region may co-regulate sex in red tilapia.Further gene expression analysis provided additional evidence in support of this, as shown in Figure 5.Seven of the 12 candidate genes were significantly and highly expressed in female gonads.Theamhgene (ChrLG23:34 498 945-34 502 800 bp) was located near the QTL peak.Our results showed no obvious evidence for the presence of Y-specific replication of theamhgene controlling sex in red tilapia(Supplementary Figure S1A).We detected the expression ofamhin the male gonads of sexually mature red tilapia,suggesting thatamhmay play an important role in the regulation of sex development in red tilapia.In addition, the genelpp(ChrLG23: 32 838 916–33 018 161) was located under the peak of the QTL interval on ChrLG23.Thelppgene may be a novel candidate for polycystic ovary syndrome(PCOS), which is characterized by oligo-ovulation and/or anovulation in humans (Carmina & Azziz, 2006; Zhang et al,2012).The relative expression level oflppwas extremely low in females but was relatively abundant in males in the current study.Our results suggest thatlppmay be a potential SD factor regulating sex development in red tilapia.
Based on our qRT-PCR data, seven genes (scly,ube3a,lpp,gpr17,oca2,cog4, andatp10a) were significantly differentially expressed between the male and female groups.The E6-associated protein (E6-AP), as a co-activator of estrogen receptor alpha (ERα), is encoded by theube3agene, the lack of which results in Angelman syndrome (AS).AS mice contain many differentially regulated estrogendependent genes (Catoe & Nawaz, 2011; Hattori et al, 2013;Koyavski et al, 2019).In the current study,ube3ashowed significantly different expression levels in gonadal tissues,suggesting that theube3agene may be important for sex differentiation in red tilapia.In addition,atp10ais the second maternally expressed imprinted gene on 15q11-q13 in a region of autism, and several studies have reported that females are more likely than males to exhibit monoallelicatp10aexpression (Guffanti et al, 2011; Hogart et al, 2008).Our red tilapia results are consistent with previous findings thatatp10ashows higher relative expression in females, but extremely low expression in males.Several genes are not directly involved in sex determination but have been found to regulate sexually dimorphic traits.For example, males might be with light eye color and females with dark eye color if the rs12913832 inoca2gene is CC homozygous mutation in Spanish.(Martinez-Cadenas et al, 2013).Knockout of selenocysteine lyase (scly) can lead to sexual dimorphism in mice (Ogawa-Wong et al, 2018).Our results suggested that a cluster of genes on ChrLG23 may participate in regulating sex development in tilapia.
For the QTL on ChrLG1, researchers have been unable to identify the sex-determining gene with the male heterogametic system XX/XY.In this study, we selected the genecog4,which contained the most associated SNPs, for expression analysis by qRT-PCR and found that it was highly expressed in the gonads of female red tilapia.Further research using gene knockout may provide hints on its function in sex determination.
CONCLUSIONS
In this research, two sex-related QTL intervals on ChrLG1(22.5–28.8 Mb) and ChrLG23 (32.0–35.9 Mb) were first identified from four populations of red tilapia.Four microsatellite markers located within the QTLs were successfully developed.Seven candidate genes (scly,ube3a,lpp,gpr17,oca2,cog4, andatp10a) within the two QTL intervals were significantly differentially expressed between the male and female groups.This research lays a foundation for the mining of regulatory genes in controlling sex in red tilapia.
DATA AVAILABILITY
The raw read data for FAM2 are available at the Science Data Bank database (Data doi: 10.119 22/sciencedb.01457).All raw read data are available at the DDBJ database (BioProject accession: PRJDB12542) and GSA database (BioProject accession: PRJCA007977).
SUPPLEMENTARY DATA
Supplementary data to this article can be found online.
COMPETING INTERESTS
The authors declare that they have no competing interests.
AUTHORS’ CONTRIBUTIONS
J.H.X.and H.R.L.contributed to project conception.Z.X.Z.and C.H.C.collected the materials.Z.X.Z., Y.L.L., C.H.A.,Y.Y.X., D.D.H., and Y.Y.Y.conducted the experiments.Z.X.Z,Y.L.L., and J.H.X.conducted data analysis.Z.X.Z, T.D.L., and J.H.X.prepared the manuscript.H.R.L.critically reviewed the manuscript.All authors read and approved the final version of the manuscript.
ACKNOWLEDGEMENTS
We thank all anonymous reviewers for their comments on the manuscript.

- Zoological Research的其它文章
- Engineered T cells and their therapeutic applications in autoimmune diseases
- Lateral habenula neurocircuits mediate the maternal disruptive effect of maternal stress: A hypothesis
- Characterization of gut microbial alterations in cynomolgus macaques during growth and maturation
- Population recovery of the critically endangered western black crested gibbon (Nomascus concolor)in Mt.Wuliang, Yunnan, China
- Conservation genomics of sibling grouse in boreal forests reveals introgression and adaptive population differentiation in genes controlling epigenetic variation
- Gene expression responses in zebrafish to short-term high-hydrostatic pressure