
Quantitative analysis and time-resolved characterization of simulated tokamak exhaust gas by laser-induced breakdown spectroscopy
2022-05-05 01:49YaxiongHE何亚雄TaoXU许涛YongZHANG张勇ChuanKE柯川YongZHAO赵勇andShuLIU刘曙
Plasma Science and Technology 2022年4期
Yaxiong HE (何亚雄), Tao XU (许涛), Yong ZHANG (张勇),Chuan KE (柯川), Yong ZHAO (赵勇),∗and Shu LIU (刘曙)
1 School of Physics and Energy, Fujian Normal University, Fuzhou 350117, People’s Republic of China
2 Center for Superconducting and New Energy Research and Development,Southwest Jiaotong University,Chengdu 610031, People’s Republic of China
3Fujian Provincial Collaborative Innovation Center for Advanced High-Field Superconducting Materials and Engineering, Fuzhou 350117, People’s Republic of China
4 Shandong Dong Yi Optoelectronic Instrument Co., Ltd, Yantai 264670, People’s Republic of China
5 Technical Center for Industrial Product and Raw Material Inspection and Testing, Shanghai Customs,Shanghai 200135, People’s Republic of China
Abstract Tokamak exhaust is an important part of the deuterium-tritium fuel cycle system in fusion reactions.In this work, we present a laser-induced breakdown spectroscopy (LIBS)-based method to monitor the gas compositions from the exhaust system in the tokamak device.Helium(He), a main impurity in the exhaust gas, was mixed with hydrogen (H2)in different ratios through a self-designed gas distribution system, and sealed into a measurement chamber as a standard specimen.A 532 nm wavelength laser pulse with an output power of 100 mJ was used for plasma excitation.The time-resolved LIBS is used to study the time evolution characteristics of the signal strength,signal-to-background ratio(SBR),signal-to-noise ratio(SNR)and relative standard deviation (RSD)of the helium and hydrogen characteristic lines.The Boltzmann twoline method was employed to estimate the plasma temperature of laser-induced plasma (LIP).The Stark-broadened profile of He I 587.56 nm was exploited to measure the electron density.From these studies,an appropriate time was determined in which the low RSD%was consistent with the high signal-to-noise ratio.The He I 587.56 nm and Hα emission lines with good signalto-noise ratio were extracted from the spectrum and used in the external standard method and internal standard method for quantitative analysis.The test results for mixed gas showed that the average relative error of prediction was less than 11.15%, demonstrating the great potential of LIBS in detecting impurities in plasma exhaust gas.
Keywords: exhaust gas, plasma diagnostics, LIBS, quantitative analysis
1.Introduction
Fusion energy has attracted widespread attention from scholars around the world due to its significant advantages such as there being sufficient raw materials and it generating nonradioactive waste [1-4].Among a variety of magnetic confinement fusion reactors, the tokamak is one of the types with the most potential for commercial applications.During the fusion reaction, helium and other impurity gases would gradually be generated and accumulated in the toroidal chamber of the tokamak,causing the plasma to cool down.In order for the fusion reaction to continue, the burned gas (socalled ‘exhaust gas’)must be continuously pumped out for purification treatment [5], which greatly relies on the composition analysis of the exhaust gas.Figure 1 is a diagram of the exhaust system in the China Fusion Engineering Test Reactor (CFETR)[6].
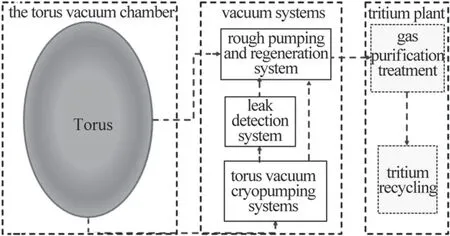
Figure 1.Pumping system of CFETR.
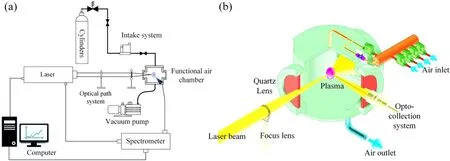
Figure 2.Experimental device for simulation of exhaust gas LIBS measurement.(a)Schematic diagram of the LIBS measurement system,(b)functional air chamber.

Figure 3.(a),(b)Temporal evolution of the LIP emission of helium and hydrogen.(c),(d)Sample spectra showing the He I line at 587.56 nm and the H I line at 656.29 nm at various delay times.
Real-time quantitative monitoring of gas composition is a technical challenge.The main compositions of exhaust gas contain H2(hydrogen isotope is also included), He, hydrocarbon, carbohydrate, and H2O.There are already several measurement techniques implemented to monitor exhaust gas concentration, such as Raman spectroscopy, microchromatography, calorimetry and ionization chamber technology etc [7-11].The advantage of Raman technology is that no sample pretreatment is required.However,the weaker detection sensitivity for inert gases(He and Ar)is an inherent limitation of the Raman scattering cross section [12].Although gas chromatography has high detection sensitivity,it requires carrier gas and is complicated to operate.In addition, these techniques mentioned above may require a laboratory environment and cannot be used for in situ applications [13].
Laser-induced breakdown spectroscopy (LIBS)is an emerging atomic emission spectrometry technology, which has received extensive attention and research in the field of spectroscopic analysis in recent years [14-17], leading to the emergence of rapid analysis, on-site analysis, remote measurement and without sample preparation [18].It has relatively high sensitivity and in theory it can be used to characterize all the elements in the periodic table, especially on light elements, such as H, He, Li etc.As a diagnosis system,LIBS has a flexible design and can be integrated into all kinds of devices or production lines.According to the literature [19-21], LIBS has been used in the tokamak device’s first wall composition monitoring applications where the test environment is relatively severe, so there is reason to expect the application of LIBS in exhaust gas monitoring.
In this work, LIBS technology was introduced into the quantitative measurement of gas mixtures, which simulated the monitoring of the exhaust gas, and evaluated its application potential in tokamak devices.The mixed gas preparation adopts a self-designed gas distribution system, which can fully mix a variety of different gases in its sealed chamber.The main components of the mixed gas are helium (trace)and hydrogen,and the corresponding LIBS test conditions are optimized around the signal enhancement of their spectra.The time resolution of LIBS was improved to enhance the relative intensities and signal-noise ratios(SNR)of the elemental emission lines of gas mixture, and consequently obtain an appropriate range of delay time and laser energy for signal collection.By studying the excitation temperature and electron density during the plasma evolution, the local thermodynamic equilibrium conditions of the laser-induced plasma during the testing were estimated,and on this basis, the quantitative analysis of the gas mixture was carried out through external standard and internal standard methods.In addition, the analytical performances were compared between different calibration models.
2.Experiment
2.1.Preparation of gas mixture
In the experiment, the mixed gas was tested in a sealed aluminum alloy chamber, as shown in figure 2(b).The gas cell was equipped with four round glass windows of 3.5 cm diameter,one on each side,for the laser beam,imaging and light collection of the laser-induced breakdown(LIB).The top was the air inlet, and the bottom was the air outlet.The window was coated with different films for different wavelengths of laser,to increase the transmittance and reduce the laser energy loss.The gas distribution system consisted of four groups of inlet channels.The gas flow was controlled by a mass flow controller with a flow display to monitor and display the flow in real time.The vacuum pump was used to control the pressure in the chamber, and the pressure was monitored and displayed in real time through the vacuum gauge.
The purity of the helium and hydrogen used in the experiment were both greater than 99.999%,and mixed gases of different concentrations were prepared by controlling the volume ratio of the He/H2mixed gas.The preparation process was as follows: (1)purge the pipelines and chambers with high-purity helium or hydrogen gas, and use an oil-free diaphragm pump to vacuum the pipelines and chambers of the entire system (about 10 Pa).This process was cycled three to five times.(2)Control the gas flow rate to 10 ml min-1, pass in high-purity helium and hydrogen respectively, and record the functional relationship between the passage time of each gas and the chamber pressure until the chamber pressure is one atmosphere.This process was cycled 10 times and the average value was taken.(3)Take the 5%He/95%H2mixed gas as an example; according to process (1), the background gas hydrogen was first introduced to purge the pipelines, and then, according to process (2), 5% and 95% helium and hydrogen are respectively introduced at the input time.The ventilation sequence was 50%H2-100%He-50%H2in order to fully diffuse the helium in the chamber.Using the above method,a mixed gas of hydrogen and helium containing 1%-5% helium was prepared.The pressure in the chamber is 1 atmosphere.
2.2.LIBS testing
The pulsed laser used in the experiment was a nanosecond Nd:YAG Q-switched pulse laser(LS-2134D-C4-MH,LOTIS,with 10 Hz repetition rate, 6 mm beam diameter, 16 ns pulse duration,and pulse energies up to 100 mJ)with a wavelength of 532 nm.The energy of interest in this study was 60-100 mJ per pulse, and the effect of pulse energy on LIB was studied with this.The laser energy was measured by an energy meter (Ophir, PE50BF-DIF-C)at the laser outlet.The laser beam was magnified twice using an expanding beam mirror (BE02-1064/532-2X, Thorlabs), and the beam direction was adjusted using a reflector (reflectivity >98%).Finally, the laser beam was focused onto the gas in the gas cell for LIB using a focusing lens (f = 75 mm), as shown in figure 2(a).Plasma signals were coupled to an echelle grating spectrometer(ARYELLE 200,LTB,the wavelength range of 210-850 nm, λ/Δλ = 8000, with 45 μm slit width and 200 mm focal length)via a fiber (LTB, multimode quarz fibers for laser and spectrometer coupling)of a core diameter of 400 μm.The echelle grating was used to disperse different spectral bands to different diffraction series.At the same time,the prism was used after the echelle grating to achieve different orders of separation on the second spatial dimension,and finally the spectra of different orders were arranged on the 2D array detector (Andor ICCD DH334T-18F-03-27A).The ICCD camera has a resolution of 1024 × 1024,a pixel size of 13 × 13 μm2, a gating time of 5 ns, and a maximum relative gain of 1000.The ICCD visualized the LIB from 0 to 2000 ns after the breakdown.The synchronization between the laser and the ICCD was realized by using the feedback signal of the laser Q switch.All experiments were performed under atmospheric pressure at a room temperature of 25 degrees Celsius and a humidity of 45%.Before performing spectral acquisition,the wavelength of the spectrometer was calibrated using a low-voltage mercury spectral lamp (Spectrometer Interface II, LTB), and the signal intensity of the ICCD was calibrated using a deuterium halogen source (DH-3plus-CAL Calibration, Ocean Insight).
During the measurement, the energy range of the laser was set between 60 mJ and 100 mJ, and the pulse frequency was set to 10 Hz.The spectrum of each gas was measured four times,and each spectrum represents the average value of a total of 60 laser pulses accumulated in the four measurements.To improve the intensity, and the SBR and SNR of emission lines, LIBS testing conditions (especially for delay time)were optimized by researching the temporal evolution of laser-induced plasma spectra.The pure He and H2were used as the standard samples for LIBS testing of temporal evolution, and the elemental characterization lines were selected by the NIST database and the Kurucz database[22, 23].To decrease the background noise, the integration time(gate width)of the signal collection was shortened,and it was fixed at 0.2 μs.The delay times were set at 0-2.0 μs.The spectral signals of time resolution testing were recorded and analyzed.
3.Results and discussion
3.1.Temporal evolution optical spectroscopy
In LIBS,the focused laser pulse is dedicated to the mixed gas.The gas in the focused region generates the initial electrons due to multi-photon ionization.The electrons absorb energy through the reverse bremsstrahlung and collide with gas particles to ionize the particles, generating more electrons,realizing the avalanche growth of electrons and forming the plasma.However, the transition of atoms or ions in the plasma is accompanied by the transition of other particles,which affects the analysis results.In addition, the results of the spectrum analysis are also affected by the fluctuation of the plasma state and the spectrum measuring instrument.Therefore, investigating the physical mechanism and radiation process in the plasma formation and decay process, the interaction of particles, and the time evolution of the plasma state has important guiding significance for the accuracy of the analysis results.
Figures 3(a)and (b)show the temporal evolution of the LIP emission of helium and hydrogen.For short delays immediately after the impact of the laser pulse on the sample,the spectra are mainly continuous radiation spectra.With the increase in the delay time,due to the bremsstrahlung radiation and the radiation recombination between electrons and ions,the intensity of the spectral radiation decreases rapidly with the attenuation of the plasma evolution.Compared with helium, the evolution process of hydrogen is shorter, and there is almost no obvious characteristic peak after 1.2 μs.
Figures 3(c)and (d)show the He I 587.56 nm and H I 656.29 nm at various delay times to clearly demonstrate the continuum spectral emission of the helium line after 0.2 μs.The measurements show that helium provides a continuum emission of nearly equal intensity in the experimentally detected wavelength range.This is consistent with the research results of Hanafi et al[24]and McNaghten et al[25].The continuum part is considered to be a combination of bremsstrahlung radiation and recombination radiation.The short wavelength continuous spectra in the UV region are caused by the bremsstrahlung radiation of electrons,while the long wavelength continuous spectrum can be caused by the recombination radiation of electrons and ions [26].With the increase of the delay time, the continuum emission decreases obviously due to plasma attenuation.The spectrum begins to be predominantly contributed by the emission lines of the optical transition from the discrete states of various atoms and ion species after 600 ns.
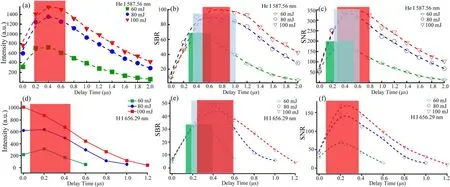
Figure 4.The temporal evolution of the intensity, SBR and SNR of He I 587.56 nm and H I 656.29 nm at different energies.
Moreover, the SBR and SNR are also evaluated.SBR and SNR can be used to evaluate the sensitivity of LIBS signals under different parameters.For a particular curve, the SBR and SNR can be obtained from the following equation,where Isignalis the signal of interested element, Ibackgroundis the value of the background radiation, and σbackgroundis the standard deviation of the background near the spectral line.
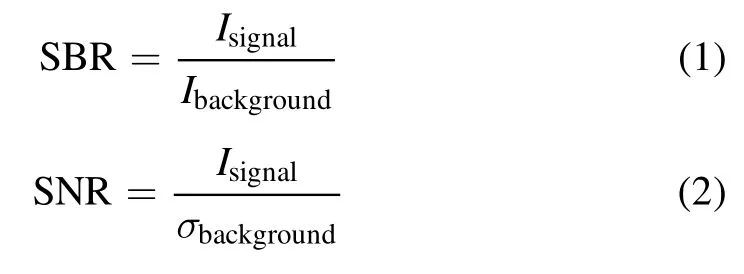
Figure 4 shows the intensity, SBR and SNR time evolution of He I 587.56 nm and Hα656.29 nm at different laser energies.Figure 4(a)shows that the He I 587.56 nm line intensity starts to increase from the initial stage of laserinduced He plasma generation, reaches the highest value at 0.4 μs, and then begins to decrease.Although the highest signal intensity of the He I 587.56 nm line was observed at~0.4 μs, it seems that the optimal delay time for SBR and SNR is in the range of 0.4-0.6 μs, as shown in figures 4(b)and (c).At the same time, in this time window, hydrogen as the background gas also has a higher SBR and SNR.The optimal SBR and SNR time intervals corresponding to different laser pulse energies are different.It should be noted that the noise calculation also includes the noise introduced by the instrument itself.For different instruments, the instrument noise levels are different.Many other factors also influence the signal optimization, such as laser pulse energy, plasma size,etc.Therefore,the evolutionary trends of SBR and SNR are not consistent.When the delay time is long, the average intensity of the continuous spectrum background can be reduced to a very small value, which leads to the obvious contribution of instrument noise [27].
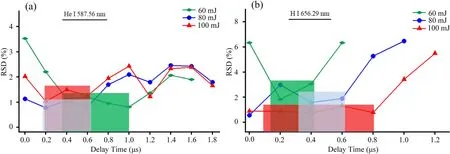
Figure 5.The temporal evolution of the RSD of He I 587.56 nm and H I 656.29 nm at different energies.
The relative standard deviation (RSD in %)is a very common figure of merit in the framework of LIBS analysis[28].As shown in figure 5,the RSD of He I 587.56 nm and H I 656.29 nm lines first decreases within 0.2 μs,then increases as the plasma continues to evolve.The temporal evolution of RSD is generally an inverse of the temporal evolution of net intensity [29].From the experimental point of view, there exists an optimal temporal window for signal detection,under which the SBR, SNR and net intensity are relatively high,while the RSD remains low.
According to the results shown in figures 4 and 5, the laser energy of 100 mJ and the delay time of 0.4-0.6 μs are considered to be the best conditions for this experiment.
3.2.Plasma parameter diagnosis
The optical emission is recorded as a function of delay gate width, allowing us to investigate the temporal evolution of the electron density of the laser-excited plasma during transient expansion and attenuation.The collision process is dominant in the evolution of the laser plasma.The energy conversion process in plasma mainly depends on the collision of electrons with the atoms or ions.The dynamic behavior in the plasma depends to a great extent on the number of electrons and their evolutionary laws.Therefore,from the study of the time behavior of electron density, information about the formation and evolution of plasma and the energy transmission in the plasma can be obtained.This is of great significance for improving the accuracy of the quantitative analysis results of LIBS.
According to the theory of plasma spectroscopy, the measured line shape is the result of various broadening mechanisms.Under our current experimental conditions, the mechanism of line broadening in laser-induced plasma is mainly the contribution of Stark broadening, while the contributions of natural broadening, Van der Waals broadening and resonance broadening are in the order of 10-5-10-4nm,which are negligible under the relevant electron density[30,31].The relationship between the Stark broadening of the spectral line and the electron density can be expressed as an equation (3):
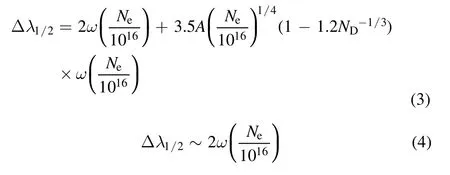
where ω is the electron impact width parameter.The ω value of He I 587.56 nm (0.17 Å)refers to appendix IV of Griem’s work[32].Neis the electron density, A is the ion broadening parameter, and NDis the number of particles in the Debye sphere, the term on the left of the plus sign represents the contribution of electron broadening, and the right is the contribution of ion broadening.The ion broadening can be ignored because the ion’s contribution to the line width is much smaller than the atomic broadening’s contribution.Therefore, equation (3)can be simplified to equation (4).
According to the Hα 656.29 nm spectral line width, the plasma electron density is calculated according to the following formula:
whereΔλ1/2is the measured FWHM of the hydrogen line,α1/2is reduced wavelength, which can be obtained from appendix III of[32].The electron density calculated based on Hα 656.29 nm is shown in figure 6(c).
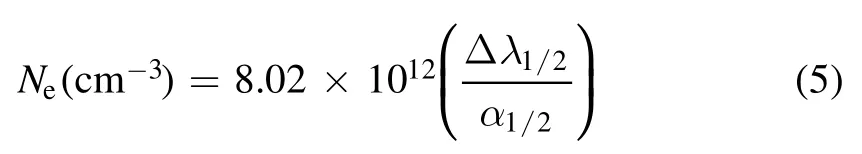
The helium electron density is calculated by selecting the emission line of He atom at 587.56 nm.The line is well isolated and has no self-absorption.It has been used by many researchers for laser-induced plasma diagnosis [24, 33, 34].The broadening of the instrument is obtained by fitting the mercury line emitted by the low-pressure mercury light source.The line broadening at Hg I 576.96 nm is 58.3 pm.The Voigt profile is used to fit the observed line shape, and the calculation of the Stark broadening is corrected by subtracting the instrument broadening.
In the early stage of plasma evolution (delay time<0.6 μs),the broadening of the He I 587.56 nm spectral line is wide.The Voigt profile is used to fit the FWHM of the helium atom at 587.56 nm, as shown in figure 6(a).It can be seen from figure 6(b)that the line broadening gradually becomes smaller as the delay time increases.Theoretically, the broadening of the spectral line is mainly due to the collision between electrons and emitted particles in the plasma.As the delay time increases, the intensity of collision between the electrons and the emitted particles decreases,so the spectral line broadening gradually becomes smaller.
Figure 6(c)shows the temporal evolution of the electron density obtained at different laser energies.With the increase of laser energy, it is observed that the electron density gradually increases, which well illustrates the different interaction effects between laser pulses and helium gas.The decrease in electron density under the three laser energies is basically the same, especially the curve with a delay of 0.2-0.4 μs has similar slope.The electron density drops rapidly from the initial value of (1.5-2.2) × 1017cm-3(at 0.2 μs)to(0.6-1.2) × 1017cm-3(at 0.4 μs),and then decay to an order of magnitude in the longer delay time, about 3 × 1016cm-3(at 2 μs).At the same time, it can be seen that the electron density decay time increases with the increase of energy.The time of electron density decay with 60 mJ laser energy excitation is 1.6 μs.After that,the intensity of the spectral line has decayed to a level not available for electron density calculation.When the laser energy is increased to 100 mJ, it can be observed that the electron density decay time duration exceeds 2 μs.
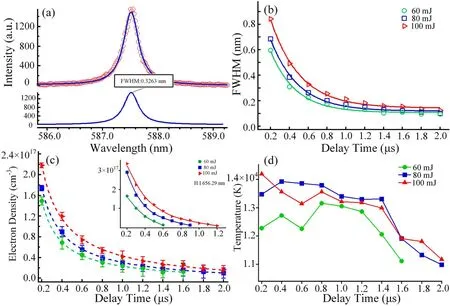
Figure 6.(a)Stark-broadened line of He I at 587.56 nm fitted using the Voigt profile at a delay time of 0.4 μs for the laser energy of 100 mJ.The temporal variation of (b)FWHM, (c)electron density and (d)plasma temperature at various laser energies.
The Boltzmann plot method is often used to calculate plasma temperature.In this experiment, because the upper energy level of the excited He atomic line is too close,the R2of the Boltzmann plot is only about 0.1.Therefore, He I 388.86 nm and He I 587.56 nm with high strength were selected to calculate the plasma temperature line by Boltzmann two-line method.The Boltzmann two-line method is a convenient means of determining the excitation temperatures in laser-induced plasma when LTE is established.Using the transition from the two characteristic lines and applying the appropriate degeneracies and the Einstein coefficients for the probability of spontaneous emission, the plasma excitation temperature can be calculated [35, 36].From the transition Ento Em, the intensity of the transition can be expressed by equation (6):
where h is Planck’s constant, c is the velocity of light, N0is the number of tree atoms, gnis the statistical weight of the level En, Q is the partition function of the atom, Anmis the Einstein transition probability for spontaneous emission, λnmis the wavelength of the spectral line, k is the Boltzmann constant, T is the absolute temperature.
For the transitions of two lines, the absolute excitation temperature can be readily computed [37].

Figure 6(d)shows the time evolution of the plasma temperature under three laser energies calculated using the two lines He I 587.56 nm and He I 388.86 nm.The plasma temperature under three laser energies has a similar attenuation trend.In the early evolution of plasma,the rapid decrease of plasma temperature is caused by the expansion of plasma.During the initial expansion,thermal energy is converted into kinetic energy, and the plasma cools rapidly [38].
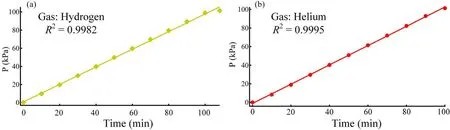
Figure 7.The flow statistics of different gases.
3.3.Local thermodynamic equilibrium evaluation
The necessary McWhirter condition is used to prove that the plasma is in LTE state by calculating the electron density of the plasma,which refers to the minimum value of the electron density [39, 40]:

where T and ΔEnmare expressed in K and eV, ΔEnmis usually the energy level corresponding to the first resonance transition and the first excitation energy level.In the case of He,the first resonance transition is 1S2→ 1S2S whose ΔEnmis about 19.8 eV.According to the T calculated in the previous section,the critical Nevalue that satisfies the McWhirter criterion is obtained by formula (8), which is about 1.416 × 1018cm-3.This is an order of magnitude higher than the value calculated in the experiment.This is because in the case of a low metastable state, the first resonance transition will result in a higher ΔEnmvalue.In fact,helium has a metastable state,and when atoms are in a special excited state of metastable state, it is not easy to spontaneously transition to the ground state.As reported by Omenetto et al[39],in the presence of low-lying metastable states,formula(8)should be used with caution.In many cases(e.g.Fe I-II,Cu I-II,O I-II,N I-II, Ni I-II, etc), metastable states, i.e., states that weakly decay radiatively to the ground state through forbidden(magnetic dipole or electric quadrupole coupling)or through intercombination transitions (spin-orbit coupling), exist between the ground level and the first optically allowed level.

Table 1.Gas flow data and parameter statistics.
3.4.Quantitative LIBS measurement of plasma exhaust gas
Here, we used the gas distribution system and method described in section 2 to prepare five groups of hydrogen and helium mixtures with different concentrations to simulate the exhaust gas mixture components.The research mainly concentrates on the impurity helium of exhaust gas.The helium concentration is between 1%and 5%.Figure 7 shows the flow statistics of different high purity gases.Each gas group is tested about 10 times and averaged.
As shown in figure 7, the gas distribution system has a good linear trend for the preparation process of different gases, and the linear fitting degree R2of flow statistics of different gases reaches more than 0.99.Detailed flow statistics and functional relationship parameters of the two gases are shown in table 1.
We used the experimental device described in section 2 to carry out quantitative analysis experiments (0.4 μs delay time, 100 mJ laser energy).The spectral acquisition of five hydrogen and helium gas mixtures with different concentrations was carried out using a 532 nm wavelength laser.Four spectra were collected for each concentration, and a total of 20 sets of spectrum data were collected.Each spectrum represents the average of four measurements accumulated by 60 laser pulses.Figure 8 shows the measured spectra of laserinduced He/H2plasma.
Figure 9 shows the calibration curve of He in the mixed gas,which is established using 10 spectral data as the test set.Figure 9(a)is the calibration curve of trace helium in hydrogen established by the traditional single-line calibration method, and figure 9(b)is the calibration curve with the H I 656.28 nm line as the internal standard.The calibration curve using the internal calibration method is almost the same as the single line calibration curve of He I 587.56 nm, and its goodness of fit R2is even reduced.This may be because the H I 656.28 nm as the internal standard is far from the He I 587.56 nm line, and the He I 587.56 line is an independent characteristic line.With the addition of the H I 656.28 nm line as the internal standard, the peak intensity fitting error and signal interference are increased.
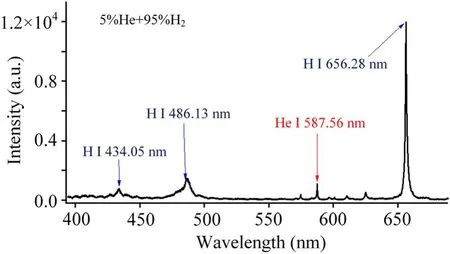
Figure 8.Laser-induced He/H2 breakdown spectra.
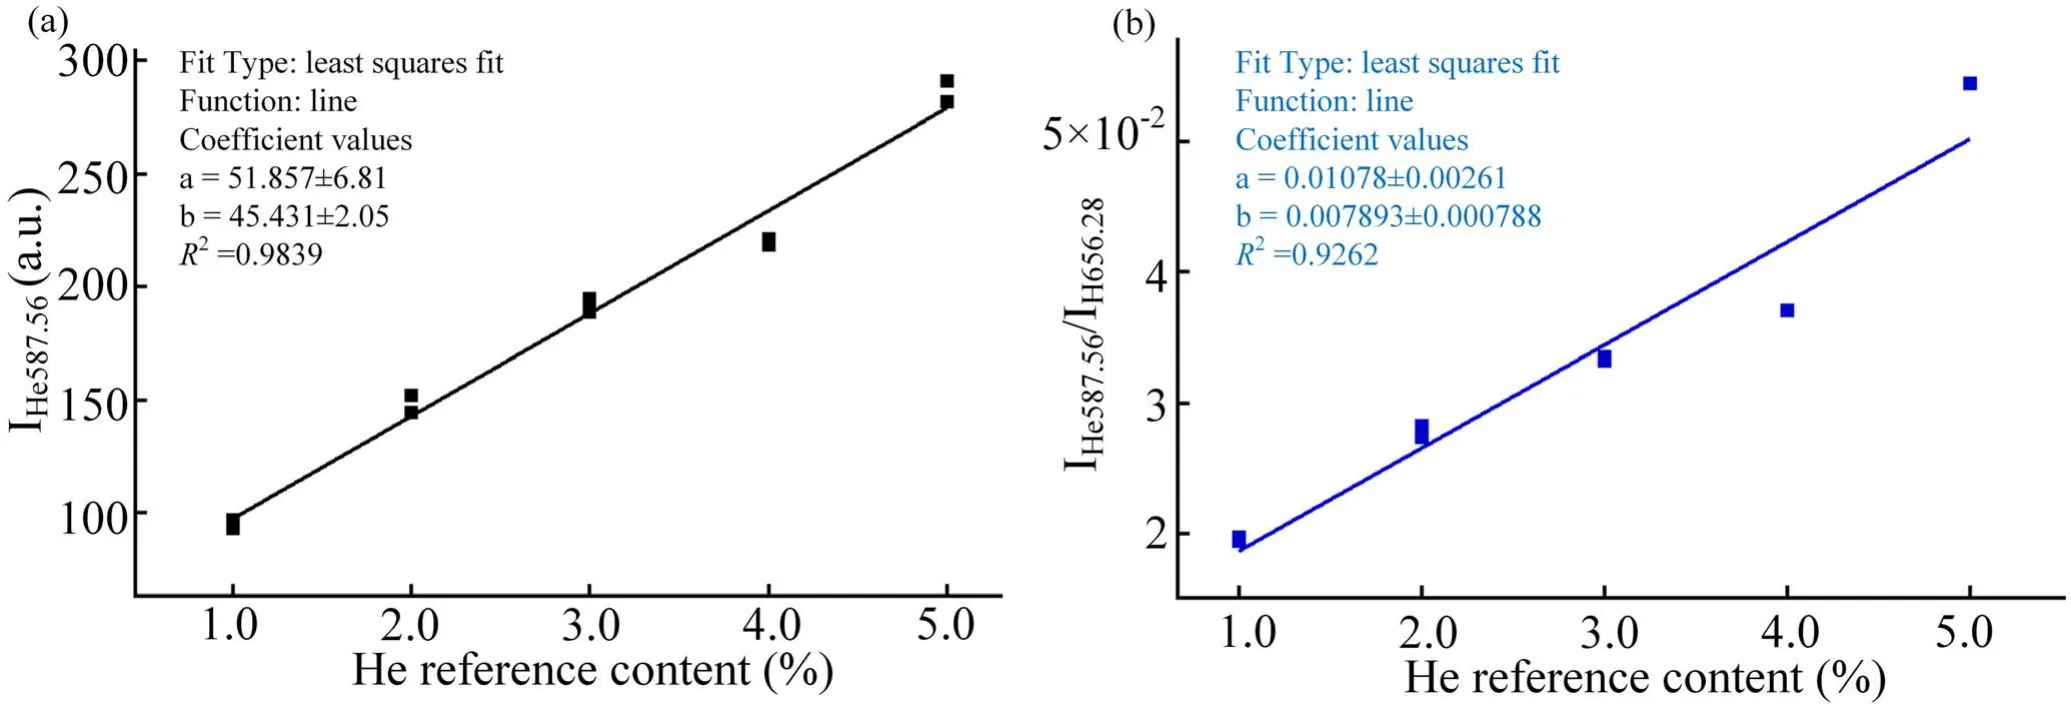
Figure 9.The calibration curve of He.(a)Univariate calibration, (b)internal standard method.
The detection limits of the selected lines were evaluated as 3σb/S,where σbis the noise of the background,defined as being the standard deviation of the experimental data over a surrounding spectral range (n = 50)free of emission lines,and S is the slope of the calibration curve for the peak intensity versus referenced element concentration.The detection limit,slope,RMSE,as well as the linear correlation coefficient of the calibration for He in mixed gas are presented in table 2.A calibration model is used to predict the remaining 10 groups of data, and the prediction results are shown in table 3.

Table 2.The analyzed parameters of LIBS for He element in mixed gas (H2 and He).
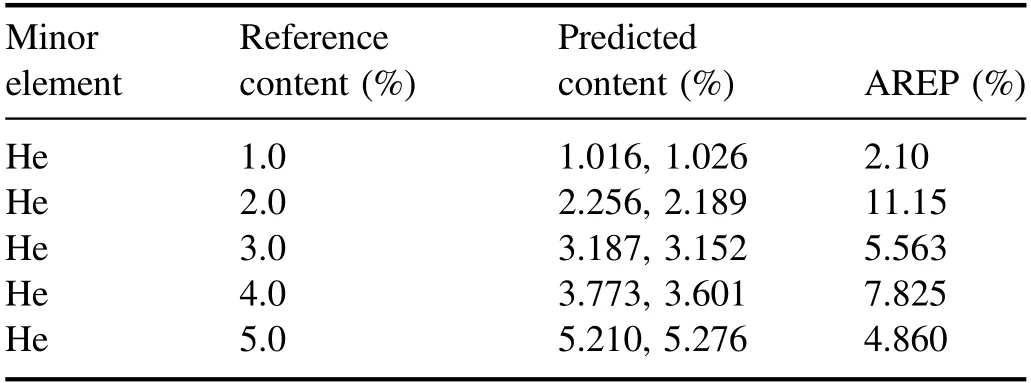
Table 3.Prediction results and the average relative error of prediction (AREP).
4.Conclusions
In summary,we have systematically studied the laser-induced He plasma time evolution for the application of LIBS in tokamak exhaust gas.A spectroscopic study of laser sparks produced by a 532 nm Nd:YAG laser in helium is conducted,and the laser energy range is 60-100 mJ.The He I 587.56 nm line intensity,SBR and SNR show a trend of first rising to the maximum value and then falling with the delay time.Plasma temperature and electron density show similar temporal behavior,i.e.,decreasing as the delay time increases.The time evolution of these parameters shows that recording helium spectra in a delay time window of 0.4-0.6 μs and a pulsed laser range of about 100 mJ can maintain high emission line intensity, high SBR and high SNR.Finally, we have quantitatively analyzed the hydrogen-helium mixed gas under the experimental conditions of 0.4 μs and 100 mJ.The traditional univariate calibration method and the internal standard method were used to establish the He calibration curve.The traditional univariate calibration method is better than the internal standard method with H I 656.28 nm as the internal standard.The linear fit R2of the calibration curve is 0.9839,the detection limit is 0.3489%,and the RMSE is 0.2333,and the prediction tests have obtained the AREP in the range of 2.10%-11.15%.The results show that LIBS technology has great potential for the detection of mixed components of tokamak exhaust gas.
All the results presented in this paper are obtained with space-integrated detection.Nevertheless, laser induced plasmas are indeed by nature transient and inhomogeneous.The difference in the initial position generated by the gas plasma,the change in the shape and size of the plasma, and the difference in the proportion of the laser energy absorbed by the plasma make the signal fluctuate when the LIBS technology is applied to exhaust gas analysis.From a practical point of view, the combination of LIBS technology and advanced chemometrics methods may be a better choice for exhaust gas analysis.Therefore, the implementation and technical advantages of the LIBS measurement method will provide important applications in the evaluation of gas components that are considered to play a decisive role in tokamak exhaust gas.
Acknowledgments
This work is supported by the National Key R&D Program of China (Nos.2017YFE0301506 and 2017YFE0301306).
猜你喜欢
做人与处世(2022年6期)2022-05-26
做人与处世(2022年4期)2022-05-26
青年文学家(2022年4期)2022-03-17
书香两岸(2020年3期)2020-06-29
小猕猴学习画刊·下半月(2019年8期)2019-09-16
故事会(2019年9期)2019-05-08
理科考试研究·初中(2017年4期)2017-11-04
检察风云(2016年7期)2016-05-14
新高考·高二数学(2014年12期)2015-10-16
中外文摘(2009年11期)2009-06-19
 Plasma Science and Technology2022年4期
- Plasma Science and Technology的其它文章
- Numerical analysis on the effect of process parameters on deposition geometry in wire arc additive manufacturing
- Investigation of the gas bubble dynamics induced by an electric arc in insulation oil
- The influence of charge characteristics of suspension droplets on the ion flow field in different temperatures and humidity
- Characteristic studies on positive and negative streamers of double-sided pulsed surface dielectric barrier discharge
- Hydrophobicity changes of polluted silicone rubber introduced by spatial and dose distribution of plasma jet
- Characteristics of water volatilization and oxides generation by using positive and negative corona