
Demand side management for solving environment constrained economic dispatch of a microgrid system using hybrid MGWOSCACSA algorithm
2022-05-28 15:17SouravBasakBishwajitDeyBiplabBhattacharyya
Sourav Basak|Bishwajit Dey,2|Biplab Bhattacharyya
1Department of Electrical Engineering,Indian Institute of Technology(Indian School of Mines),Dhanbad,India
2Department of Electrical and Electronics Engineering,Gandhi Institute of Engineering and Technology,Gunupur,Odisha,India
Abstract Microgrids are a type of restricted power distribution systems in which electricity is generated,transmitted,and distributed within a small geographic region.They are used to ensure that renewable energy sources are used to their full potential.Microgrids provide further benefits,such as lowering transmission losses and the expenses associated with them.This research compares and contrasts the aims of economic dispatch,emission dispatch,fractional programing based combined economic emission dispatch,and environmental restricted economic dispatch(ECED).A low-voltage microgrid system is investigated for three different scenarios.As a study optimization tool,an innovative,resilient,and strong hybrid swarm-intelligence optimization algorithm is utilised,which is based on combining the properties of the traditional grey-wolf optimiser,sine-cosine algorithm,and crow search algorithm.The employment of a time-of-use energy market pricing approach instead of a fixed pricing plan resulted in a 15% decrease in generation costs throughout the course of the research.When ECED was assessed with a 15%-20% demand side management based restructured load demand model for the microgrid system,the generation costs were reduced even further.
KEYWORDS demand side management,energy management,MGWOSCACSA,microgrid
1|INTRODUCTION
1.1|General overview
In Economic Load Dispatch (ELD),Renewable Energy Sources (RES) are employed primarily.According to ELD,many units interconnected in a power system network do not produce the same quantity of power to meet the load demand,but rather deliver according to their fuel costs,that is,the production cost per unit of production will fluctuate from one unit to the next.Total energy output,on the other hand,must meet total demand [1].On the basis of load demand,ELD is divided into two types:static ELD(SELD)and dynamic ELD(DELD).Dynamic ELD (DELD) is the case where the load varies over the time,it is known as SELD presents less complexity and contains limited constraints,for example,such as prohibited operating zones,ramp rates,etc,than DELD[2,3].But DELD is a more complex problem.DELD has more constraints associated with the Distributed Energy Resources (DER) and time periods along with the constraints of SELD[4].DELD must tackle problems such as the charging/discharging condition of energy storage systems,DER shut down timings,startup,and so on.
1.2|Literature review
Many research papers are being published to provide the best cost-efficient distribution of renewable energy generation.The main objective is to offer a reference to the economy of the power generation process and the competitiveness of the renewable energy sources(RES).RES is being one of the main solutions of the government in order due to the fuel price and,mainly,the environment.Computational methods have been employed to solve this problem when the cost function is continuous,smooth,non-convex,and differentiable [5].These methods are not recommend in the cases where the actual physical constraints are taken into account,being non smooth and convex problems[6].Classical optimization algorithms are employed to solve ELD for a long period of time,where lambda and gradient methods,together with and dynamic programing are being used in Smooth ELD [7].A complete ELD problem requires numerous constraints,generating,therefore,a high complex objective function,where the mentioned methods fail [8].The computational cost by the dynamic programing algorithms depends of the by dimensionality,and requires a long time in large generating systems,but they do not depend of the nature of the cost curve[9,10].Recent studies have shown immense research developments in the area of microgrid energy management with an aim to reduce the generation cost.DERs such as non-conventional energy resources,energy storage systems,combined heat and power systems etc.are considered to raise the complexity of the study [11-14].As a result,a microgrid is defined as the DERs aggregating load demand locations in a specific geographic area[15,16].It can be standalone or connected to a utility,with the latter kind of microgrid,and the operation is more dependable and efficient due to the ability to purchase and sell from the utility.The grid can support the utility-connected microgrid in the event that the DER fails,that is,it is required to avoid any DER failure and network shut down.It has spawned a slew of microgrid energy management research papers,including:To minimise the generation cost of a grid-connected microgrid,articles [17,18] used the imperialist competitive algorithm(ICA) and Matrix real coded GA (MRCGA).They tested the algorithms in a variety of scenarios,including DERs with narrow operational ranges,changing power prices,and changeable loads.A single utility company and many residential energy users were studied for DSM based on Game theory approach by the authors in Ref.[16],where a day-ahead pricing scheme and an energy consumption game were used to implement the day ahead load shifting DSM approach.The authors of [17],employed the Multi-Objective Particle Swarm Optimization technique to deal with multi-Objective Dynamic Economic and Emission Dispatch (MODEED) problem with demand side management (DSM).
1.3|Motivation
An interesting work was performed by references [18,19],wherein various methods of CEED were evaluated on different dynamic test systems to sort out the one which gives a proper balance between the generation cost and pollutant emission.This paper covers the research gap of the aforementioned articles by performing a similar study on a grid-connected microgrid system.To raise the complexity of the work,two different strategies of grid pricing were dealt with,and a balance trade-off magnitude for the generation cost and pollutant emission was calculated.Furthermore,the load model restructuring is done based on DSM strategy and its impact on generation cost and pollutants emitted was studied in detail.
The prime aim of this paper is to cut down the computational cost and efficiency to solve the pollution constrained cost-effective issues on microgrid problems.The authors couldn't find any research that used hybrid optimization approaches to solve these bi-objective issues in the literature.In big dimension complex constrained optimization problems,however,techniques such as the sine cosine algorithm (SCA),GWO,and CSA,among others,have been applied.To maintain a good balance between exploitation and exploration,SCA relies on switching between sine and cosine functions.GWO examines a broad search space for the best solution.Finally,because CSA can handle a large population size,it produces better results than many other algorithms and is less likely to become stuck in local minima solutions.One drawback of GWO is that each iteration has a significant number of equations and stages.To reduce the computational cost,the technique given in this study tries to prevent it.CSA and SCA,on the other hand,have only one conditional governing equation and produce good outcomes.The new hybrid technique viz.MGWOSCACSA,considers together the CSA,SCA and a modified GWO (MGWO).
1.4|Contributions of the paper
The prime points of the current article:
i.Two types of CEED methods are investigated on an LV grid-connected microgrid system.
ii.The generation cost and pollutant emission are determined for each case.
iii.A comparative analysis amongst power producing costs and pollutants emitted is performed.
iv.Two different methods of electricity market pricing strategies are also studied subsequently and the economic strategy between the two was sorted out.
v.All of the above are evaluated for DSM based restructured load demand model and the power producing cost and pollutants emission are studied.
vi.The optimization tool,MGWOSCACSA is presented for such problem,and robustness of the algorithm is also examined.
1.5|Structure of the paper
This part shows,how the rest of the paper is organised:The fitness function to be reduced is presented in Section 2,which also takes into account the equality and inequality constraints.Section 3 explains the strategy in detail.Section 4 presents case studies of the microgrid test systems,including the main statistical results,the validation of the approach and the quality analysis of the solutions;Finally,Section 5 summarises the conclusion of the whole work.
2|OBJECTIVE FUNCTION FORMULATION
2.1|Active power generation cost calculation of the microgrid test system
The equation of the cost function for a grid-connected microgrid system is given by Equation (1).
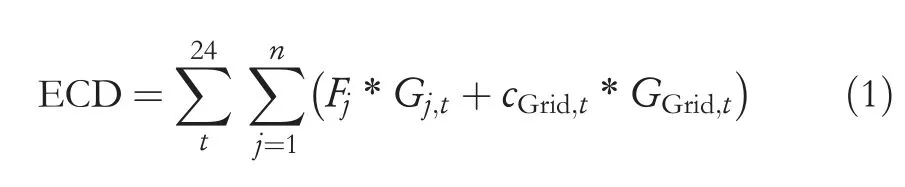
whereFj,andGjare the fuel cost coefficient and the power output of jth DG unit.CGridis the electricity market price with which the grid buys and sells power.
2.2|Emission dispatch for the microgrid system
To calculate the amount of carbon-di-oxide released in the atmosphere at the end of the day from the fossil fuelled conventional generating sources,it is employed in Equation(2),
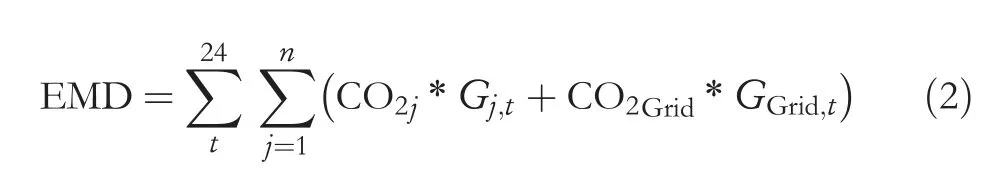
where CO2is the carbon dioxide emission coefficient and EMD is the total carbon dioxide emission.
2.3|FP based combined economic emission dispatch
Using this method,two competing and conflicting goal functions made up of the same choice and control variables are solved as a ratio.ECD stands for the economic dispatch equation,which is represented technically by Equation(1),and EMD stands for the emission dispatch,which is mathematically described by Equation (2).Then,by reducing the EMD:ECD ratio,a compromised solution may be discovered using the FP approach [18].This is stated mathematically by the Equation (3).

2.4|Environment constrained economic dispatch (ECED)
A proper balance between the two different objective functions given by Equations (1) and (2) was obtained in reference [19].They employed the Equation (4) considering together two parallelly focussed objective functions,improving the solution.
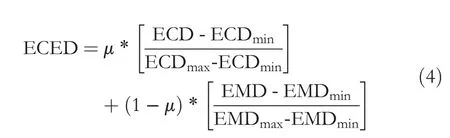
where μ lies between 0 and 1,ECDminand EMDminare the best values obtained by minimising Equations (1) and (2)respectively.The maximum outputs of ECD and EMD are collected by replacing the optimal parameters of ECDminin Equation (2) and EMDminin Equation (1),respectively.
2.5|Operating constraints
The DERs and grid are bound to the operating constrains given by Equations (5) to (8)
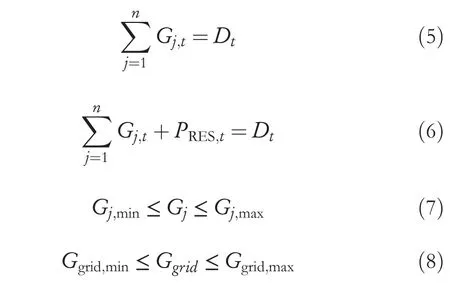
The demand isDtfor hourtwhile the RES output isPRES,tin terms of power.
2.6|Wind profile modelling
In the article [20],the authors described the linear wind profile.Wind power is expressed as a conversion from wind speed to power according to Equation (9),when the unpredictability of the wind speed is characterised as a random value.
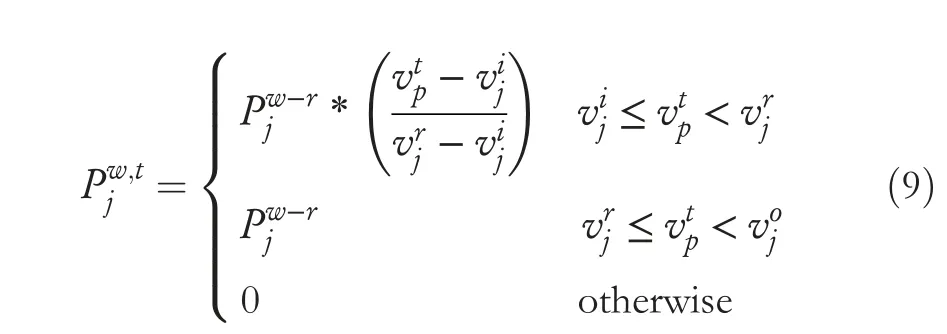
wherevijandvojstand for cut-in and cut-out wind speeds of the jth wind unit,respectively,vipstands for rated wind speed,andPjw‐ris rated wind power.
2.7|Uncertainty modelling
The uncontrollable and stochastic nature of the wind makes it a compulsive step to evaluate the uncertainty in their generation arising from their forecasted values.The mathematical equation used to evaluate the uncertainty is shown in Equations (10).
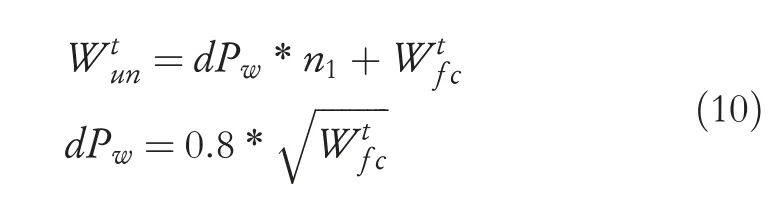
where,is the wind output in terms of power while considering the uncertainty,dPwstands for standard deviation of the wind output,and the day advanced projected wind output isThe normal distribution functionsn1andn1are randomly assessed normal distribution functions with a mean of 1 and a standard deviation of 0.
2.8|Demand side management strategy
DSM [16] is a strategy that utilities may utilise to reduce peak load demand in their systems and save money.Typically,utility providers would give incentives to consumers to encourage them to engage in the process.There are six types of fundamental approaches that are available for sizing the load demand viz.Valley filling,pick clipping,load shifting,growth of static load demand,strategic conversion and variable load shaping.The first three are primary level types,while the last three are secondary level types that use system planning and operation to control total load demand by restricting or extending it.The most recommended load control technique is the load shifting approach,which combines peak clipping and valley filling.The use of adjustable loads allows for load shifting at the customer level.The load shifting approach shifts controllable loads from peak to off-peak periods with no change in energy usage.Table 1 The six DSM load shape approaches are depicted in Figure 1.
Some of the salient features of the load demand model restructuring using the DSM techniques are as follows:
a.The peak load demand after implementing DSM technique does not exceed the original forecasted peak load of the system.
b.The minimum demand after implementing DSM technique does not exceed beyond the system's original minimum demand.
c.The sum of the load and average of the load for the system remains the same with and without DSM at the end of the day [16].
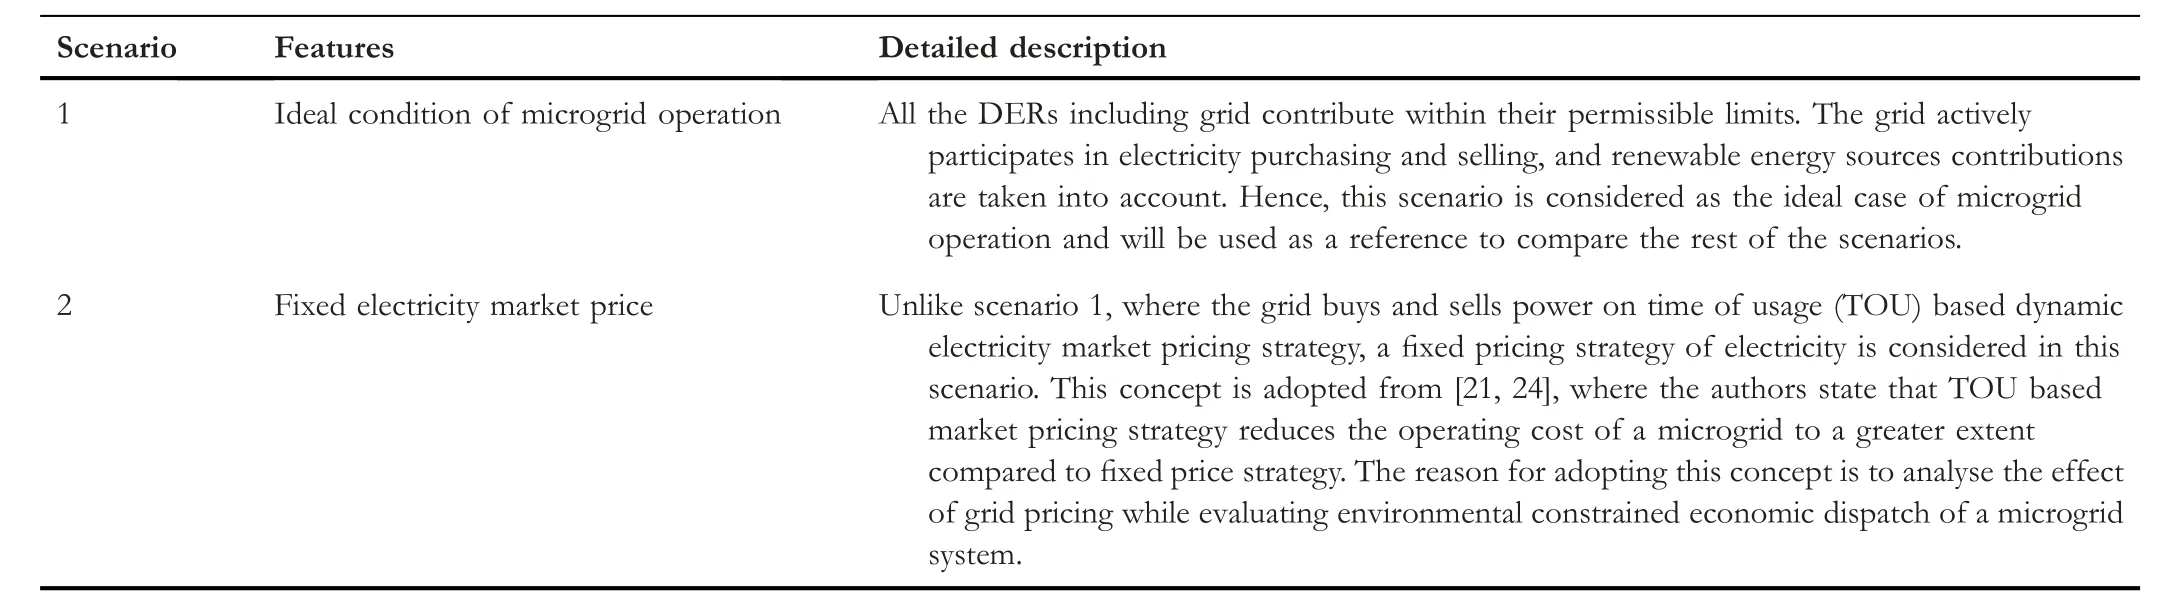
TABLE 1 Scenarios studied and their description
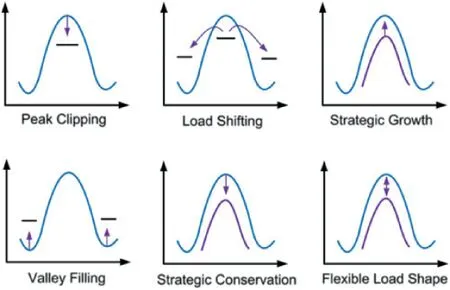
FIGURE 1 Different types of demand side management load shape methods
3|HYBRID GREY WOLF OPTIMISERS
For optimising various problems in microgrid systems utilising renewable energy power stations,this study uses GWO,modified GWO,hybrid MGWO-CSA,hybrid MGWO-SCA,and hybrid MGWO-SCA-CSA.The details of mathematical modelling for the upper mentioned algorithms are structured in this section.
3.1|Grey wolf optimiser (GWO)
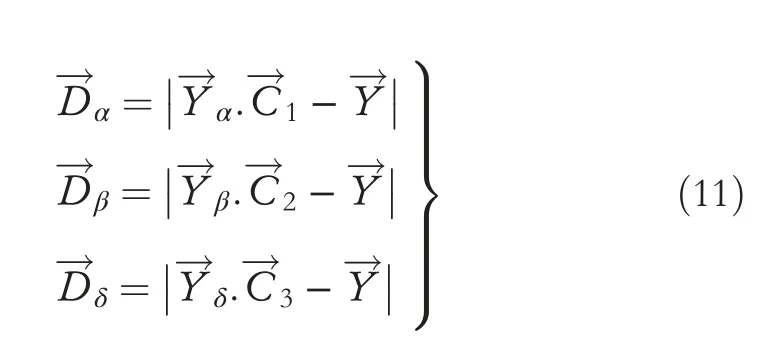
GWO [22] is an algorithm inspired by wolves' hunting behaviour while consuming their food.A wolf pack maintains a sequential order amongst the wolfs.α is the wolf that leads the pack,although it isn't the most powerful.The second in command is known as β wolf.Its function is to maintain group discipline and to aid the wolf in capturing the prey.δ is the third ranked wolf,being its labour to be scapegoat.Ω indicates the others wolves among the wolf pack,being the last according to the ranking.Hence,the best three solutions that is,α,β and δ will be achieved by the GWO,while the other one is Ω.Equation (11) represents the mathematical description of the wolf hunting technique.
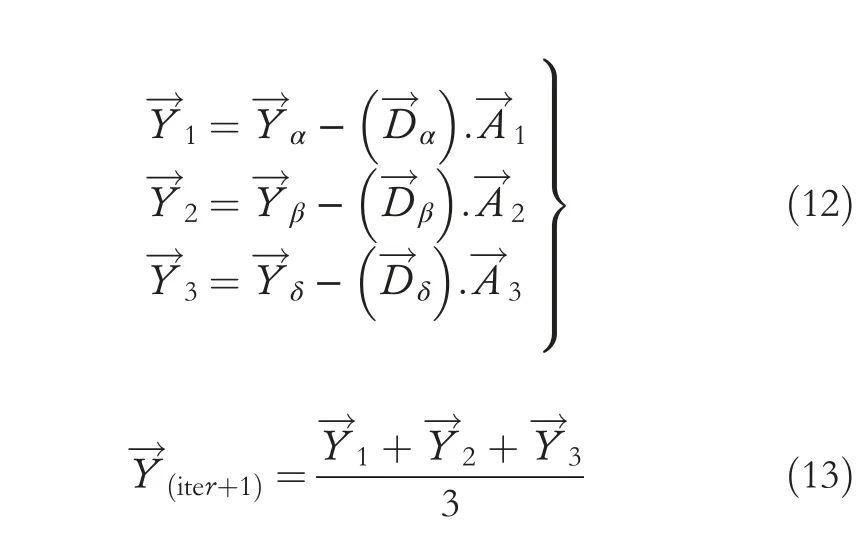
Equation (12) calculates the wolves' position updating process.
According to the Equation (14),A and C are calculated.
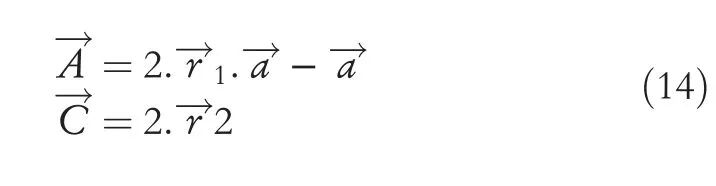
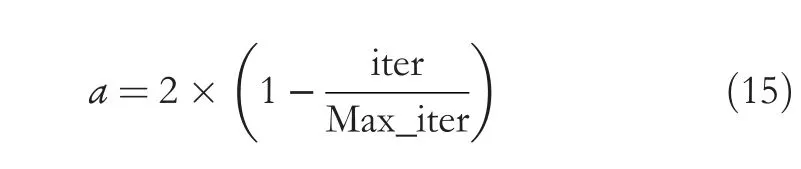
In case|A|>1,the wolves shift away from the prey,but in case|A|>2,they are dragged towards the prey.Equation (15) gives ‘a,’ which decreases linearly from 2 to 0.
3.2|Modified GWO‐SCA‐CSA
The main ambition of this work is to provide a method for solving different optimization problems on microgrid systems that lowers computing cost and increases efficiency at a time.There are not many papers in literature that address hybrid optimization strategies in these issues,according to the authors.Other techniques,such as the sine cosine algorithm (SCA),GWO,and CSA,have been utilised in situations with higher dimensionality and complexity,resulting in additional optimization restrictions.SCA generates a trade-off between exploitation and exploration by flipping between sine and cosine functions.GWO examines a broad search space for the best solution.Finally,CSA,by utilising a large population base,gives more fit solutions than other approaches and avoids being cornered in local minimum solutions.
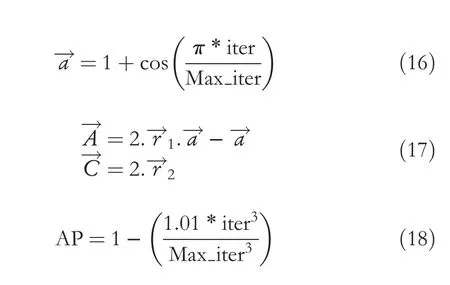
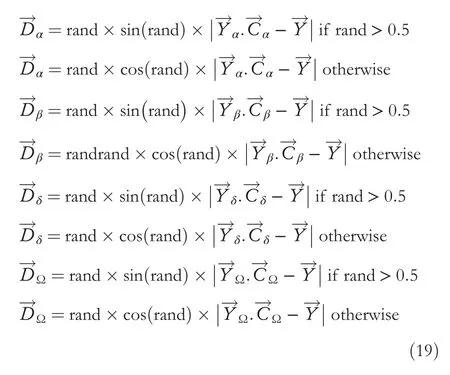
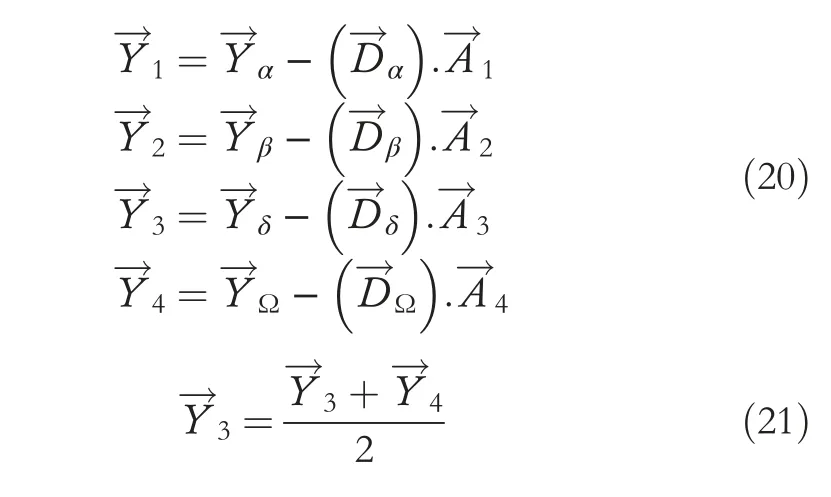
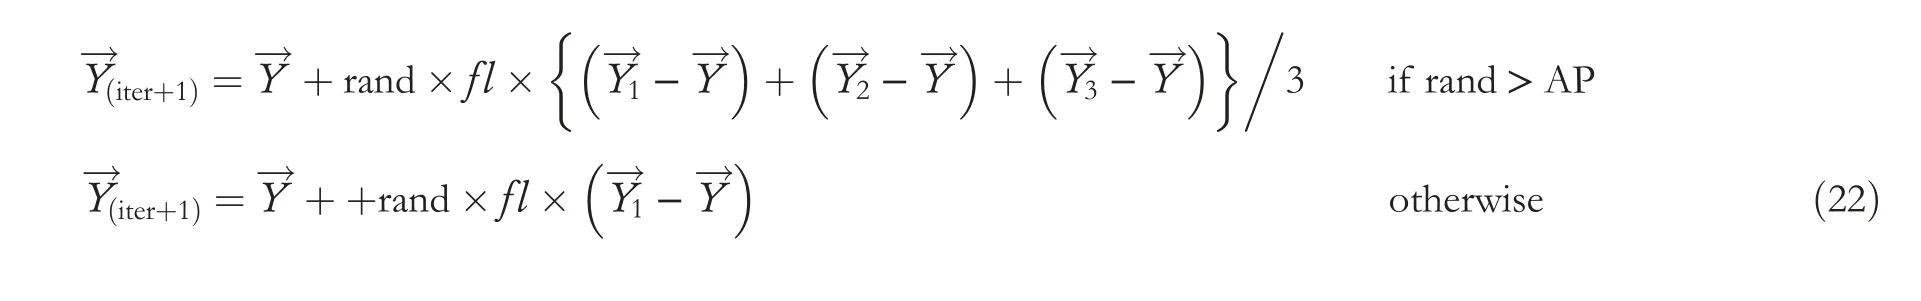
The three algorithms,Modified Grey wolf algorithm(MGWO),sine cosine algorithm (SCA),and crow search algorithm(CSA)were combined together to form a new hybrid MGWO-SCA-CSA algorithm.The position cum iteration updating equation from MGWO-CSA and the hunting equation from MGWO-SCA are used in the Modified GWO-SCACSA [23-25] method.The parameters ‘AP’ of CSA and‘a' of MGWO ensure that the algorithm is explored and exploited.On the other hand,for the algorithm's convergence to achieve the best solution,‘fl’of CSA and‘A’of MGWO are used.The hunting equation is examined in conjunction with sine and cosine functions to prevent the local minima solutions.The restructuring of the mathematical equations of GWO to obtain MGWOSCACSA is mentioned below from Equations (16) to(22).Equation (19) shows the exploration stage of the proposed algorithm,whereas Equations (20)-(22) covers the exploitation or position updating stage of the algorithm.
The tuning parameters which are represented by Equation (14) and (15) of GWO are modelled as mentioned in Equations (16) and (17).A tuning parameter,awareness probability (AP) of CSA,which lies between 0 and 1 is mathematically modelled in the proposed MGWOSCACSA to automatically change between 0 and 1 with the increase in the number of iterations.This is represented by Equation (18).
The distance amongst the wolves and the prey in the exploration stage or the hunting stage which was represented by Equation (11) in GWO is modified and represented by Equation (19) in the proposed MGWOSCACSA.
The position updating strategy of the wolves,also known as the exploitation stage of the algorithm,which was formerly represented by Equations (12) and (13) in GWO is modified and represented by Equations(20)to(22)of MGWOSCACSA.
4|CASE STUDIES
4.1|System description
The concerned microgrid system operating in grid connected mode comprises of a fuel cell(FC),wind turbine(WT)system and micro-turbine (MT).Table 2 shows the operating ranges,bids and CO2emission per kilowatt of MT,FC and grid.The range of upstream power flow from microgrid to grid is 30 kW,whereas the range of downstream power flow from the grid to microgrid is 80 kW.Figure 2 shows the load demand and electricity market price of the system.Figure 3 shows the forecasted hourly wind speed for a geographical location.The cut-in speed,rated speed and cut-out speed for the 10 kW wind turbine system are 5 m/s,15 m/s and 30 m/s respectively.Personal Computer specifications:AMD Ryzen 5 5600H processor with Radeon Graphics,8 GB RAM on a MATLAB R2014a software.Optimization tools parameter settings:Population size-80;Maximum Iterations-500;fL:2.
4.2|Results and Discussion
The outputs from wind turbine were obtained by utilising the hourly speed and formulated as mentioned in Equation (9).The same has been displayed in Figure 4.ECD and EMD are evaluated for both TOU-based and fixed price strategy of electricity pricing.The fixed price of the grid is evaluated by taking the mean of the 24 h grid price shown in Figure 2.It can be seen from Table 3 that minimised value of ECD is less when the grid was charging the microgrid on TOU basis rather than fixed price basis.This is because in TOU basis the grid can buy and sell conveniently depending on varying the load demand compared to the scenario when the price is fixed.Table 3 also shows that different grid pricing strategies (TOU and Fixed) had no effect while EMD was determined for the test system.
FP was evaluated to obtain a compromised output between the operating cost and emission for the microgrid system with TOU-based market pricing.The generation cost was found to be $743 and the amount of pollutants emitted was 1038 kg.
Thereafter ECED was evaluated for both TOU and fixed market price to obtain a trade-off solution between the minimum generation cost and atmospheric pollution.The generation cost was found to be $546 and the amount of pollutants emitted was 1002 kg for TOU pricing.These values present a clear picture of the superiority of ECED over FP-based CEED approach.
The generation cost surged up to $575 when fixed pricing was considered which was obvious from aforementioned evaluation of ECD for both TOU and fixed pricing strategies.Figure 5 depicts the hourly production of MT,FC,and grid when ECED was assessed using the TOU method,whereas Figure 6 displays the hourly output of MT,FC,and grid when assessed using the fixed price strategy.It can be clearly seen that the grid participates predominantly trading power in Figure 5 (TOU strategy) whereas less trading of power from the microgrid is noticed in Figure 6 (fixed pricing strategy).
Thereafter,ECED was evaluated for restructured load demand based on DSM strategy.Considering the load demands at every hour comprises of 15%-20% of elastic loads which can be shifted to hours with low electricity market price,the load demand curve was restructured.Figure 7 shows the restructured load model for 15%,20% and the expected load demand model.Figures 8 and 9 shows the share of elastic and inelastic loads during every hour which finally sums up to the overall demand at the end of the day respectively.
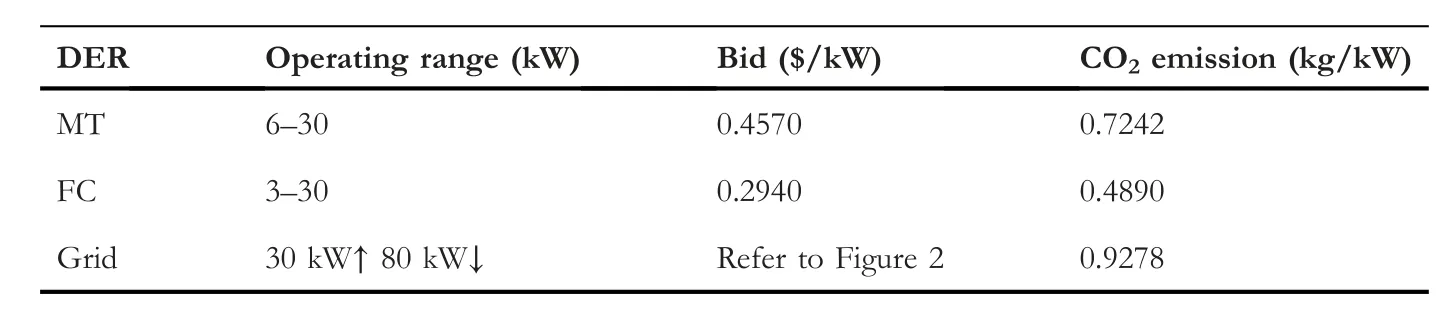
TABLE 2 Distributed energy resources parameters
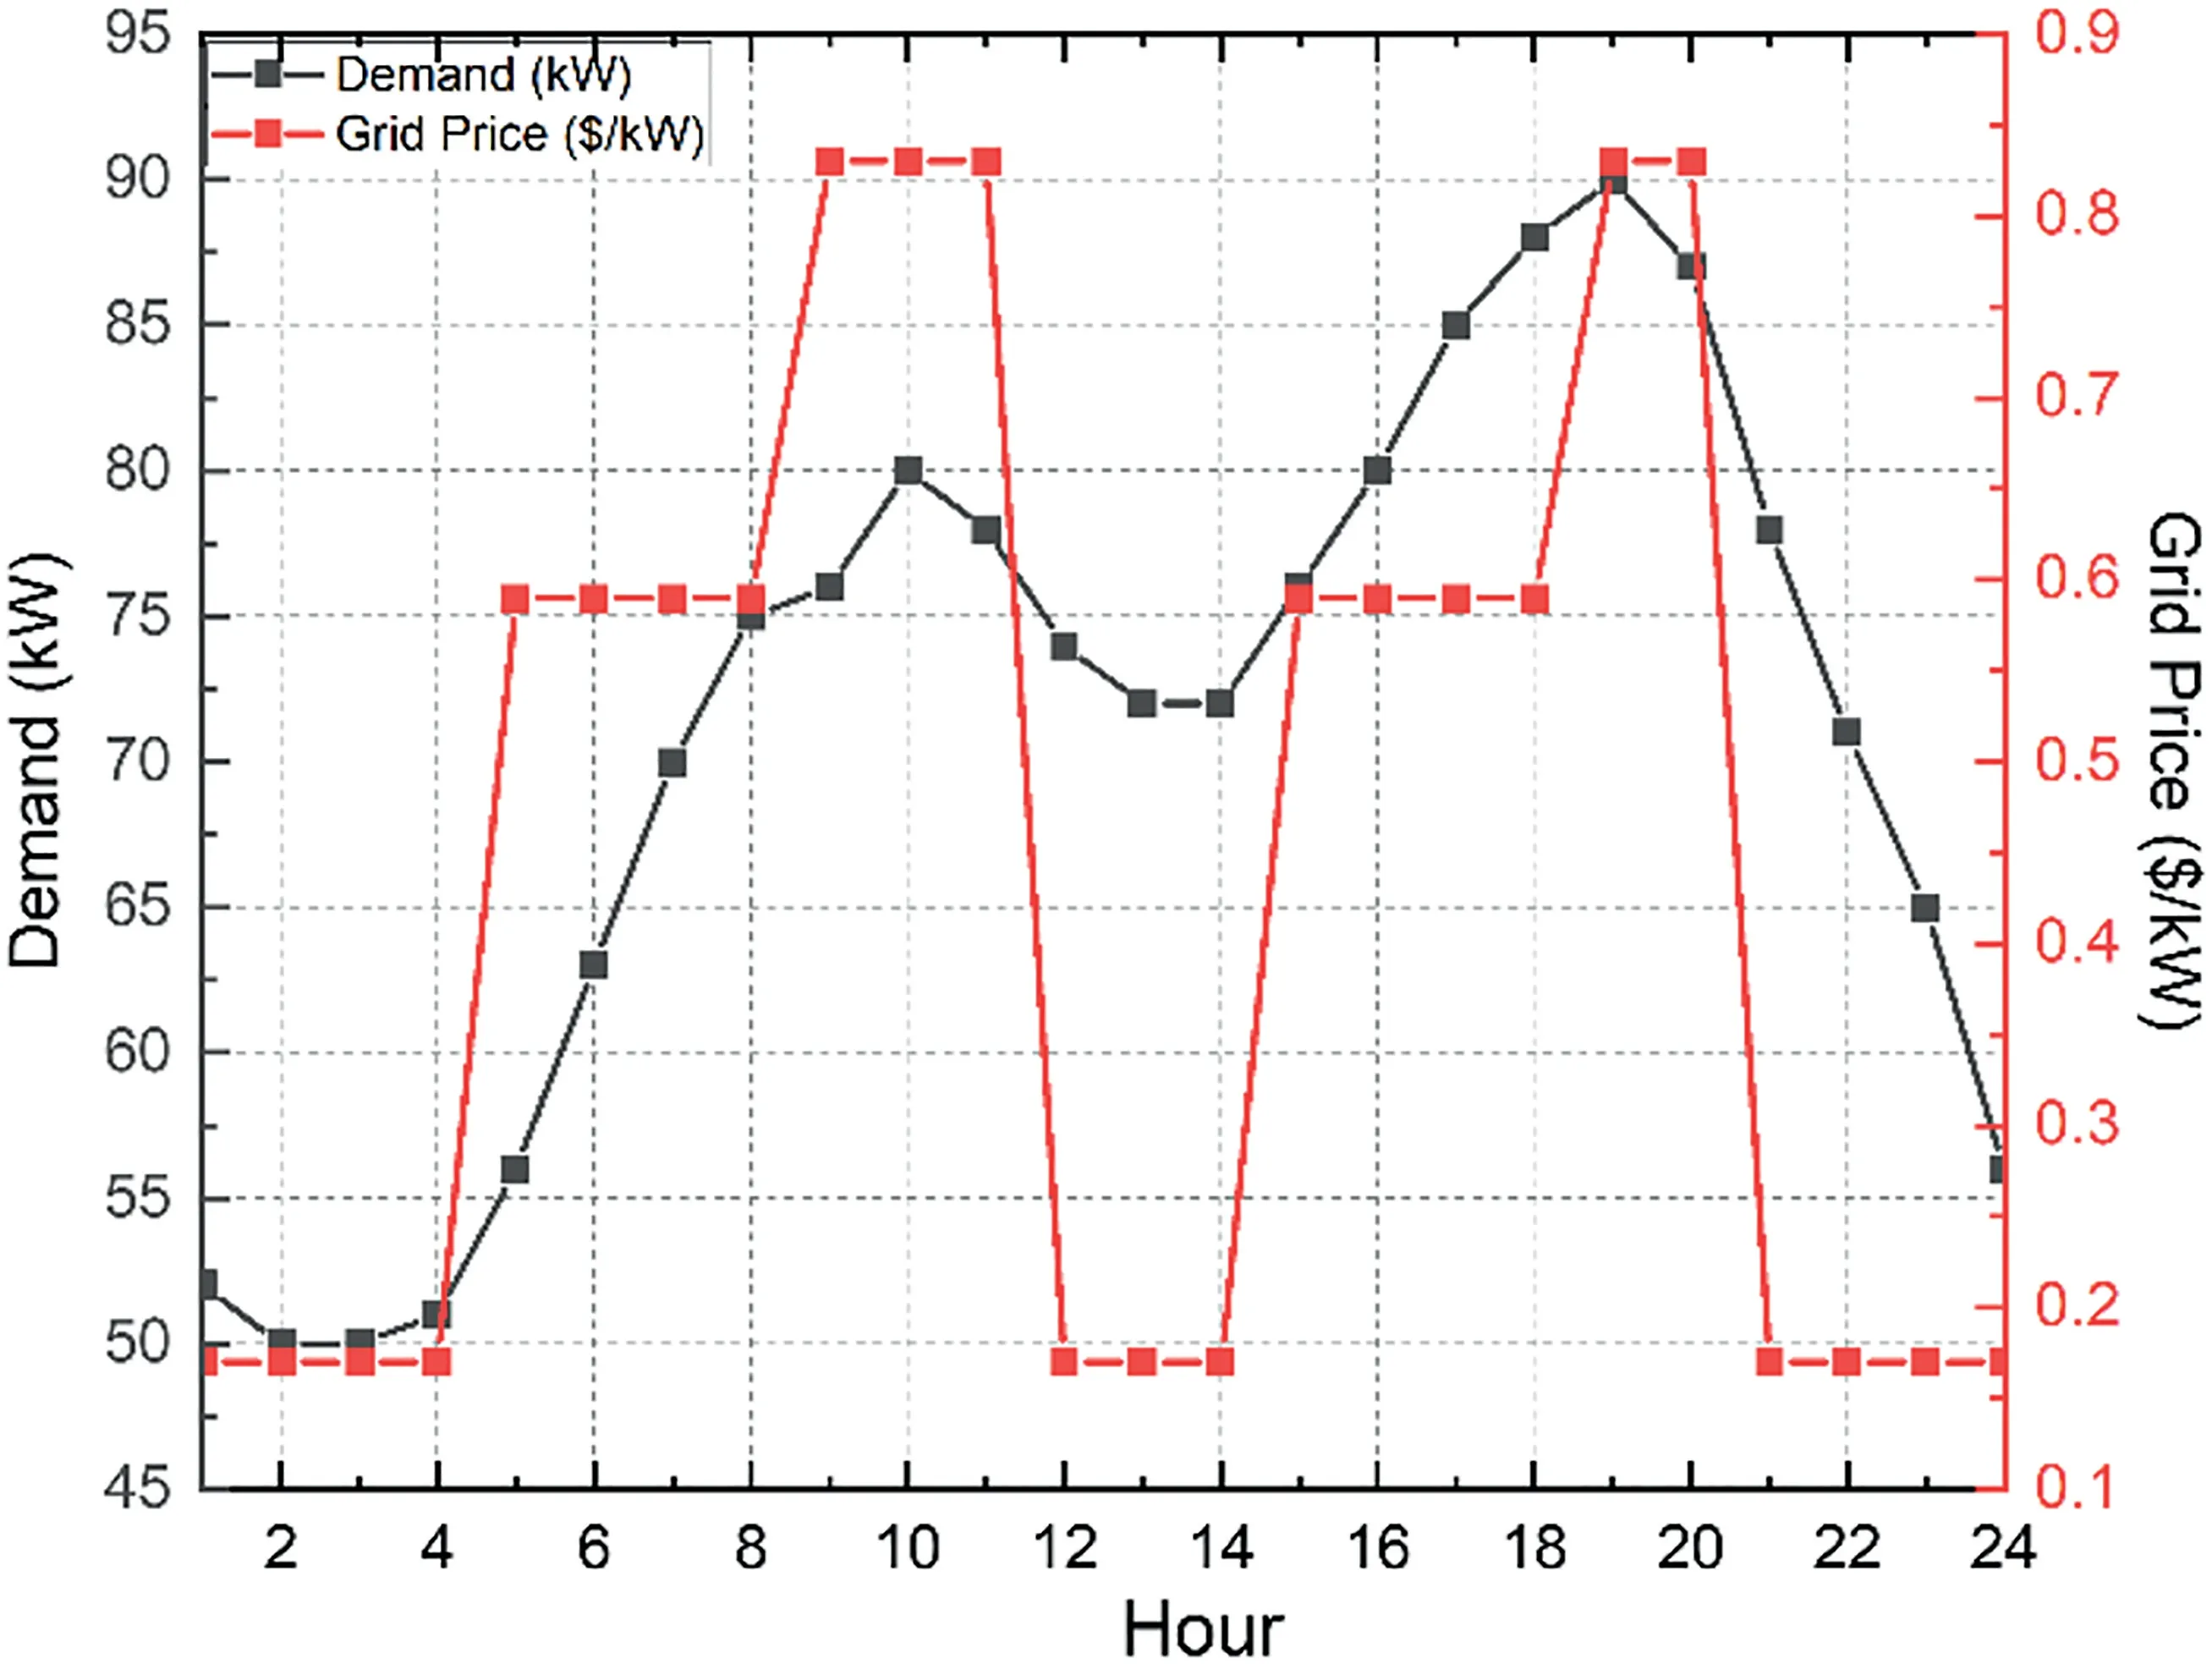
FIGURE 2 Load demand (kW) and electricity market price ($/kW)
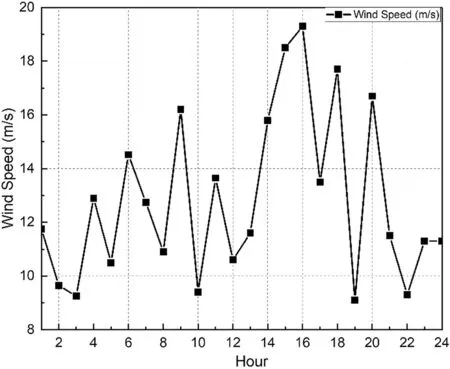
FIGURE 3 Dynamic wind speed
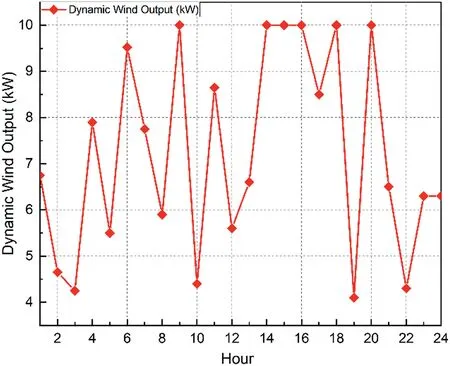
FIGURE 4 Dynamic output of wind power
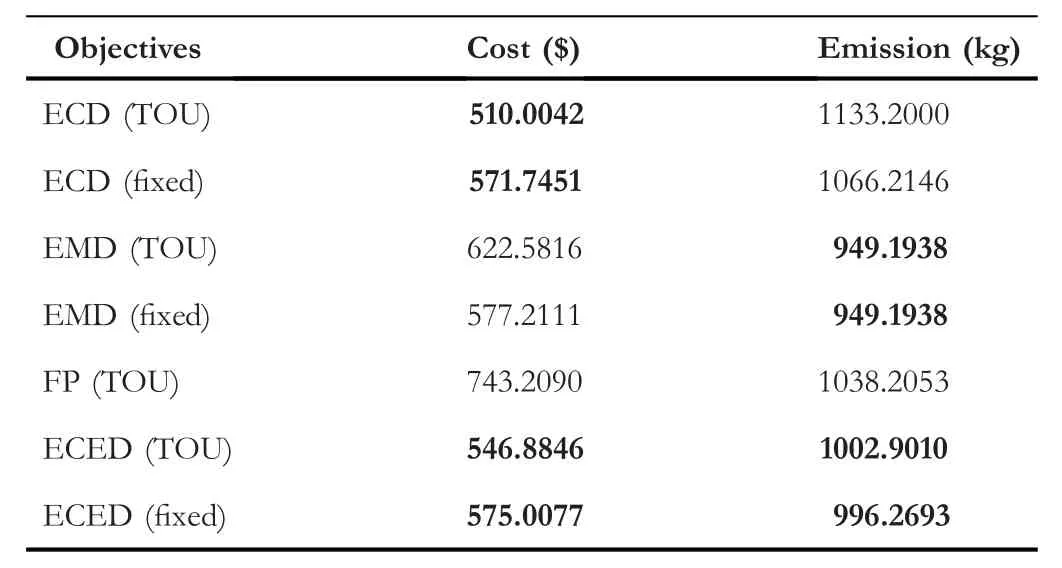
TABLE 3 Cost and Emission for various objectives
Expected load demand,though not practiced in reality,refers to the situation where the microgrid can restructure its load pattern on the basis of TOU-based electricity market price charged by the utility.Had this been possible,that the demand of the microgrid system is less when the grid charges high and peak load of the system attains when grid charges the least,a lot of relaxation would have been realized in the generation cost of the system.This is illustrated with results in the later part of this section.
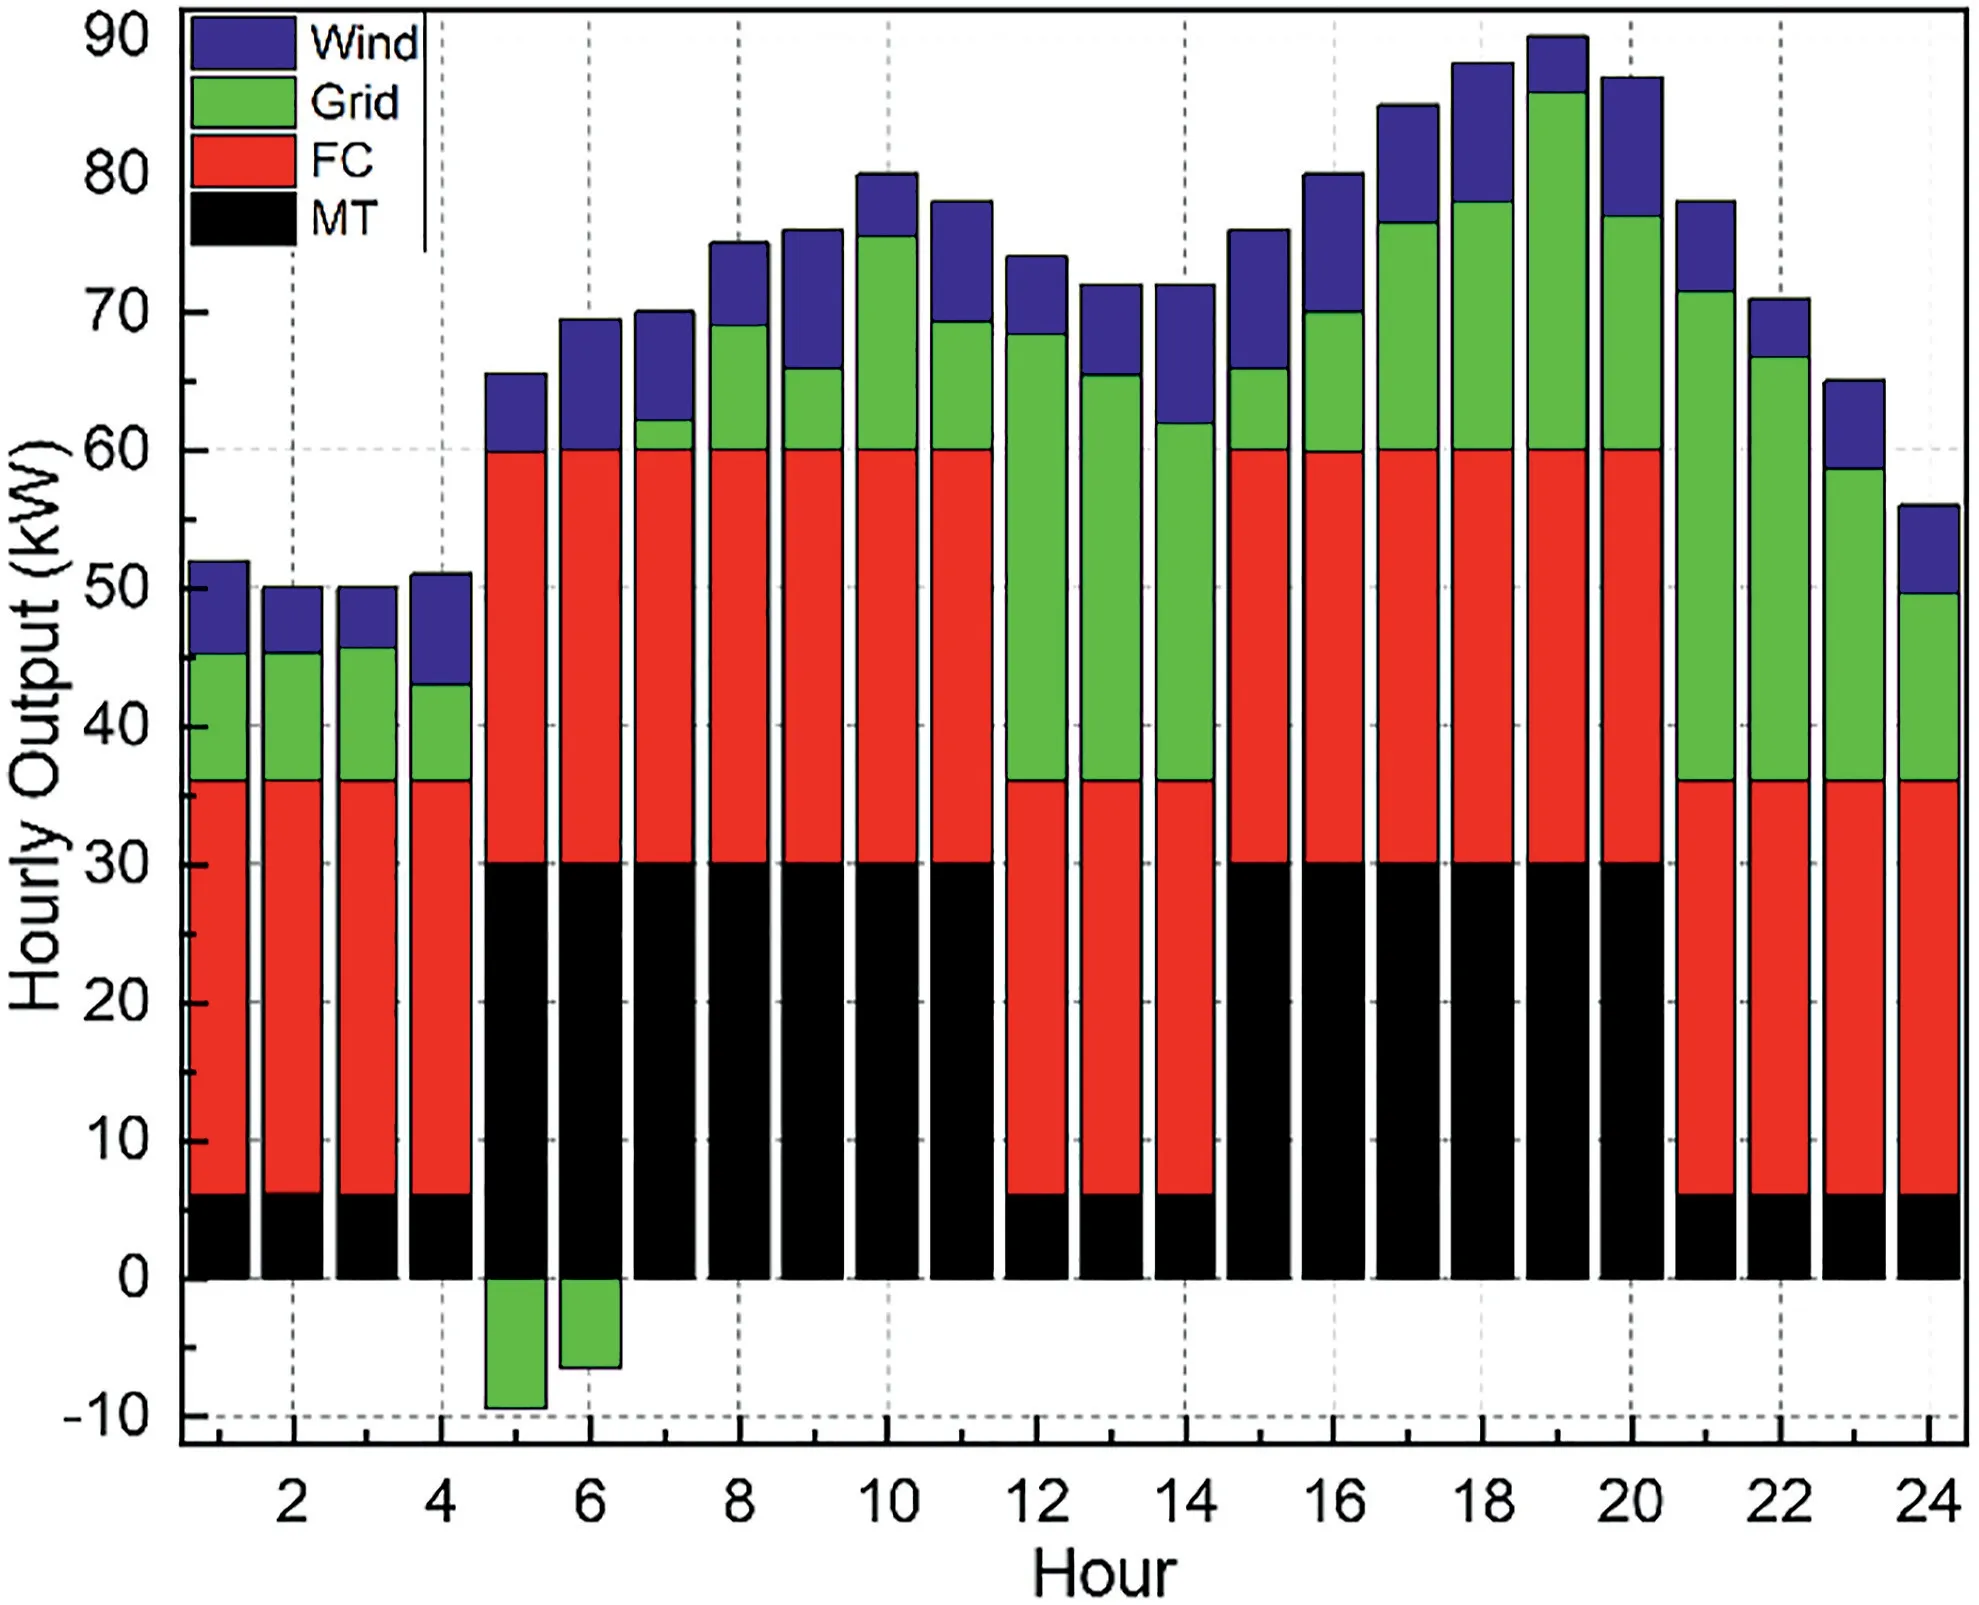
FIGURE 5 Hourly output when environment constrained economic dispatch was evaluated for time of usage market pricing strategy
All of ECD,EMD and ECED were evaluated for 15%,20%DSM and expected load demand.It is clear from Table 4 that DSM plays a major role in minimising the generation cost of the microgrid system.The ECD value which was $510 without DSM reduced to$485,$477 and$346 for 15%DSM,20%DSM and expected load respectively.On the other hand,emission depends on the total load demand of the system.Although DSM restructures the load demand model,the overall load demand at the end of the day remains the same.Hence from Table 4 it is observed that the value of EMD remained unaltered.
Also when ECED was evaluated,generation cost value which was$546 without DSM reduced to$522,$514 and$382 for 15%DSM,20%DSM and expected load respectively.Also,as mentioned above,the amount of pollutants emitted remained the same (~1002 kg) throughout.
Table 5 shows the generation costs and amount of pollutants emitted when ECED was evaluated for various DSM levels and also for the expected.Figures 10 and 11 shows the hourly outputs of DERs for 15% DSM,20% DSM and expected load respectively.The participation of the grid has the most impactful contribution in minimising the generation cost of the system.Expected load demand,although practically impossible,reflects how a mutually dependent relation between the grid and microgrid consumer can reduce the generation cost of the system.Figure 12 highlights the drop in the generation cost for both ECD and ECED based on different levels of DSM.
Table 6 stands for the minimum operating cost,maximum operating cost,mean and standard deviation(STD)when ECD was evaluated for 30 repeated mutually independent trials by the proposed hybrid MGWOSCACSA algorithm.The least values in STD signify the ability of the algorithm to deliver results nearer to the minimum value for maximum number of trials.Also a convergence time of approximately 0.2 s per iteration keeping in mind the various constraints and stages in the algorithm is a merit of the algorithm worth mentioning.Figure 13 shows the convergence curve of the algorithm when ECD was evaluated for various DSM levels.The algorithm attained the least generation cost (converged) within 100-110 iterations for all the cases.
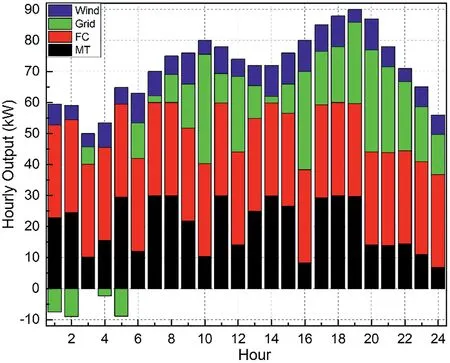
FIGURE 6 Hourly output when environment constrained economic dispatch was evaluated for fixed market pricing strategy
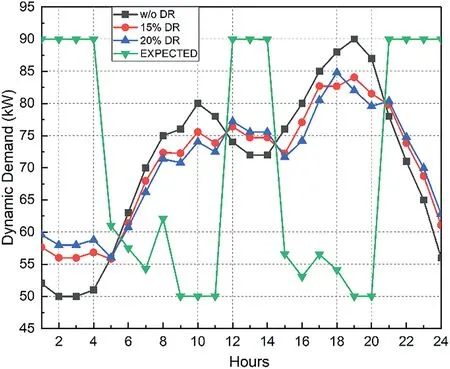
FIGURE 7 Dynamic forecasted load,demand side management-based load,expected load demands
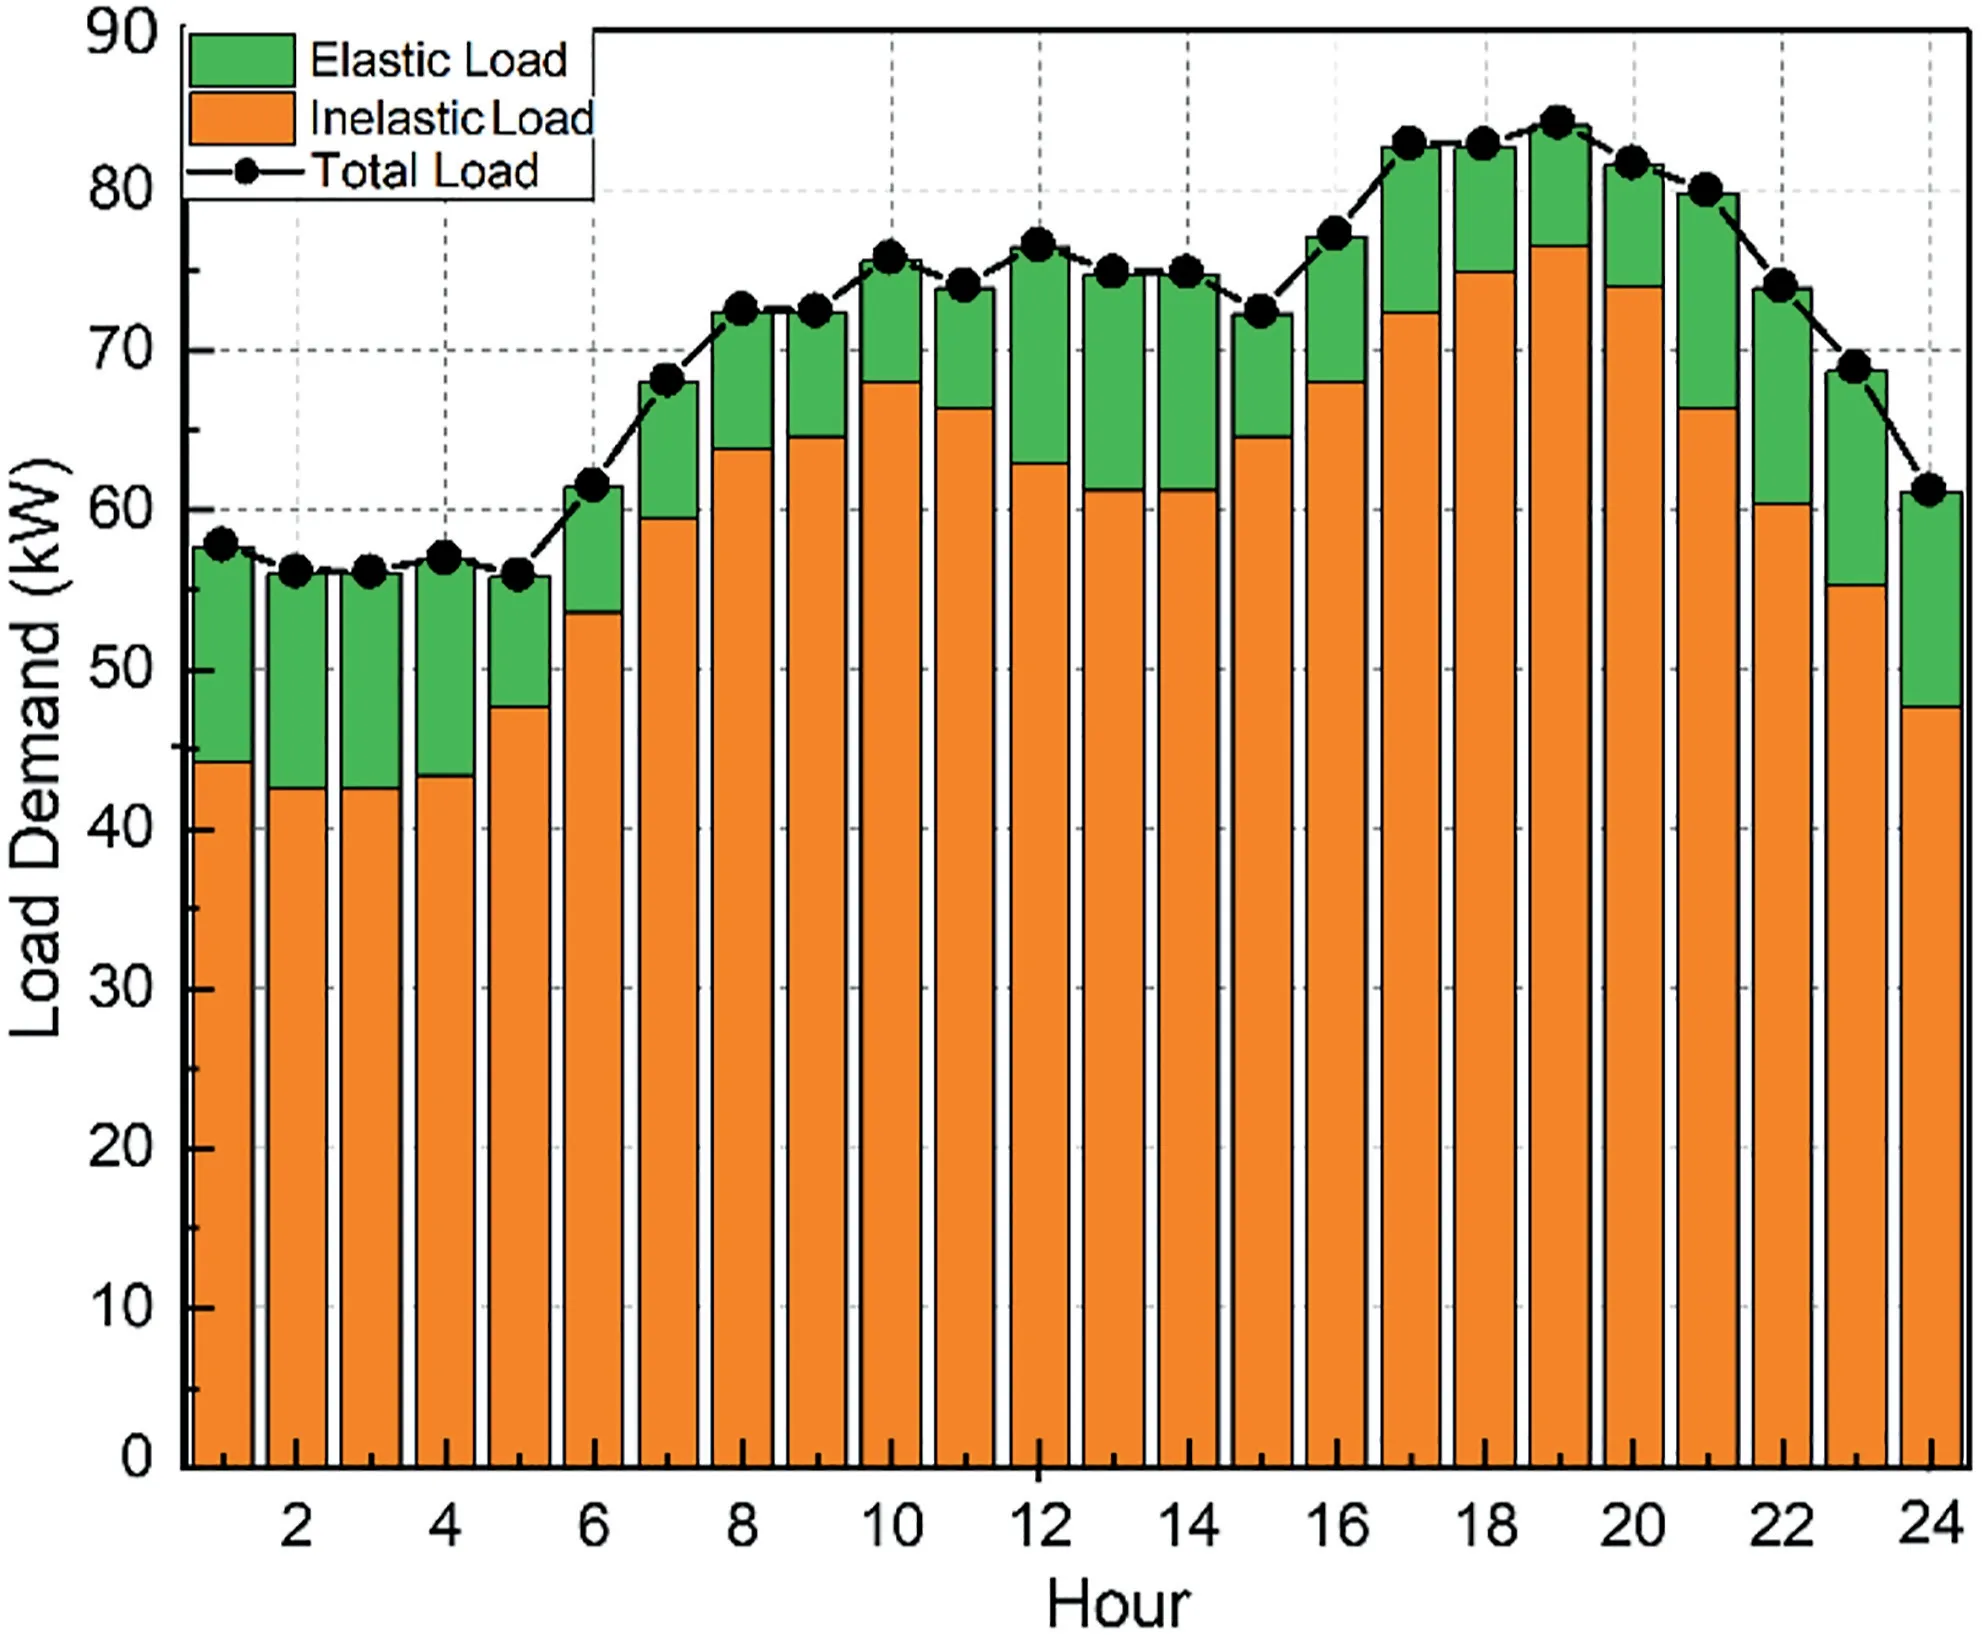
FIGURE 8 Inelastic,elastic and total load for 15% demand side management scheme
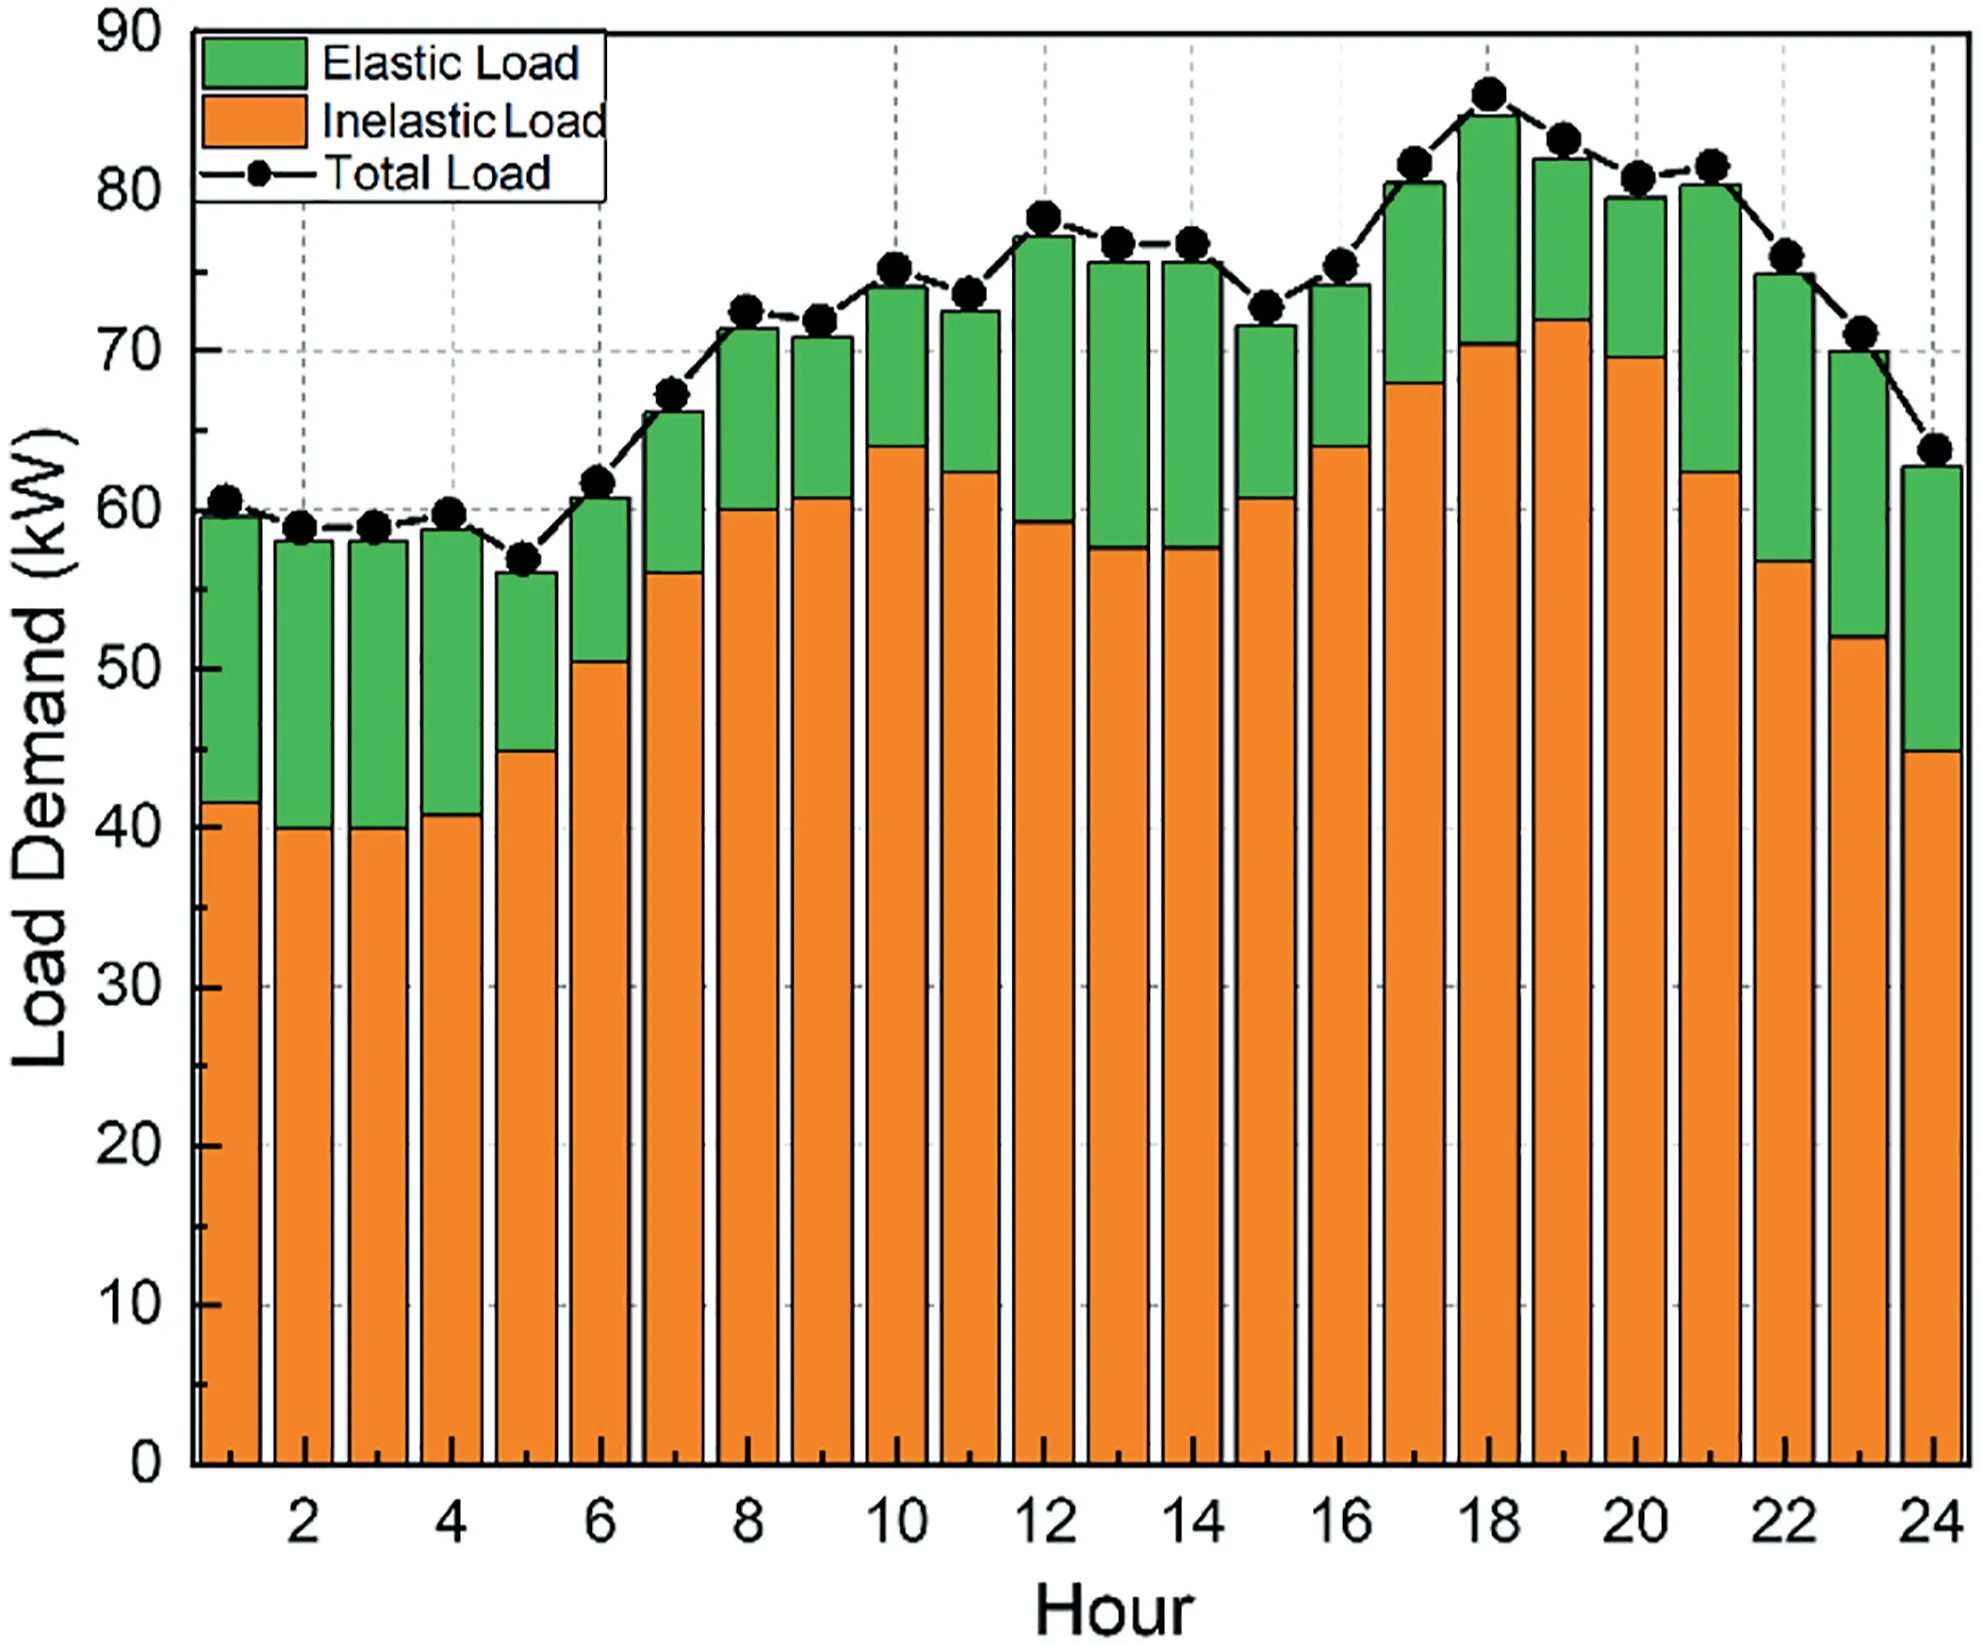
FIGURE 9 Inelastic,elastic and total load for 20% demand side management scheme
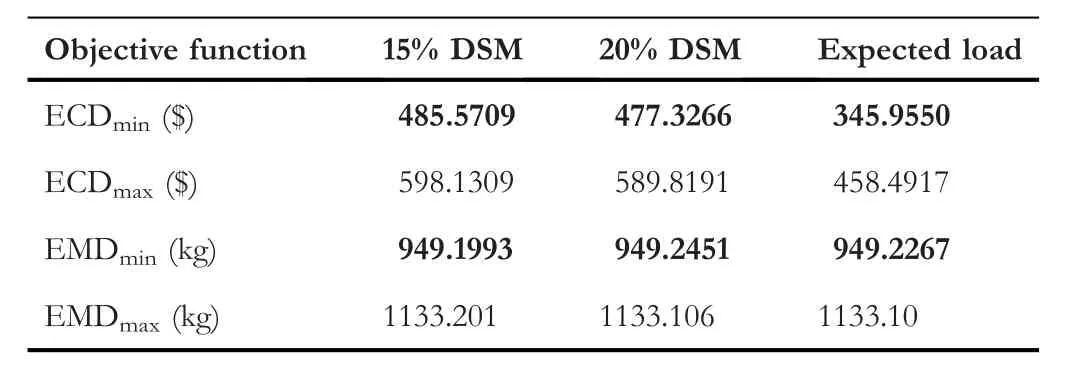
TABLE 4 Demand side management-based results for various objectives with time of usage
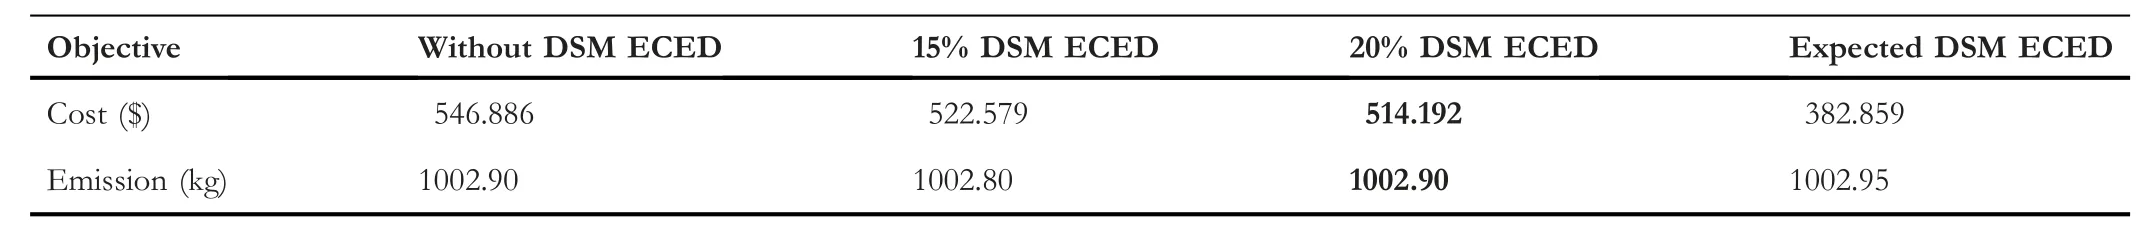
TABLE 5 Environment constrained economic dispatch values for different demand side management levels
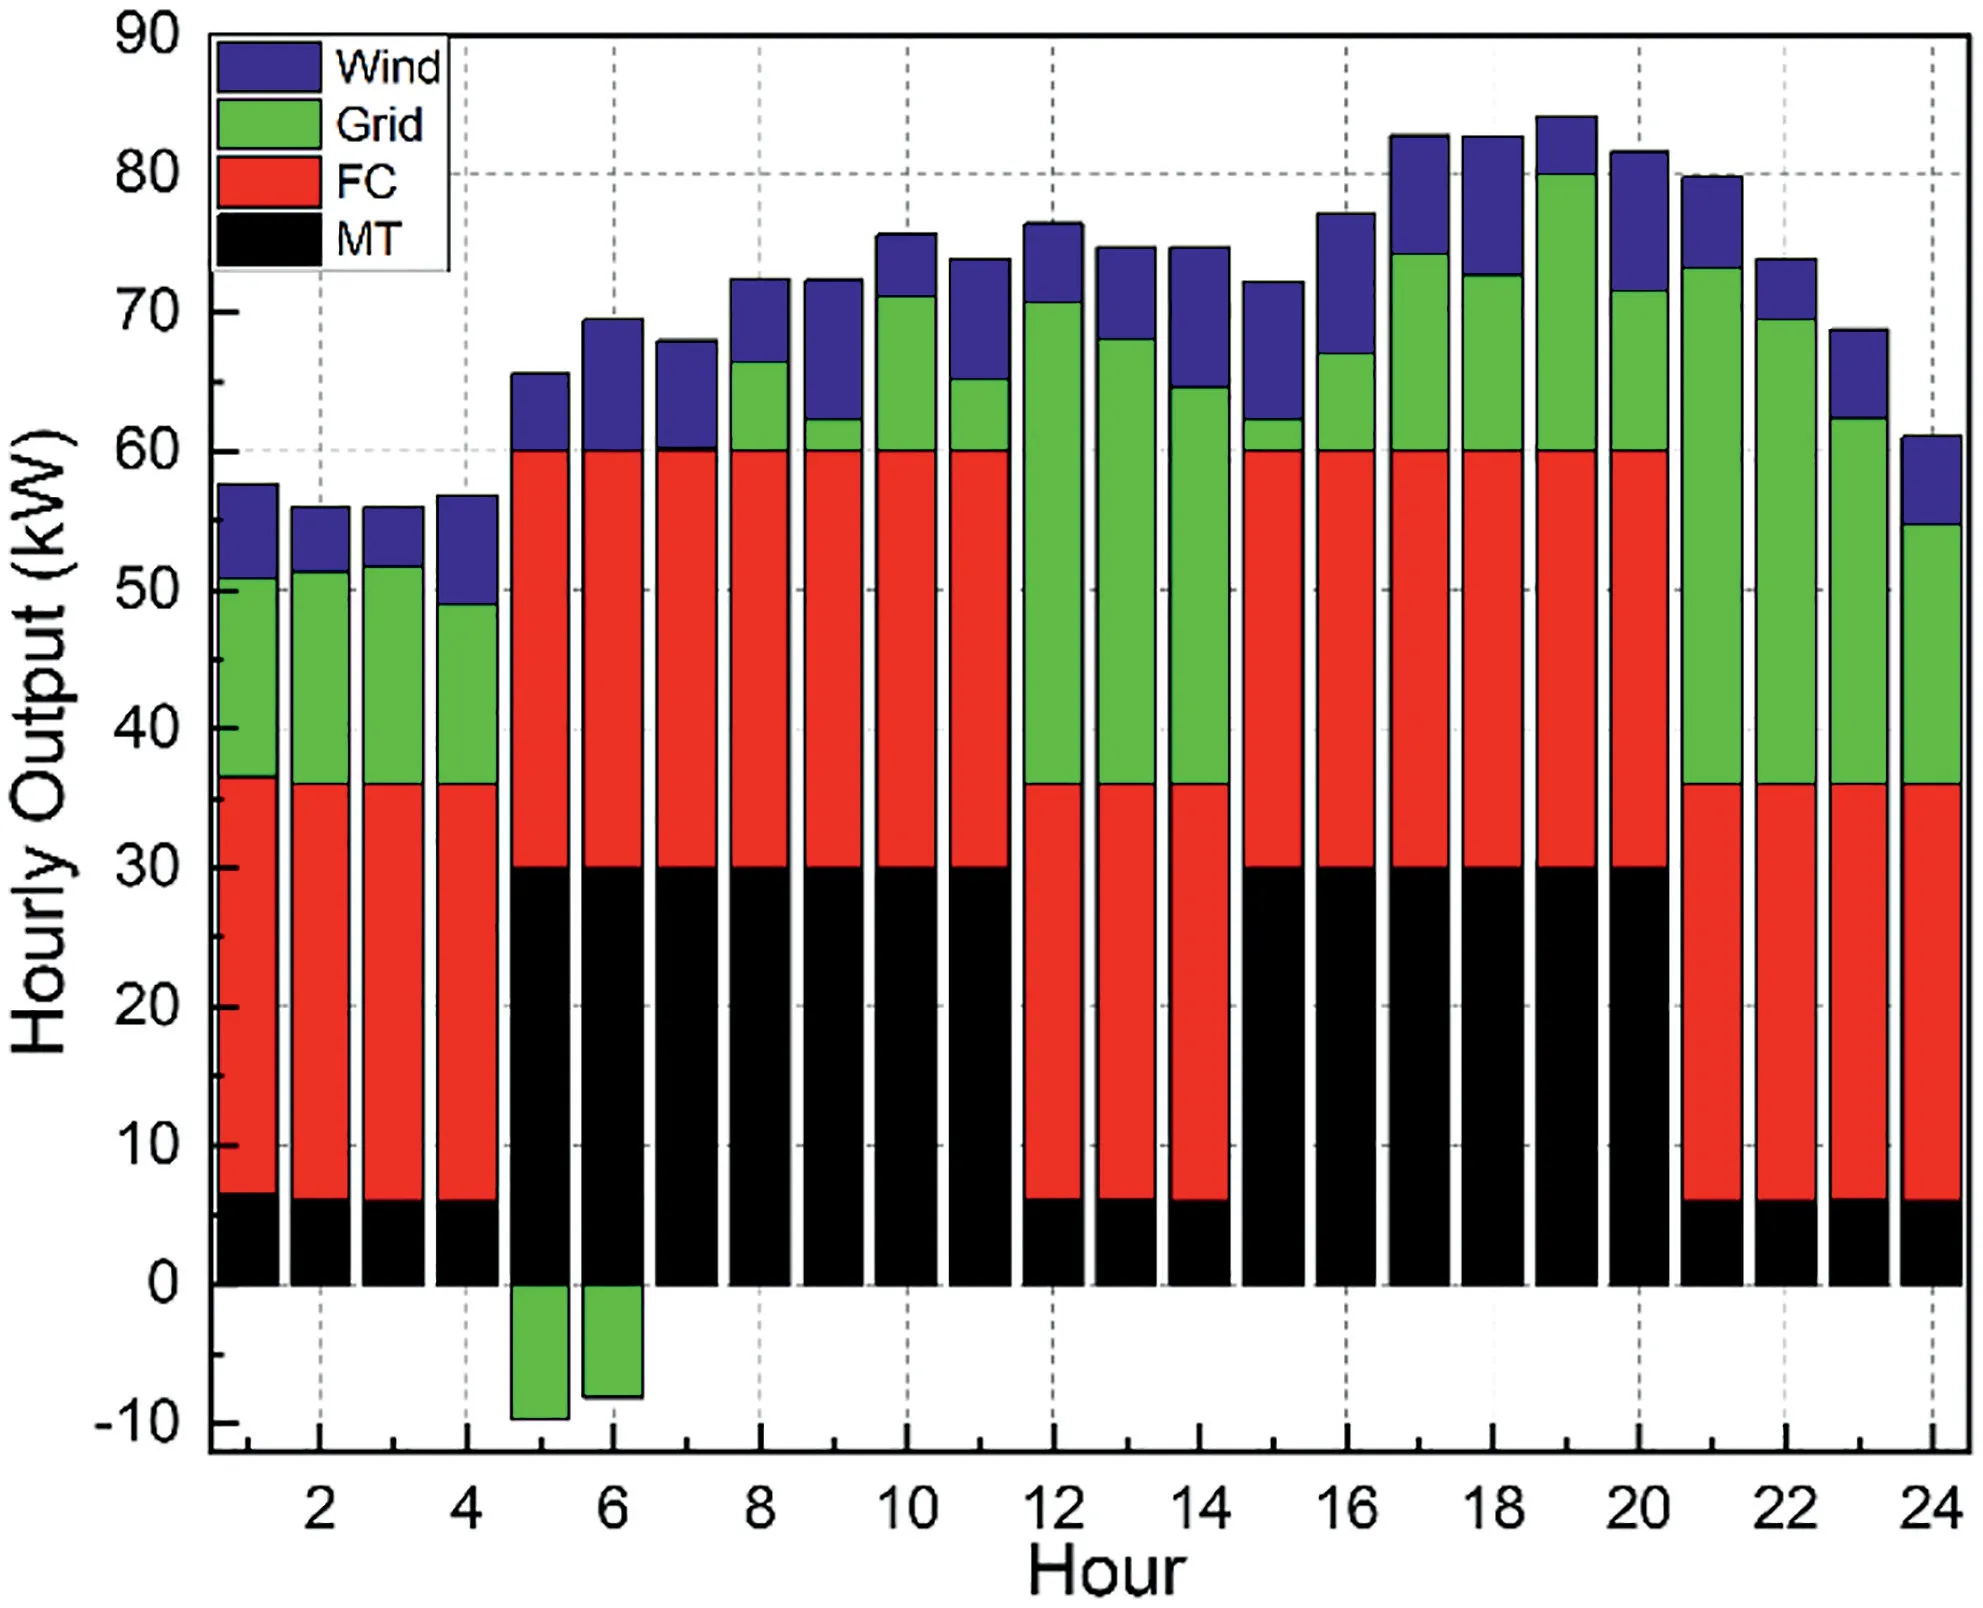
FIGURE 10 Hourly outputs of DERs when environment constrained economic dispatch was evaluated with 15% demand side managementbased load demand
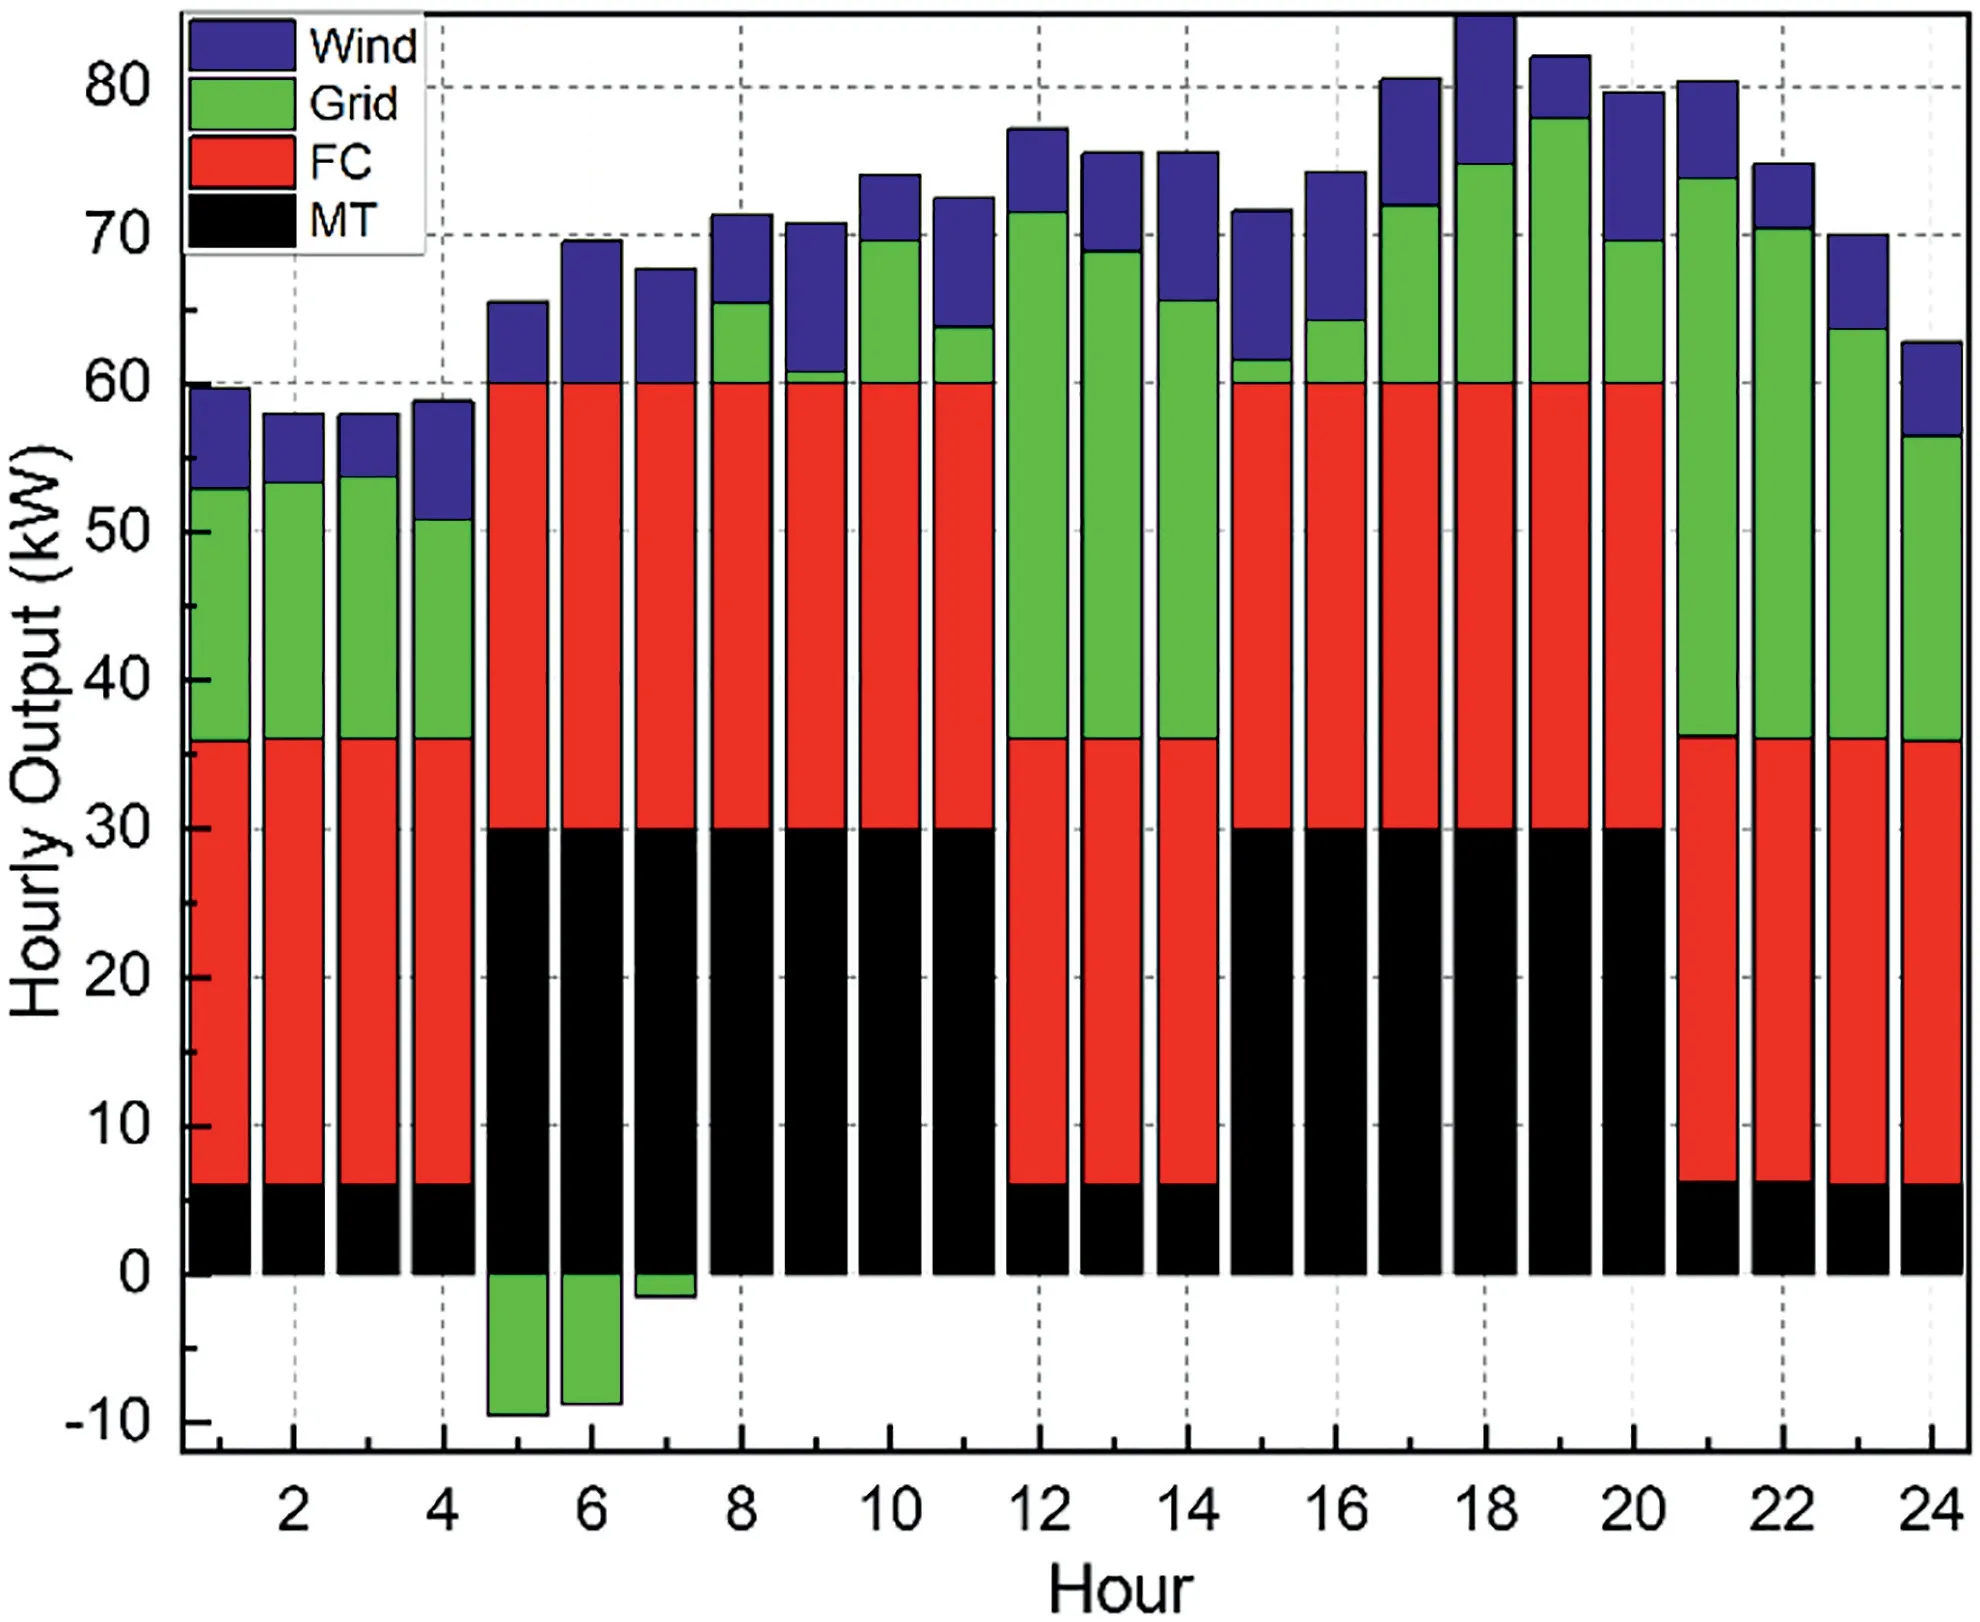
FIGURE 11 Hourly outputs of DERs when environment constrained economic dispatch was evaluated with 20% demand side managementbased load demand
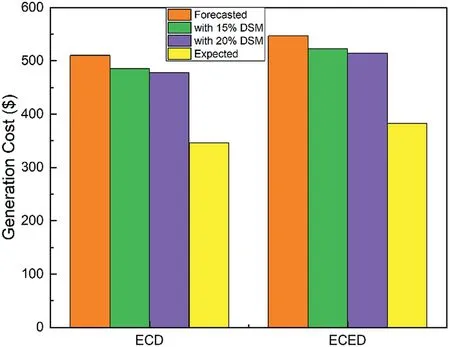
FIGURE 12 Fall in the generation cost of the system for demand side management-based load demand and expected load
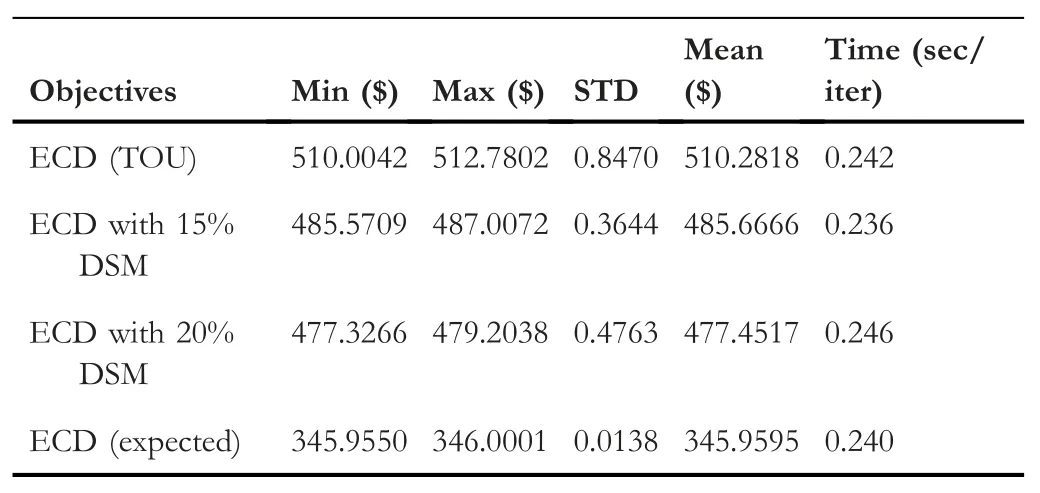
TABLE 6 Statistical analysis of the proposed MGWOSCACSA algorithm
5|CONCLUSION
Two different types of grid pricing strategies were studied on a microgrid system with an aim to attain a balanced compromised solution between generation cost and pollutants emission considering DMS strategy and the findings led to the following conclusions:
a.When comparing the fixed pricing strategy to the TOU electricity market pricing strategy,the generating cost was decreased by 18.5 percent when economic dispatch was computed,13.5 percent when FP based CEED was reviewed,and 15%when ECED was evaluated using TOU electricity market pricing strategy.This is a crucial conclusion for the economic operation of a grid-connected microgrid system.
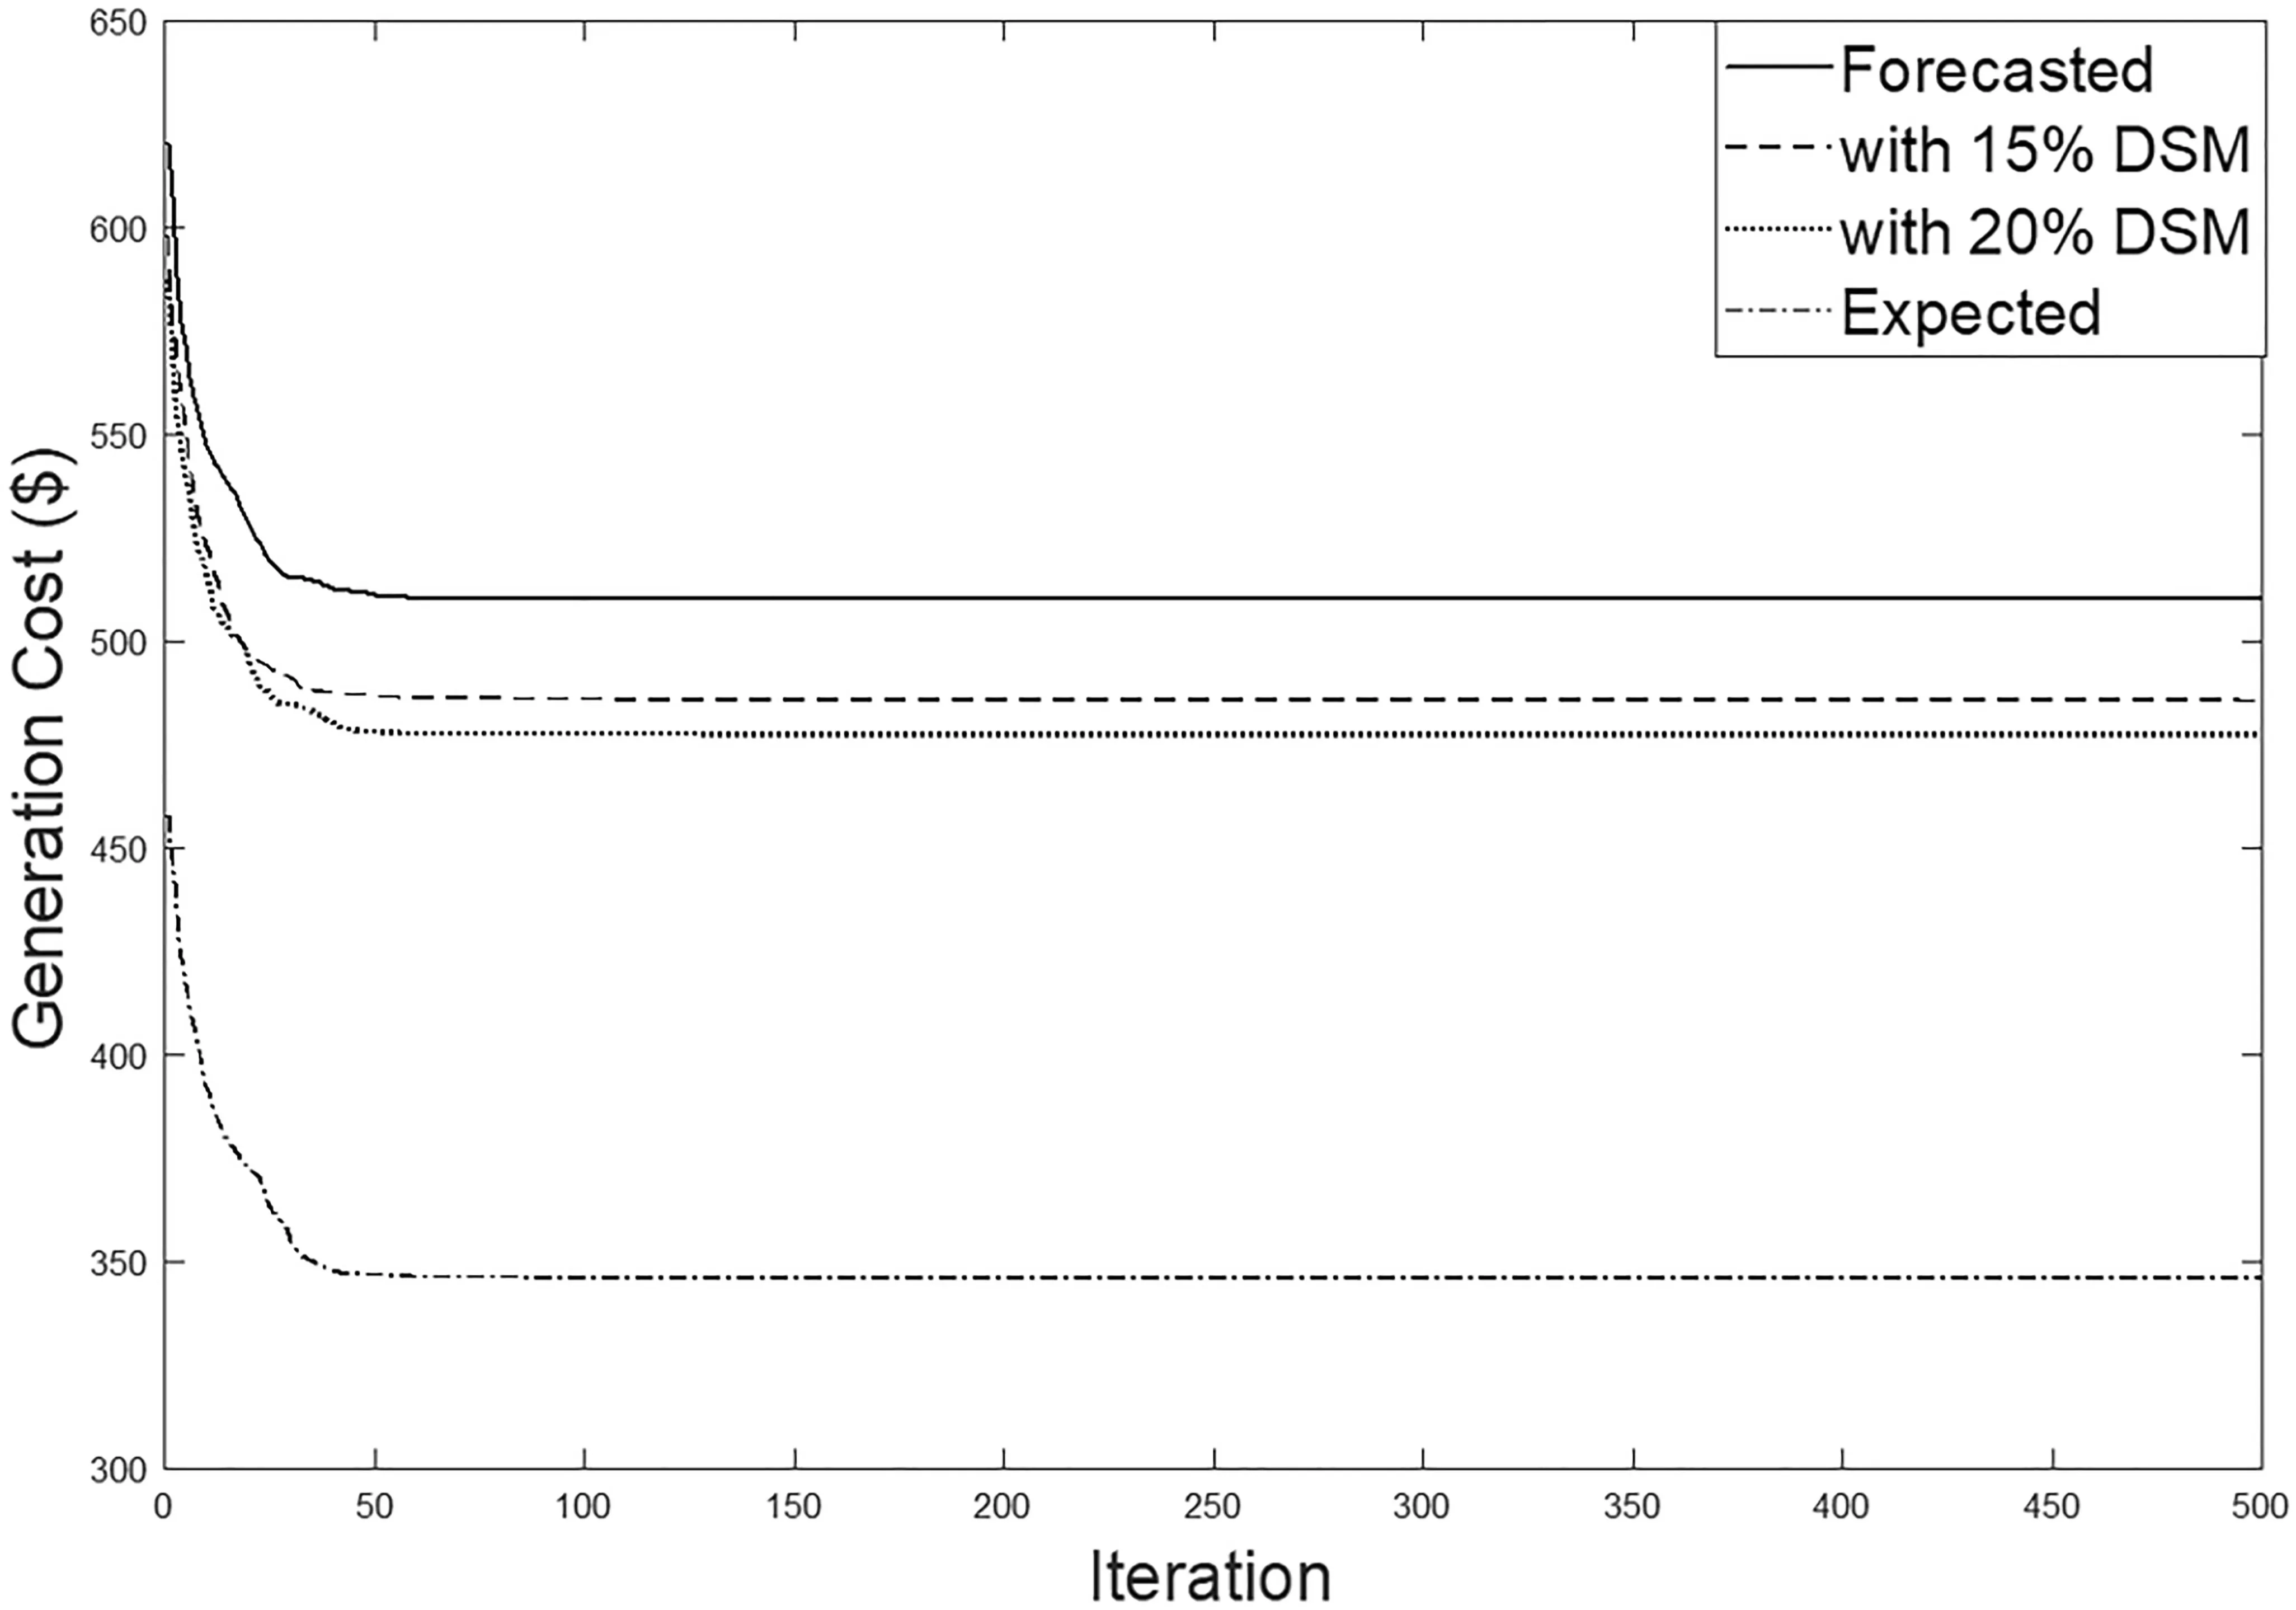
FIGURE 13 Convergence curves when economic dispatch equation was evaluated for various demand side management levels
b.When compared to FP-based CEED,it was found that ECED provides a better trade-off between minimum values of the operating cost and pollutant emission of the system.
c.DSM-based scheduling of DERs have shown a considerable decrement in the generation cost of the microgrid system for both ECD and ECED objectives.This can also lead to the fact that ECED with TOU electricity market pricing strategy and DSM-based load demand restructuring is the best and convenient method for obtaining a balanced compromised solution between generation cost and emission.
d.The minimum values of algorithm execution time and standard deviation corroborates to the superiority and robustness of the proposed hybrid MGWOSCACSA algorithm.
To broaden the horizon of research as a scope of future work involvement of energy storage systems and practical constraints like effects for valve points and ramp rates of the fossil fuelled units can be considered for making the problem more complex.
CONFLICT OF INTEREST
No.
DATA AVAILABILITY STATEMENT
The data that support the findings of this study are available from the corresponding author upon reasonable request.
ORCID
Bishwajit Deyhttps://orcid.org/0000-0001-9761-9480
 CAAI Transactions on Intelligence Technology2022年2期
- CAAI Transactions on Intelligence Technology的其它文章
- A comprehensive review on deep learning approaches in wind forecasting applications
- Bayesian estimation‐based sentiment word embedding model for sentiment analysis
- Multi‐gradient‐direction based deep learning model for arecanut disease identification
- Target‐driven visual navigation in indoor scenes using reinforcement learning and imitation learning
- A novel algorithm for distance measurement using stereo camera
- Learning discriminative representation with global and fine‐grained features for cross‐view gait recognition