
Feature extraction of partial discharge in low‐temperature composite insulation based on VMD‐MSE‐IF
2022-05-28 15:17XiChenXiaoShaoXinPanGaochaoLuoMaoqiangBiTianyanJiangKangWei
Xi Chen |Xiao Shao|Xin Pan|Gaochao Luo|Maoqiang Bi|Tianyan Jiang|Kang Wei
1School of Electrical and Electronic Engineering,Chongqing University of Technology,Chongqing,China
2Chongqing Wanzhou District Municipal Facilities Maintenance and Management Center,Chongqing,China
3Meta Platforms Inc,Menlo Park,California,USA
Abstract Low-temperature composite insulation is commonly applied in high-temperature superconducting apparatus while partial discharge (PD) is found to be an important indicator to reveal insulation statues.In order to extract feature parameters of PD signals more effectively,a method combined variational mode decomposition with multi-scale entropy and image feature is proposed.Based on the simulated test platform,original and noisy signals of three typical PD defects were obtained and decomposed.Accordingly,relative moments and grayscale co-occurrence matrix were employed for feature extraction by Kmodal component diagram.Afterwards,new PD feature vectors were obtained by dimension reduction.Finally,effectiveness of different feature extraction methods was evaluated by pattern recognition based on support vector machine and K-nearest neighbour.Result shows that the proposed feature extraction method has a higher recognition rate by comparison and is robust in processing noisy signals.
KEYWORDS feature extraction,pattern recognition
1|INTRODUCTION
High-temperature superconducting (HTS) power transmission technology has advantages of large capacity,low loss,small size,light weight,and high system reliability.It is expected to play an important role in the development of future grids.According to the latest research and pilot project,insulation material immersed in liquid nitrogen is commonly applied as the primary insulation of HTS cables.Profound research has been reported that partial discharges (PDs) may occur when consistent electric stress applied on low temperature composite insulation.Kwon has found that PPLP’s breakdown voltage and dielectric constant would increase under low temperature,while the dielectric loss and conductivity decrease [1].Surface flashover phenomenon could be found when the superconducting material is in quench with a large current flow [2].Gerhold et al.[3] pointed out that common causes of PD in low-temperature solid insulation are cracks,micro voids or impurities.Since low temperature environment would inhibit the growth of electrical tree branches,it could increase breakdown voltage of composite insulating materials.Compared to traditional oil-paper insulation,few studies report experimental and theoretical research on the developmental characteristics of PD in liquid nitrogen.Since PD development would be influenced by such factors as AC loss,regional temperature change and quench characteristic,it requires more investigations on the PD characteristics under low temperature.Accurate diagnosis of PD fault would be of great significance to the risk assessment of PD in the superconducting system.
According to the long-term study,PD was proved to be an effective indicator of internal insulation statue in conventional power apparatus and it was suggested as an important tool in the technical standard of IEC60270 [4].By a standard diagnostic procedure of measuring,feature extraction and pattern recognition of PD signals,different degrees of damage to insulating materials would be revealed based on the result of PD type and stage [5-9].Among all the steps,feature extraction is critical to the accuracy of diagnosis due to the randomness and impalpability of PD signals.Therefore,PD characteristics should be further investigated and extracted features should be carefully examined,especially under the low-temperature environment.
Various PD feature parameters for traditional power apparatus were proposed in literature,which include statistical operators [10],Q‐φ‐nspectrum [11],Weibull parameters[12,13],image features [14],time domain and frequency domain features [15],wavelet domain features [16,17],etc.However,any method above in signal processing may lose key information,which is fatal for feature extraction considering the randomness of PD.Recently,decomposition iteration algorithms were introduced to feature extraction.An algorithm combined variational mode decomposition (VMD) with Wigner-Ville distribution (WVD) was employed in the decomposition and feature extraction of PD [18].Also,the VMD-Hilbert transform was proposed to extract PD features[19].Moreover,the empirical mode decomposition (EMD)method was also employed in processing PD signals[20].This study states that details could be better described by decomposition,which is suitable for discovering PD features.Although decomposition iteration algorithms such as VMD and EMD are useful in analysing PD signals in a smaller scale,it makes feature extraction process of PD more complicated.Key to the problem is to extract more representative and effective features.Given WVD has an intrinsic drawback of cross-term and self-disturbance [21] and lack of physical meaning,multi-scale entropy(MSE)and image feature(IF)are further investigated after decomposition in this research.Shape and texture features based on IF could clearly describe instant and accumulated energy of PDs while MSE has advantages of expressing the randomness of PDs.
The paper is organised into three parts:(1) Background and experimental basis.It includes standard PD diagnostic procedure introduction and signal acquisition based on PD test,which is for the overall understanding and data credibility;(2) Feature extraction method based on VMD-MSE-IF.This part is the core content,which discusses the principle,procedure and analysis of the proposed method in detail;(3)Effectiveness evaluation by pattern recognition.Two classical recognisers,binary tree support vector machine(BT-SVM)and weighted K-nearest neighbour (KNN),based on different principle were employed in the evaluation of the proposed feature extraction method.
2|BACKGROUND AND EXPERIMENTAL BASIS
2.1|Standard PD diagnostic procedure
Known as a common defect,PD development is always accompanied with insulation degradation.Therefore,PD is suggested to be a useful tool in the condition monitoring and maintenance of high voltage apparatus.Standard PD diagnostic procedure mainly contains three steps:measuring,feature extraction and pattern recognition.In practical application,PD measuring always suffers from noise interference.So,it is important to judge the anti-interference ability when conducting research studies in the lab.After measuring,feature extraction is critical and also the hardest part among all the steps,which is vulnerable due to the randomness and impalpability of PD characteristics,especially under the low-temperature environment.This work is presented in detail in Section 3.Finally,as extracted features are the input,pattern recogniser acts as a classifier,which provides output of the diagnosis result.This paper does not aim to propose a novel recogniser but two classical recognisers were employed to evaluate the effectiveness and compatibility of the feature extraction method.Flow chart of processing is shown in Figure 1.
2.2|Test scheme
Liquid nitrogen not only plays an important role in cooling the medium,but also acts as a part of composite insulation.In order to simulate the real condition as that in HTS cables,a test platform was designed and manufactured.The container was made of dewar which has a function of heat insulation.The lid of the container was installed with a Poly tetra fluoroethylene(PTFE) sleeve and a pressure relief valve.
The PD test circuit was arranged according to the pulse current method[22].Power source was supplied by a HRKZT(T)-200 kV/250 mA test transformer.A digital oscilloscope(TDS5052B) was used to sample PD signals with the sample frequency being 12.5 MHz.Experimental circuit of the PD test is shown in Figure 2.
According to standard IEC61294,the applied voltage value when the PD amplitude firstly exceeds 100pC is defined as the PD inception voltage (PDIV).In the test,the withstand voltage was set to 1.5 times PDIV [23] and PD signals were sampled 60 min later.
2.3|Test sample preparation
Polypropylene laminated paper(PPLP)was selected for sample preparation in this test.The size of each sample is 80 mm in diameter and 2 mm in thickness.In order to keep in consistency between actual insulation defects of conventional power cables and laboratory PD defect models [24],in accordance with CIGRÉ Method II and ASTM D149-09,three typical defect models were made,namely surface discharge,cavity discharge,suspended discharge.The exact structure and size of defect models are illustrated in Figure 3.
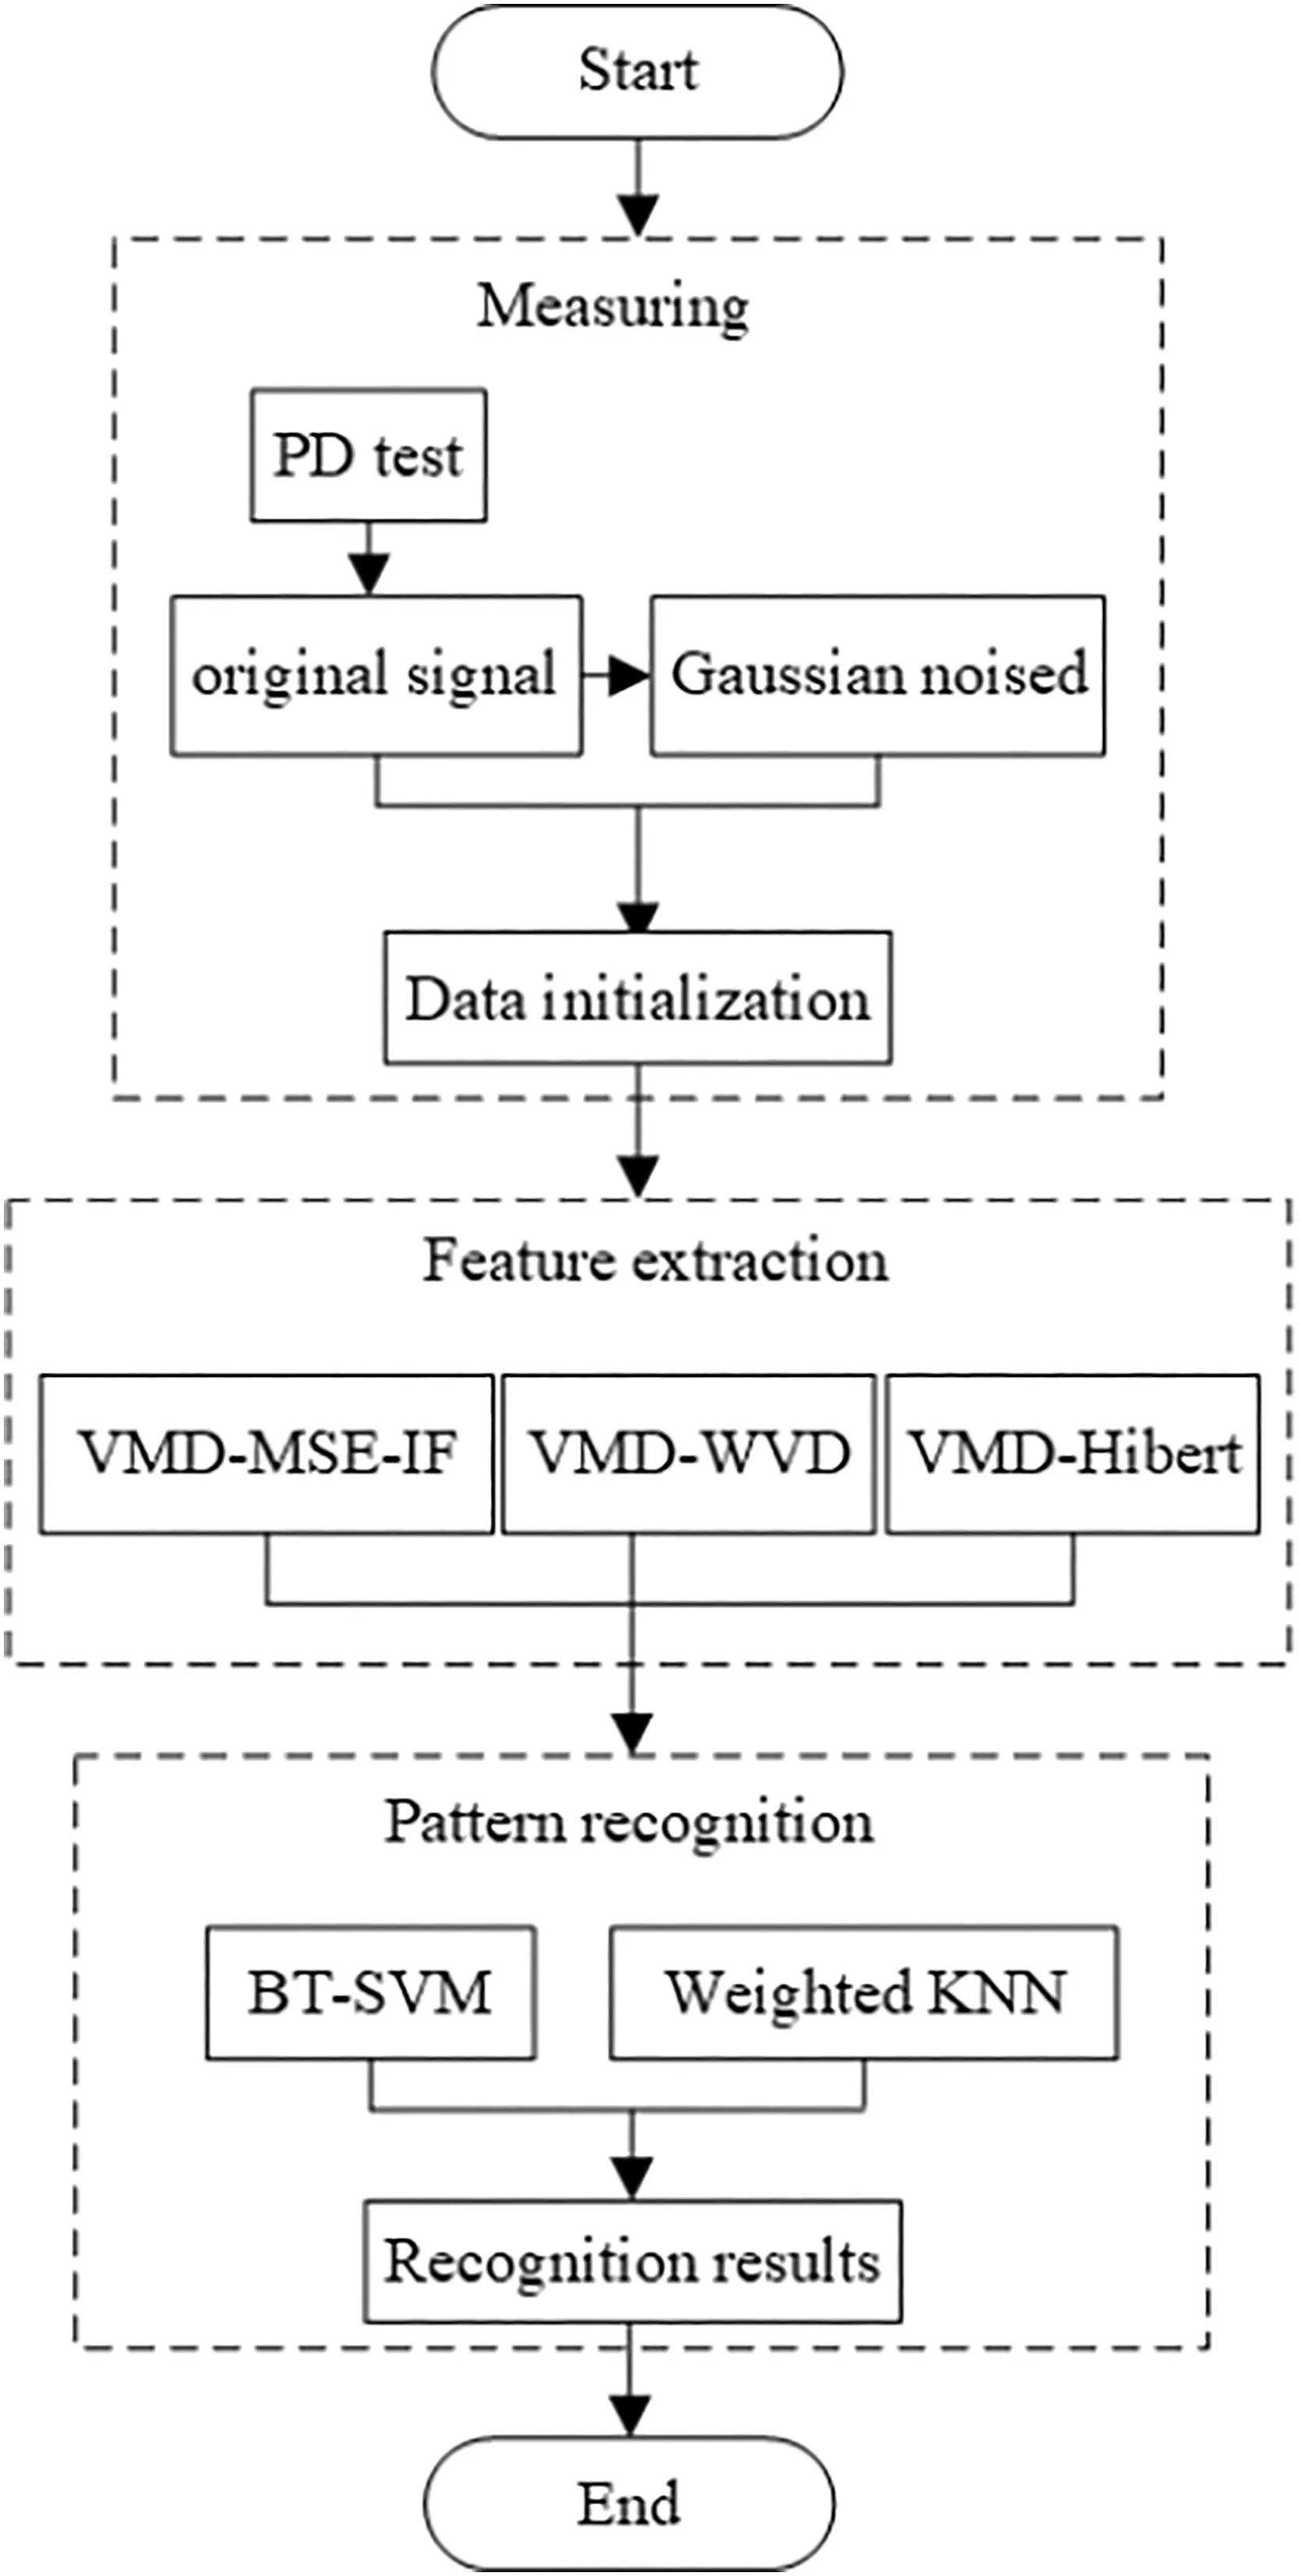
FIGURE 1 Whole flow chart of partial discharge analysis procedure
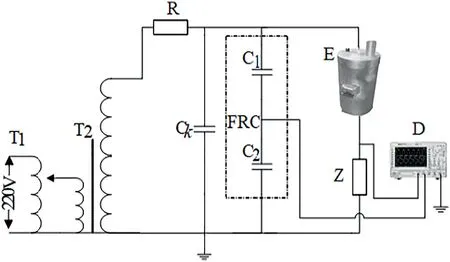
FIGURE 2 Experimental circuit of partial discharge.T1—Regulator;T2—Testing transformer;R—Protective resistance;Ck—Coupling capacitance;FRC—Voltage divider;D—Digital oscilloscope;Z—Detection impedance;E—Constant temperature equipment
The plate and cylinder electrodes were made of copper,and they were well polished.All test samples were dried for 24 h before the PD test.
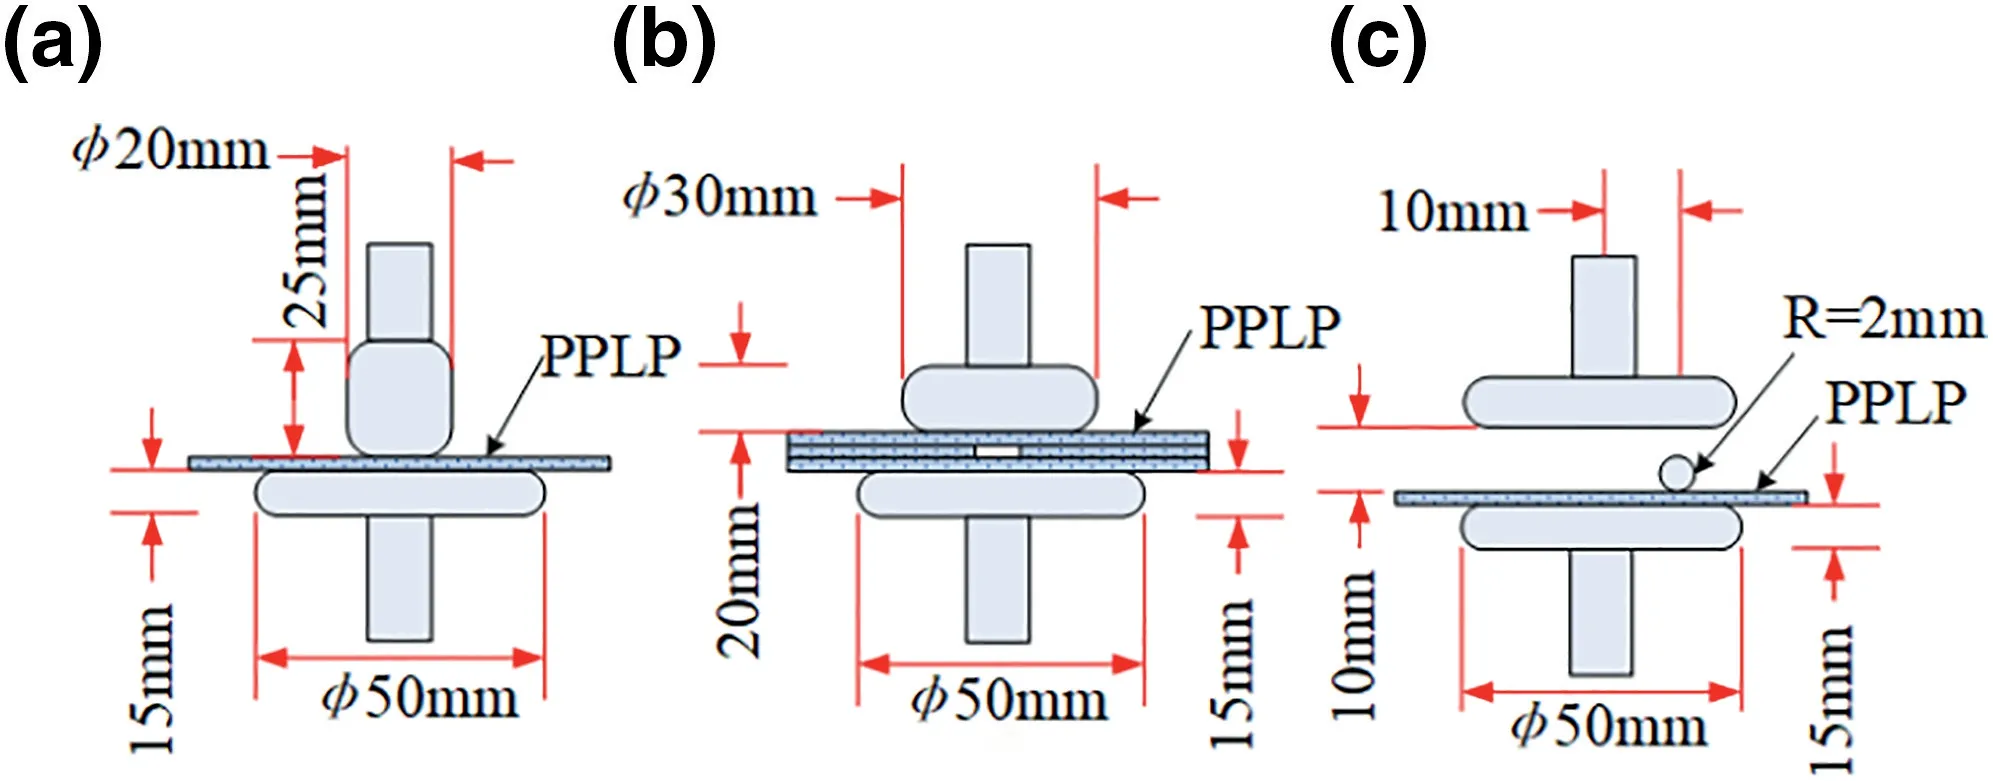
FIGURE 3 Typical partial discharge models.(a) surface discharge,(b) cavity discharge,(c) suspended discharge
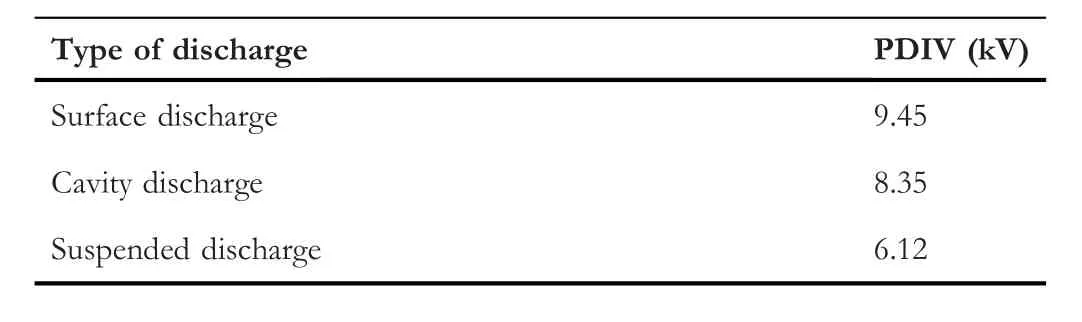
TABLE 1 PD inception voltage (PDIV) of three defects
2.4|Analysis of test results
By carrying out 10 repetitive PD tests,the average PDIV value of each defect was recorded,as shown in Table 1.
In the experiment,it can be observed that PD amplitudes and repetition rates were relatively small in the early stage.With discharge phase grew wider,pulse amplitude and repetition rate increased as well,especially in the later stage.However,cumulative effect [25] and randomness appeared in the PD development.Original sampled discharge waveforms of different PD types are shown in Figure 4a,c,e.
In practice,original PD signals were always interfered by environmental noise.It may cause noise overlaps in the original signal,and important information may be hidden or inaccurate.Therefore,it is significant to investigate the antiinterference ability of the way in dealing with PD signals.Therefore,artificial white noise was added to simulate the practical PD signal.According to IEC 60270,the background noise level should be less than half of PD amplitude.Noise added PD waveforms with SNR=10 dB are shown in Figure 4b,d,f.It can be seen that Gaussian white noise would distort the waveforms of PD signals to some extent and information were hidden in the noised waveform.This is similar to the practical case.
Phaseφwas divided into 256 statistical intervals in a period.100 groups of repetition rate,apparent quantity and phase distribution of PD were recorded.Q‐φ‐nspectrum of each PD type is drawn as Figure 5.
In Figure 5,it is shown that each PD type has a distinctive characteristic.The phase of surface discharge is 45° beyond that of cavity discharge,which is mainly distributed between 0°-80° and 180°-260°.Compared to the phase distribution of surface discharge,the phase of suspended discharge is 45° earlier,which is mainly distributed widely in 0°-20°,160°-250°,330°-360°,although PD amplitude is relatively small.
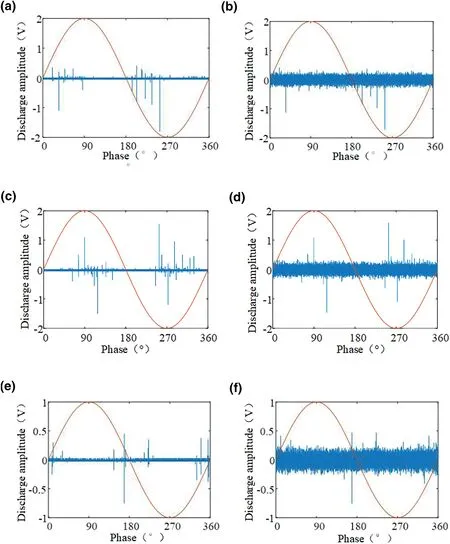
FIGURE 4 Partial discharge waveform.(a) surface discharge,(b) noised surface discharge,(c) cavity discharge,(d) noised cavity discharge,(e) suspended discharge,(f) noise waveform of suspended discharge
On comparison with the PD waveform of cross-linked polyethylene (XLPE) cable [16],it is found that PD development in low-temperature composite insulation has a similar trend to that in XLPE cases.However,due to different materials,environment and relative dielectric constant in electrode and insulation,PD amplitude and phase distribution are different [26].
3|PD FEATURE EXTRACTION BASED ON VMD‐MSE‐IF
3.1|Decomposition by VMD
VMD is a popular signal processing method in recent years.As an adaptive signal decomposition approach,VMD is commonly applied in solving the problem of constrained variational mode.The multi-component signal was adaptively decomposed by frequency segmentation,and expressed in the form of band limited intrinsic mode function (BLIMF) to realise the frequency separation of each signal component[27].Compared with wavelet analysis,the advantage of VMD is that it does not need to select the wavelet basis function and it is more adaptive.In addition,VMD is helpful in overcoming the problems of mode mixing and endpoint effect,which is the disadvantage of EMD.Furthermore,it has a more complete mathematical theoretical basis,which would reduce the non-stationarity of signals with high complexity and strong nonlinearity.
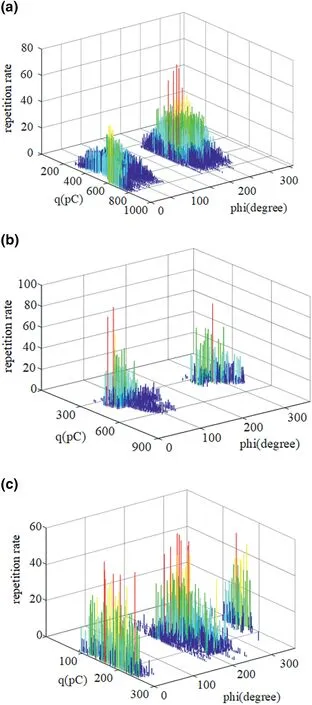
FIGURE 5 Q-φ-n three-dimensional graphs atlas.(a) surface discharge,(b) cavity discharge,(c) suspended discharge
It aims to decompose a real-valued input signalf(t) into a set of sub-signals or modal components.In other words,we assume that each modekis mostly compact around the centre pulsationwk,which is determined by decomposition [28].Therefore,the VMD process can be understood as establishing and solving a constrained variational problem described by Equation (1):
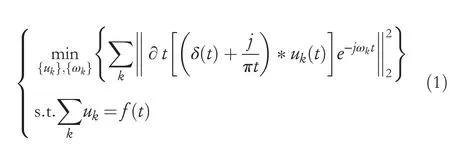
whereukrepresents the decomposed modal component;ωkmeans the centre frequency of each modal component;δ(t) represents the Dirac distribution;mark * represents convolution calculation;jis the imaginary unit;f(t) represents the signal to be decomposed.
In order to solve the constrained variational problem,the penalty coefficientαand the Lagrangian multiplierλare introduced to make the variational problem unconstrained and the optimal solution of the above variational model is obtained.αis useful in enhancing the accuracy of the reconstructed signal due to its good convergence,andλis useful in meeting the requirement the of strictly constraint.Therefore,the constrained variational problem is transformed into an unconstrained variational problem,which constitutes an augmented Lagrangian expression,as shown in Equation (2).
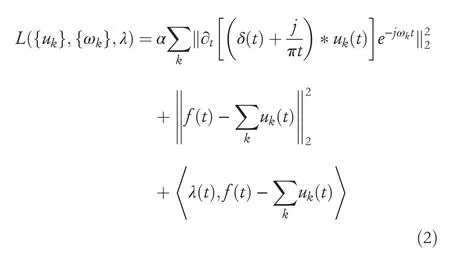
The alternate direction method of multipliers (ADMM)algorithm is used to solve the saddle point of formula (2)corresponding to formula (1) [29],and the saddle point of augmented Lagrange functionLis obtained,which is the optimal solution of thevariational constraint model.
VMD implementation steps are as follows:
(1) Initialise the modal componentsthe corresponding centre frequency and the Lagrangian multiplierThen the value is set to 0;
(2) Set theKvalue of the decomposition mode number;
(3)ukandwkare updated by Equations (3) and (4);
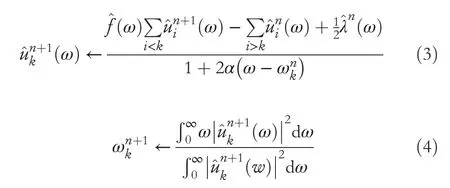
(4) The Lagrange multiplier updates according to Equation(5);
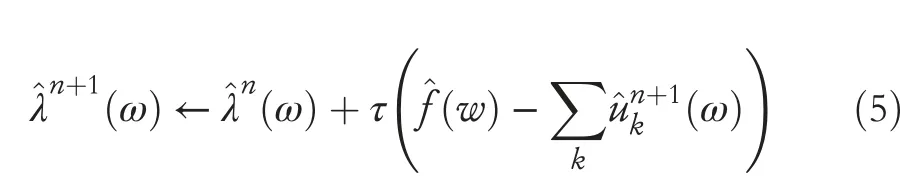
whereτis the noise tolerance.
(5) Continuous iterative operation is conducted to step (3)until the condition is met as shown in formula (6),then output the result.
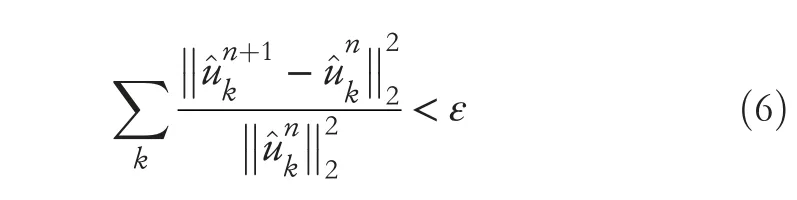
whereεis the tolerance of convergence judgement?
3.2|IF and MSE features
Accumulated energy and consistent impact of PD has strong correlation with the degradation degree of insulation,which can be expressed by image features.Since MSE is always used to measure the complexity of system time series by using the probability of generating new templates from system time series,it is suitable to describe randomness of PD occurrence.As a result,an ideal combined IF with MSE features is presented to describe the PD behaviour in this article.
3.2.1|Image shape features
Hu invariant moments and relative moments can effectively describe the shape features of the area surrounded by the image.It is widely used in pattern recognition and image matching[30].
Assuming that in the case of continuous regions,when the image function isf(x,y),thep+qmoment of the image can be expressed as
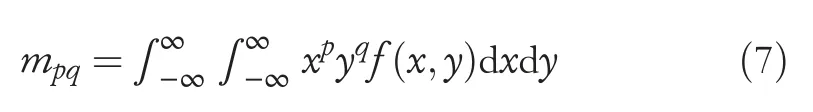
where,p,q=0,1,2…n;(x,y) represents the image position coordinate;f(x,y) represents the grey value of the image at point (x,y).
mpqis varied with the translation of the image change.In order to obtain the translation invariance ofmpq,the central moment of orderp+qis defined as
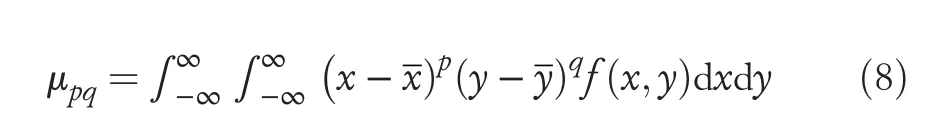
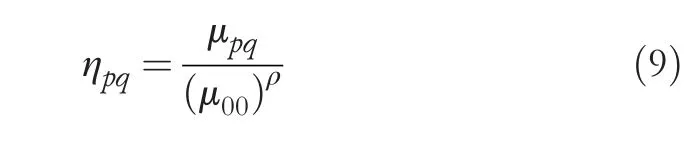
whereμ00is the scale factor,ρ=p+q+1;
The second-order and third-order central moments are combined to construct 7 moment features,which are
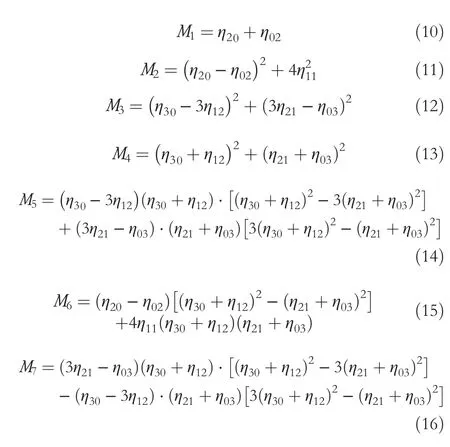
The above seven moment features are outputs as the shape feature values of the image.Moment invariants have the invariance of displacement,size and shape,and they are suitable for describing the shape of the target.
3.2.2|Image texture feature
In this paper,the grey level co-occurrence matrix (GLCM) is employed to extract the image texture feature.It can effectively reflect comprehensive information of the image grey level on the local correlation,texture thickness,and degree of change.The following image texture features are selected [31].
(1) Energy
Energy represents the sum of squares of all elements of GLCM.
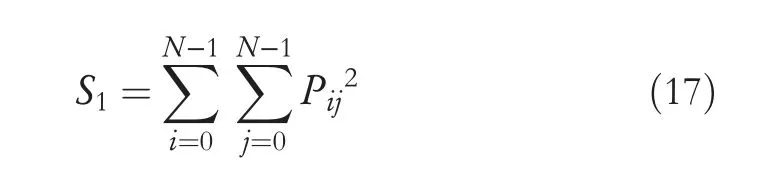
whereNis the grey level that reflects the energy contained in the texture image.A larger energy value indicates a more uniform texture and a more regular variation.
(2) Entropy
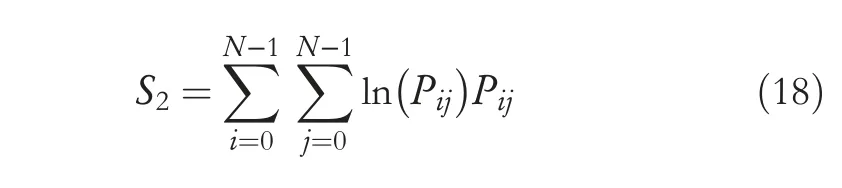
This value mainly reflects the randomness of texture image information.
(3) Moment of inertia
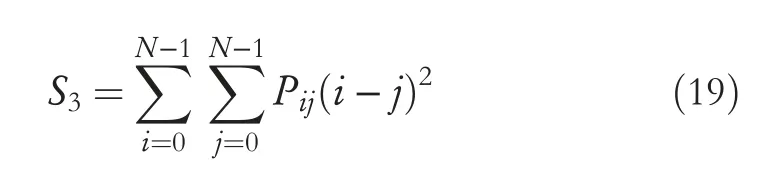
This value reflects the sharpness of the image and the depth of texture grooves.The larger theS3,the deeper the texture grooves and the clearer the visual effect.
(4) Correlation
Correlation is defined as the similarity degree of GLCM elements in rows or columns,which represents the correlation of local grayscales in the image.
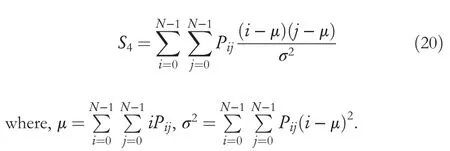
The average values of energy,entropy,moment of inertia,and correlation are output as features,and there are a total of four texture feature values.
3.2.3|Multi-scale entropy
As the principle and steps of the multi-scale entropy (MSE)theory are introduced in reference [32],eigenvalues of modal components were obtained.Steps for solving MSE are as follows:
(1) Initial value setting.Set embedding dimensionm;similarity tolerancerand scale factorτ.
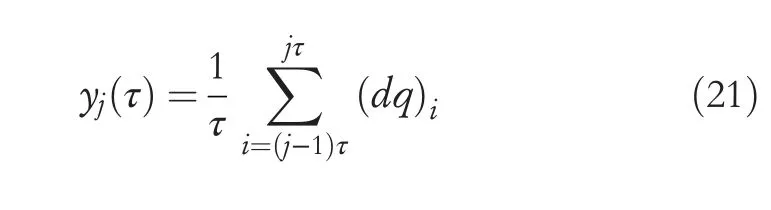
(2) Coarse graining treatment.
(3) Solving sample entropy of coarse-grained vector sequence.
(1) Transform the original sequence intom-dimensional vector,as shown in Equation (22).
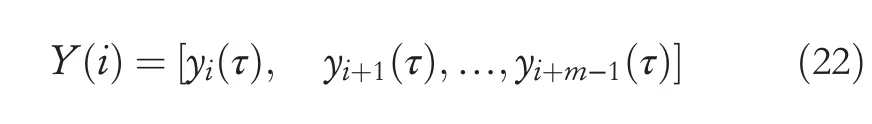
(2) The distance betweenY(i) andY(j) is

where 1 ≤j≤N-m,j≠i.
(3) According to the initial value setting,solveBm i(r)value and express the average value asBm(r)
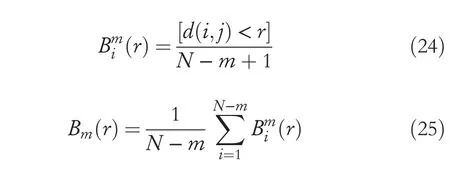
(4) Increasing the embedding dimensionm,repeat steps 3.2.3 Section (1)-(3) to getBm+1(r).
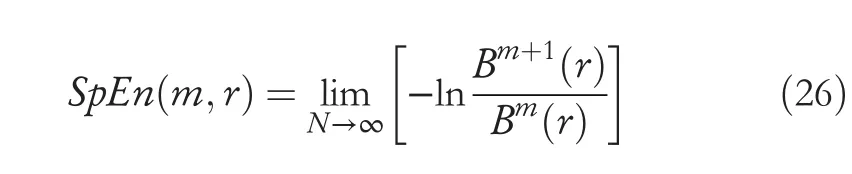
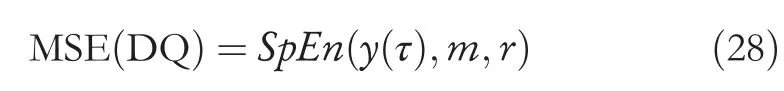
(5) The sample entropy of the sequence is expressed as
WhenNis a finite value,the value ofSpEnis
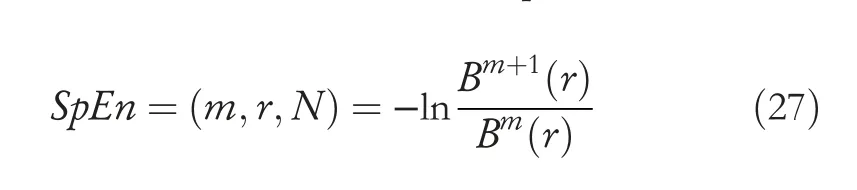
The MSE value can be obtained by calculating theSpEnof each scale sequence.
When solving the MSE value,parameters are set as follows:embedding dimensionm=2;the similarity tolerancer=0.2x;x is the standard deviation of the time series;and the scale factorτ=10.
3.3|Combined feature extraction based on VMD‐MSE‐IF
By analysis of the decomposition method and features above,a combined feature extraction method based on MSE-IF after decomposition by VMD is introduced in this section.The Hu invariant moments and relative moments,as well as the GLCM were used to extract the shape and texture features of each modal component image.All original and noised data acquired in Section 2 were processed.In order to identify the effectiveness,feature extraction results based on VMD-WVD and VMD-Hilbert were obtained for comparison,according to references[18,19]respectively.In addition,combined features and single features based on MSE-IF decomposed by EMD were also calculated for comparison.EMD,which is regarded as the replacement of VMD,provides another option of modal decomposition.Fundamental basis and processing detail of EMD is provided in reference [20].As a result,whole processing flow chart of feature extraction is shown in Figure 6.
Suppose the PD signalX(t)={x1,x2,…xN},whereNis the length of the signal.From the flow chart,key steps of VMD-MSE-IF are listed as follows:
(1) VMD decomposition of the PD signal is conducted to obtainKintrinsic modal componentsukand the centre frequencyωk.
(2) Calculate multi-scale entropy,texture feature and shape feature.
(3) The extracted multi-scale entropy,texture feature and shape feature eigenvalues constitute the PD feature vector set.
When the PD signal is processed by VMD,it is noticed that a modal component is similar to the central frequency.This phenomenon occurs because of the over decomposition characteristics by VMD.
In order to extract enough information and avoid redundant information,the correlation between the decomposed modal components and the original signal was analysed,and the correlation coefficients between a series of modal components and the original signal were obtained.For example,in a group of cavity discharge cycle waveform,the decomposition layer was 18.The correlation coefficients between the VMD modal components and the original signals is shown in Table 2.
According to the correlation coefficients rule [22],0.30-0.50 is defined as the real correlation,and 0.50-0.80 is defined as the significant correlation.It can be seen that intrinsic mode function IMF1 and IMF2 components are significantly correlated,and IMF3 component is correlated.The frequency components contained in these pseudo components may overlap with the characteristic frequency band,so they should be deleted.The authenticity of the IMF is determined by the correlation coefficients between modal components and the original signal.The larger correlation coefficient between each IMF and the original signal is,the more features of the original signal should be retained.The correlation between the pseudo components and the original signal is relatively small.It can be seen from Table 3 that the correlation coefficients from IMF4 to IMF18 were comparably small,which were judged as pseudo components.
According to analysis above,the modal numberkwas set to 3.Modal components of the original signal after decomposition are shown in Figure 7.
In order to keep consistent with the number of modal components after VMD decomposition,three modal components with the highest correlation coefficients,IMF1,IMF2 and IMF3,were selected to be effective components by EMD.As a result,three groups of modal components decomposed by VMD and EMD were extracted to form a 36-dimensional feature vector.
3.4|Dimension reduction
High dimension features would reduce the efficiency of the recogniser,and the multicollinearity between feature vectors would cause major mistakes.Therefore,kernel principal component analysis (KPCA) was applied to reduce the dimension of features.Radial basis Gaussian kernel was selected to be the kernel function[33].A total of 300 groups of eigenvalues containing six kinds of PD signals extracted by VMD were selected and processed by KPCA dimensionality reduction.The results are shown in Table 3.In this table,λirepresents the feature parameters (i=1,2,3,…).
It can be seen from Table 3 that the contribution rate of the first principal component after KPCA is 54.57%,and the cumulative contribution rate of eight principal component has reached 99.64%.This indicates that new features after KPCA dimension reduction could represent principle information of the original PD feature.Therefore,eight new principal component features after KPCA dimension reduction were chosen to be feature parameters,which could reduce the computational complexity.In the same way,features of six types of PD signals processed by EMD were reduced by KPCA,and a group of the 8-dimensional feature vector was obtained.
4|EFFECTIVENESS COMPARISON OF CLASSIFICATION:BT‐SVM AND WEIGHTED KNN
In order to verify the effectiveness and compatibility of the proposed feature extraction method,two widely used pattern recognisers,BT-SVM and KNN,were used in this article for classification [34-37].
According to the VMD-MSE-IF feature extraction algorithm steps in the above section,original and noised PD signals of three typical defects were decomposed,extracted and dimension reduced,six types of PD feature data sets were obtained,and each PD had 100 sets of data.
Before pattern recognition,in order to distinguish the categories of various PD types,six different types of PD signals were named as follows:the original signal of surface discharge as A1;the noise signal of surface discharge as A2;the original signal of cavity discharge as B1;the noise signal of cavity discharge as B2;the original signal of suspended discharge as C1;the noise signal type of suspended discharge as C2.In each type,70 groups of samples were randomly selected to be the training sample set,and the remaining 30 groups were used for testing.In order to avoid the random mistake by the training samples and the test samples random selection,pattern recognition was carried out for five times repetitively.Recognition time and the arithmetic average recognition rate of the test samples were obtained.The pattern recognition process is shown in Figure 8.
Different recognition algorithms have different principles,which will affect the recognition results.In order to avoid the occasionality,two widely used PD recognisers,BT-SVM and weighted KNN,based on different pattern recognition algorithms were employed to evaluate the efficiency of feature extraction proposed in this work.Principle of each recogniser is introduced briefly as follows:
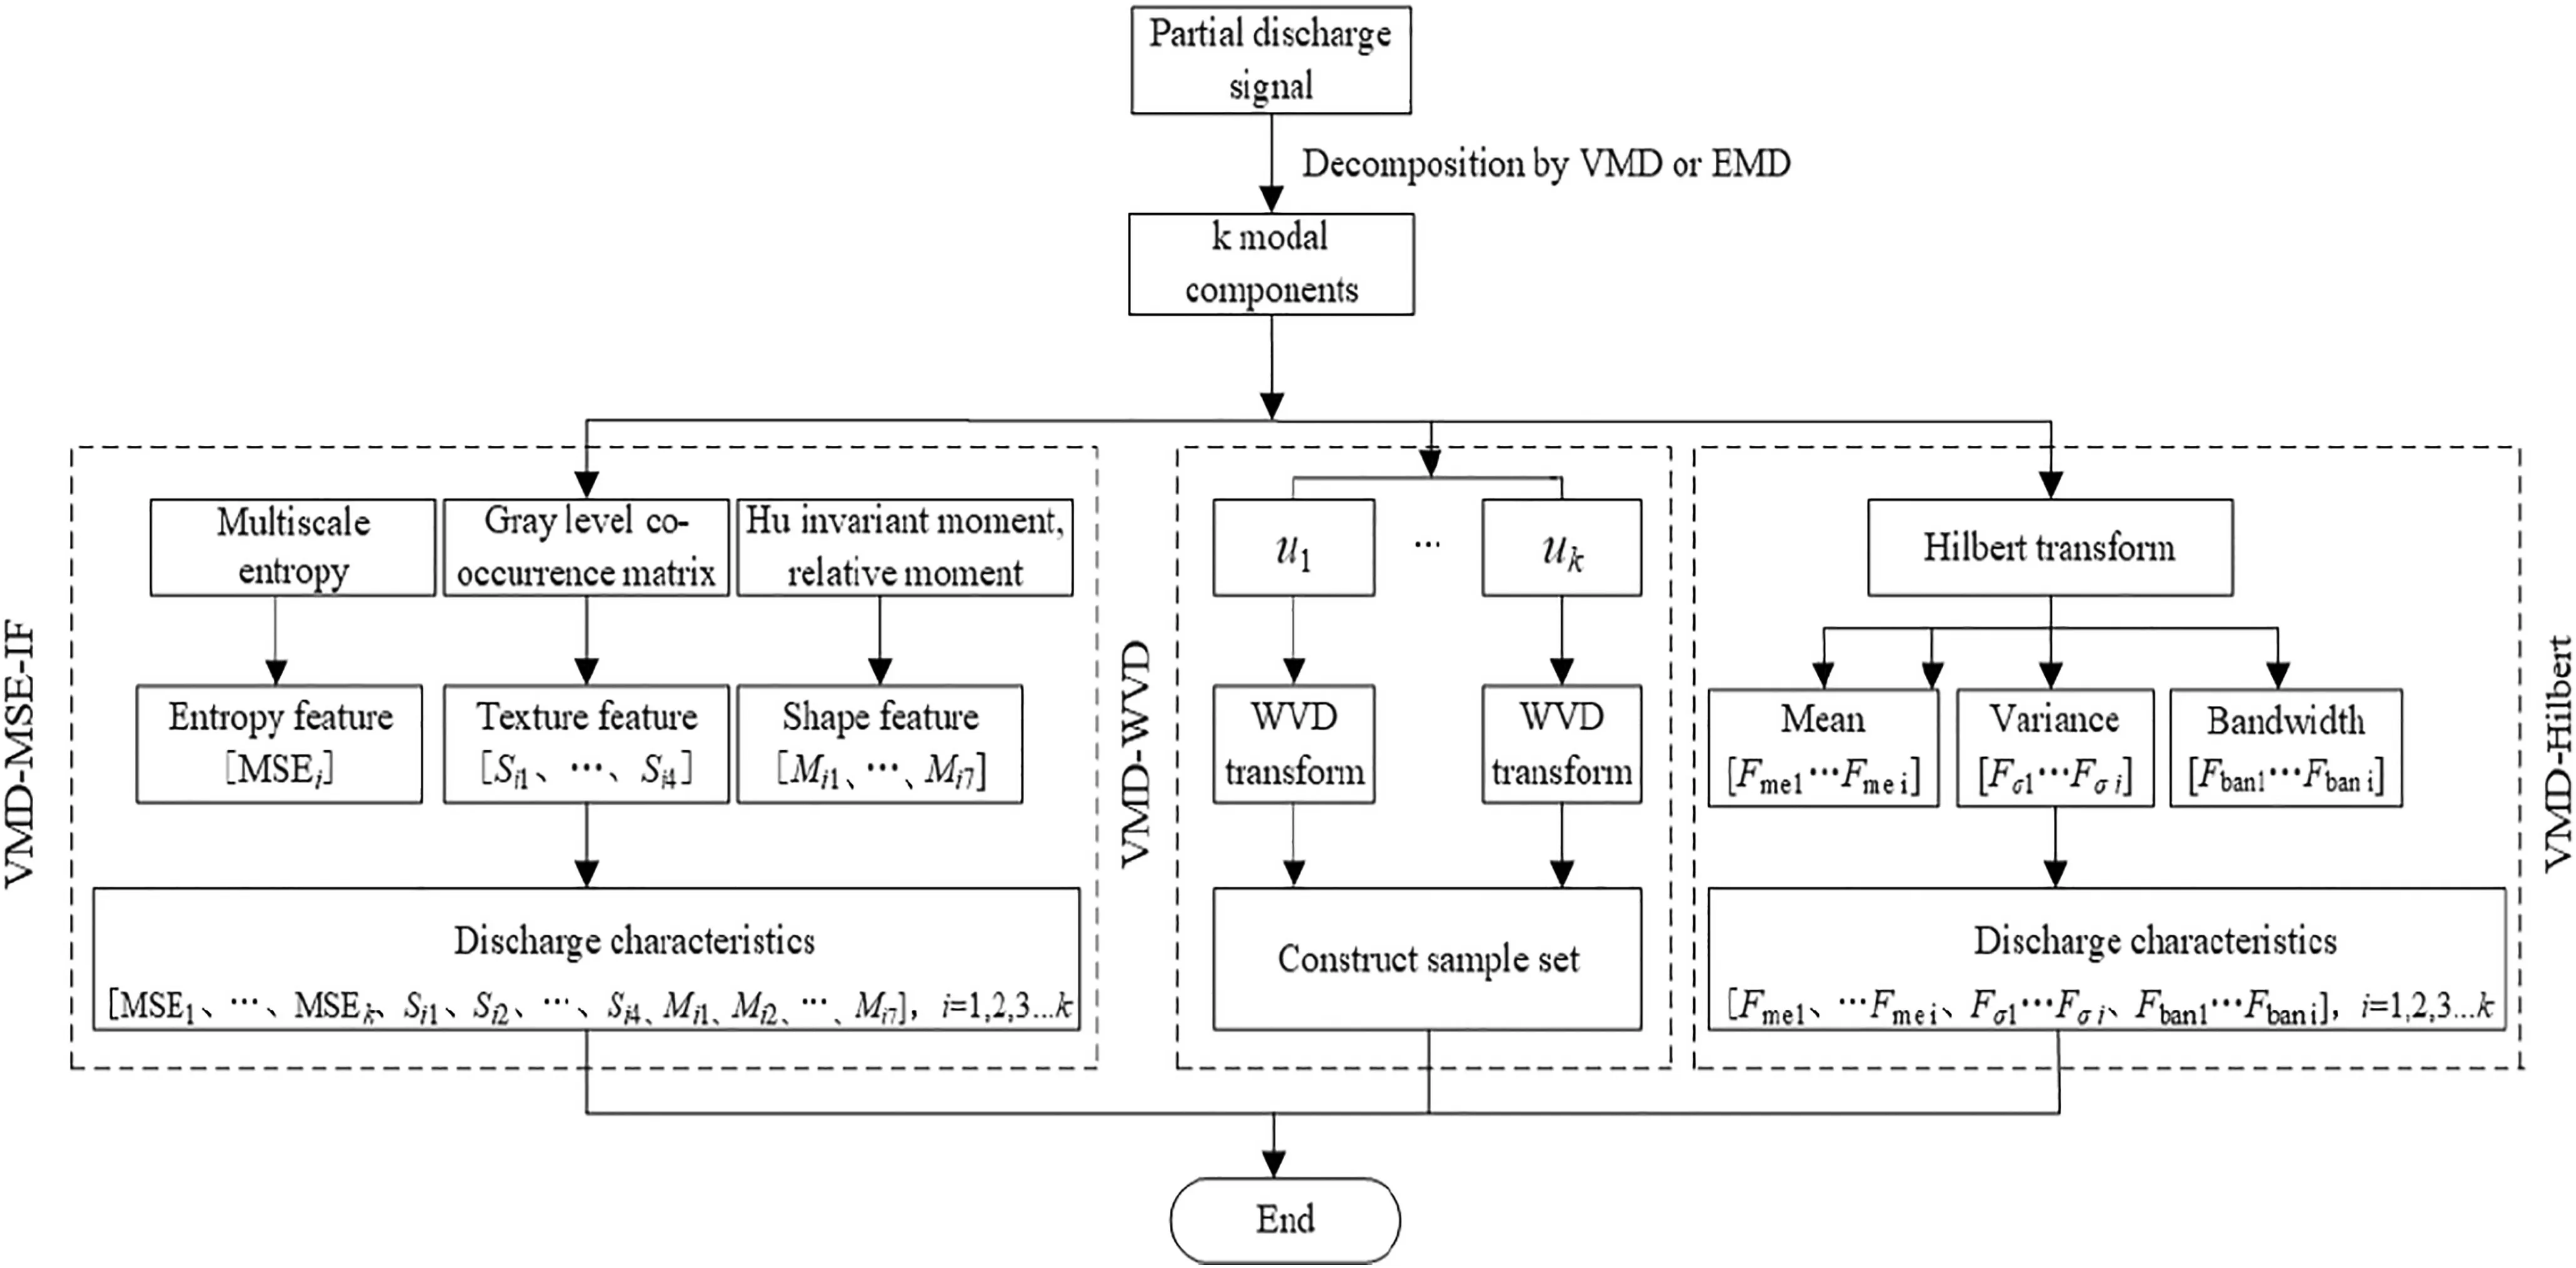
FIGURE 6 Flow chart of feature extraction
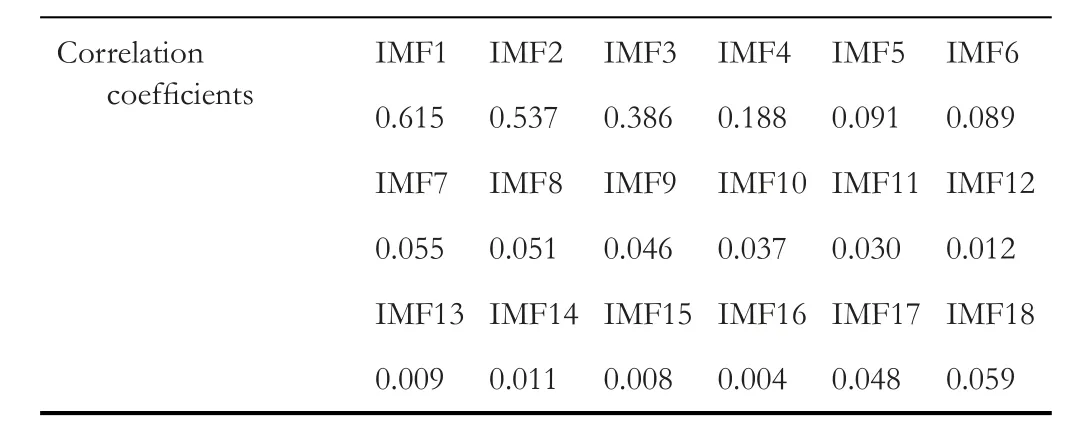
TABLE 2 Correlation coefficients between modal components and original signal
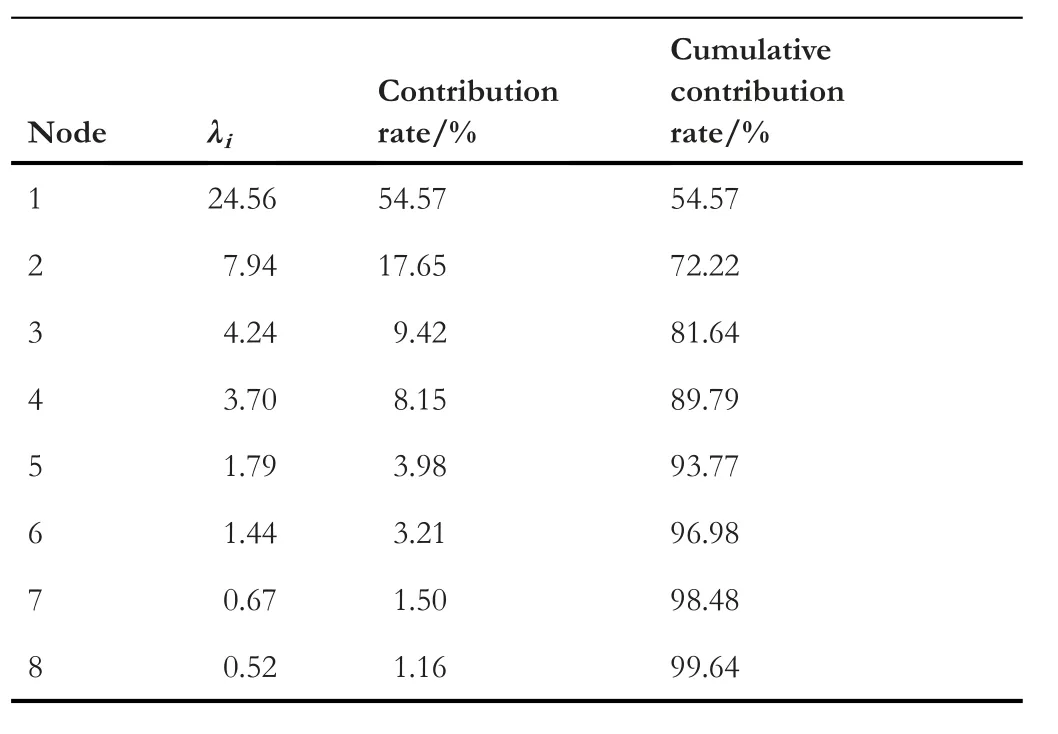
TABLE 3 Kernel principal component analysis (KPCA) treatment results
4.1|Pattern recognition based on BT‐SVM
As a classical classification algorithm,the support vector machine (SVM) has been widely used in many areas.In the multi-classification problems,it is necessary to establish multiple support vector machine sub-classifiers.In this paper,the kernel function BT-SVM was adopted.The kernel function is the Gaussian kernel function (RBF).In accordance with the reference,the RBF kernel parameterσ2was set to 0.0625,and the penalty factorcwas set to 0.92.By this method,it helps in dividing the entire PD sample sets into a large class and a subclass,and then circulates until all categories are separated.
4.2|Pattern recognition based on weighted KNN
The Weighted KNN algorithm structure is relatively simple,and its core idea is to find the most frequent K neighbour markers in the training item for the test itema,and to judge the attributes of the test item based on the attributes of the K neighbour items.The main steps of KNN include similarity measurement and K value setting,both of which will directly affect the final classification result of the algorithm.In this work,Euclidean distance was used to measure similarity,and Gaussian kernel function was added for attribute weighting.As indicated in the reference,the closer the distance,the greater the point weight [38].Cross validation was used to determine the K value,which was set to 8.
4.3|Pattern recognition results and analysis
The simulation test of PD pattern recognition in this article was operated on the 64-bit win10 operating system of FL8000UN ASUS computer(CPUi7-8550u,memory 8G),and all codes were implemented in the Matlab software.Asintroduced in section 3.3,features extracted based on the proposed method and compared method were all obtained and processed by two pattern recognisers mentioned above.The recognition results of BT-SVM and weighted KNN are shown in Tables 4 and 5,respectively.
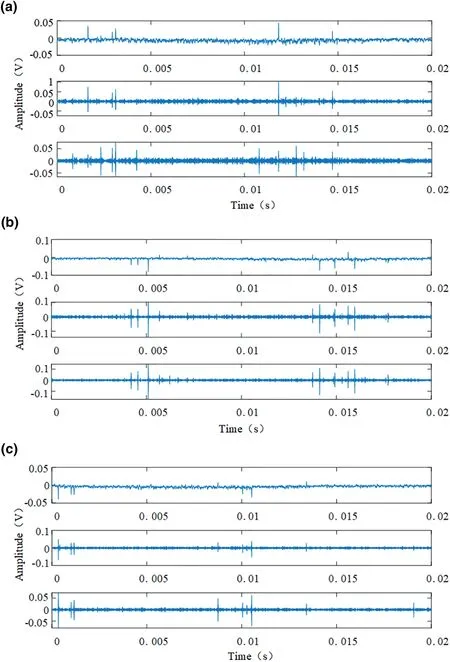
FIGURE 7 Modal components by VMD.(a) surface discharge,(b) cavity discharge,(c) suspended discharge
From Tables 4 and 5,it is clear that the VMD-MSE-IF method is more efficient in both cases.As suggested,when decomposing the original PD signal (A1,B1,C1) and the PD noise signal (A2,B2,C2),the VMD-MSE-IF feature extraction method has the highest recognition rate.Although Hilbert has some advantages in fault diagnosis,it is easy to produce endpoint effects and cause errors.WVD has intrinsic drawback of the cross-term,which reduces recognition accuracy.Given that the efficiency of VMD decomposition is better than EMD decomposition,there is one possible explanation that VMD would change the constraint condition to the non-constraint condition and EMD itself has a problem of modal aliasing that occurs when decomposing noisy PD signals.Besides,introduced secondary penalty factor α and LaGrange operator α enhance the accuracy when dealing with noised signals.
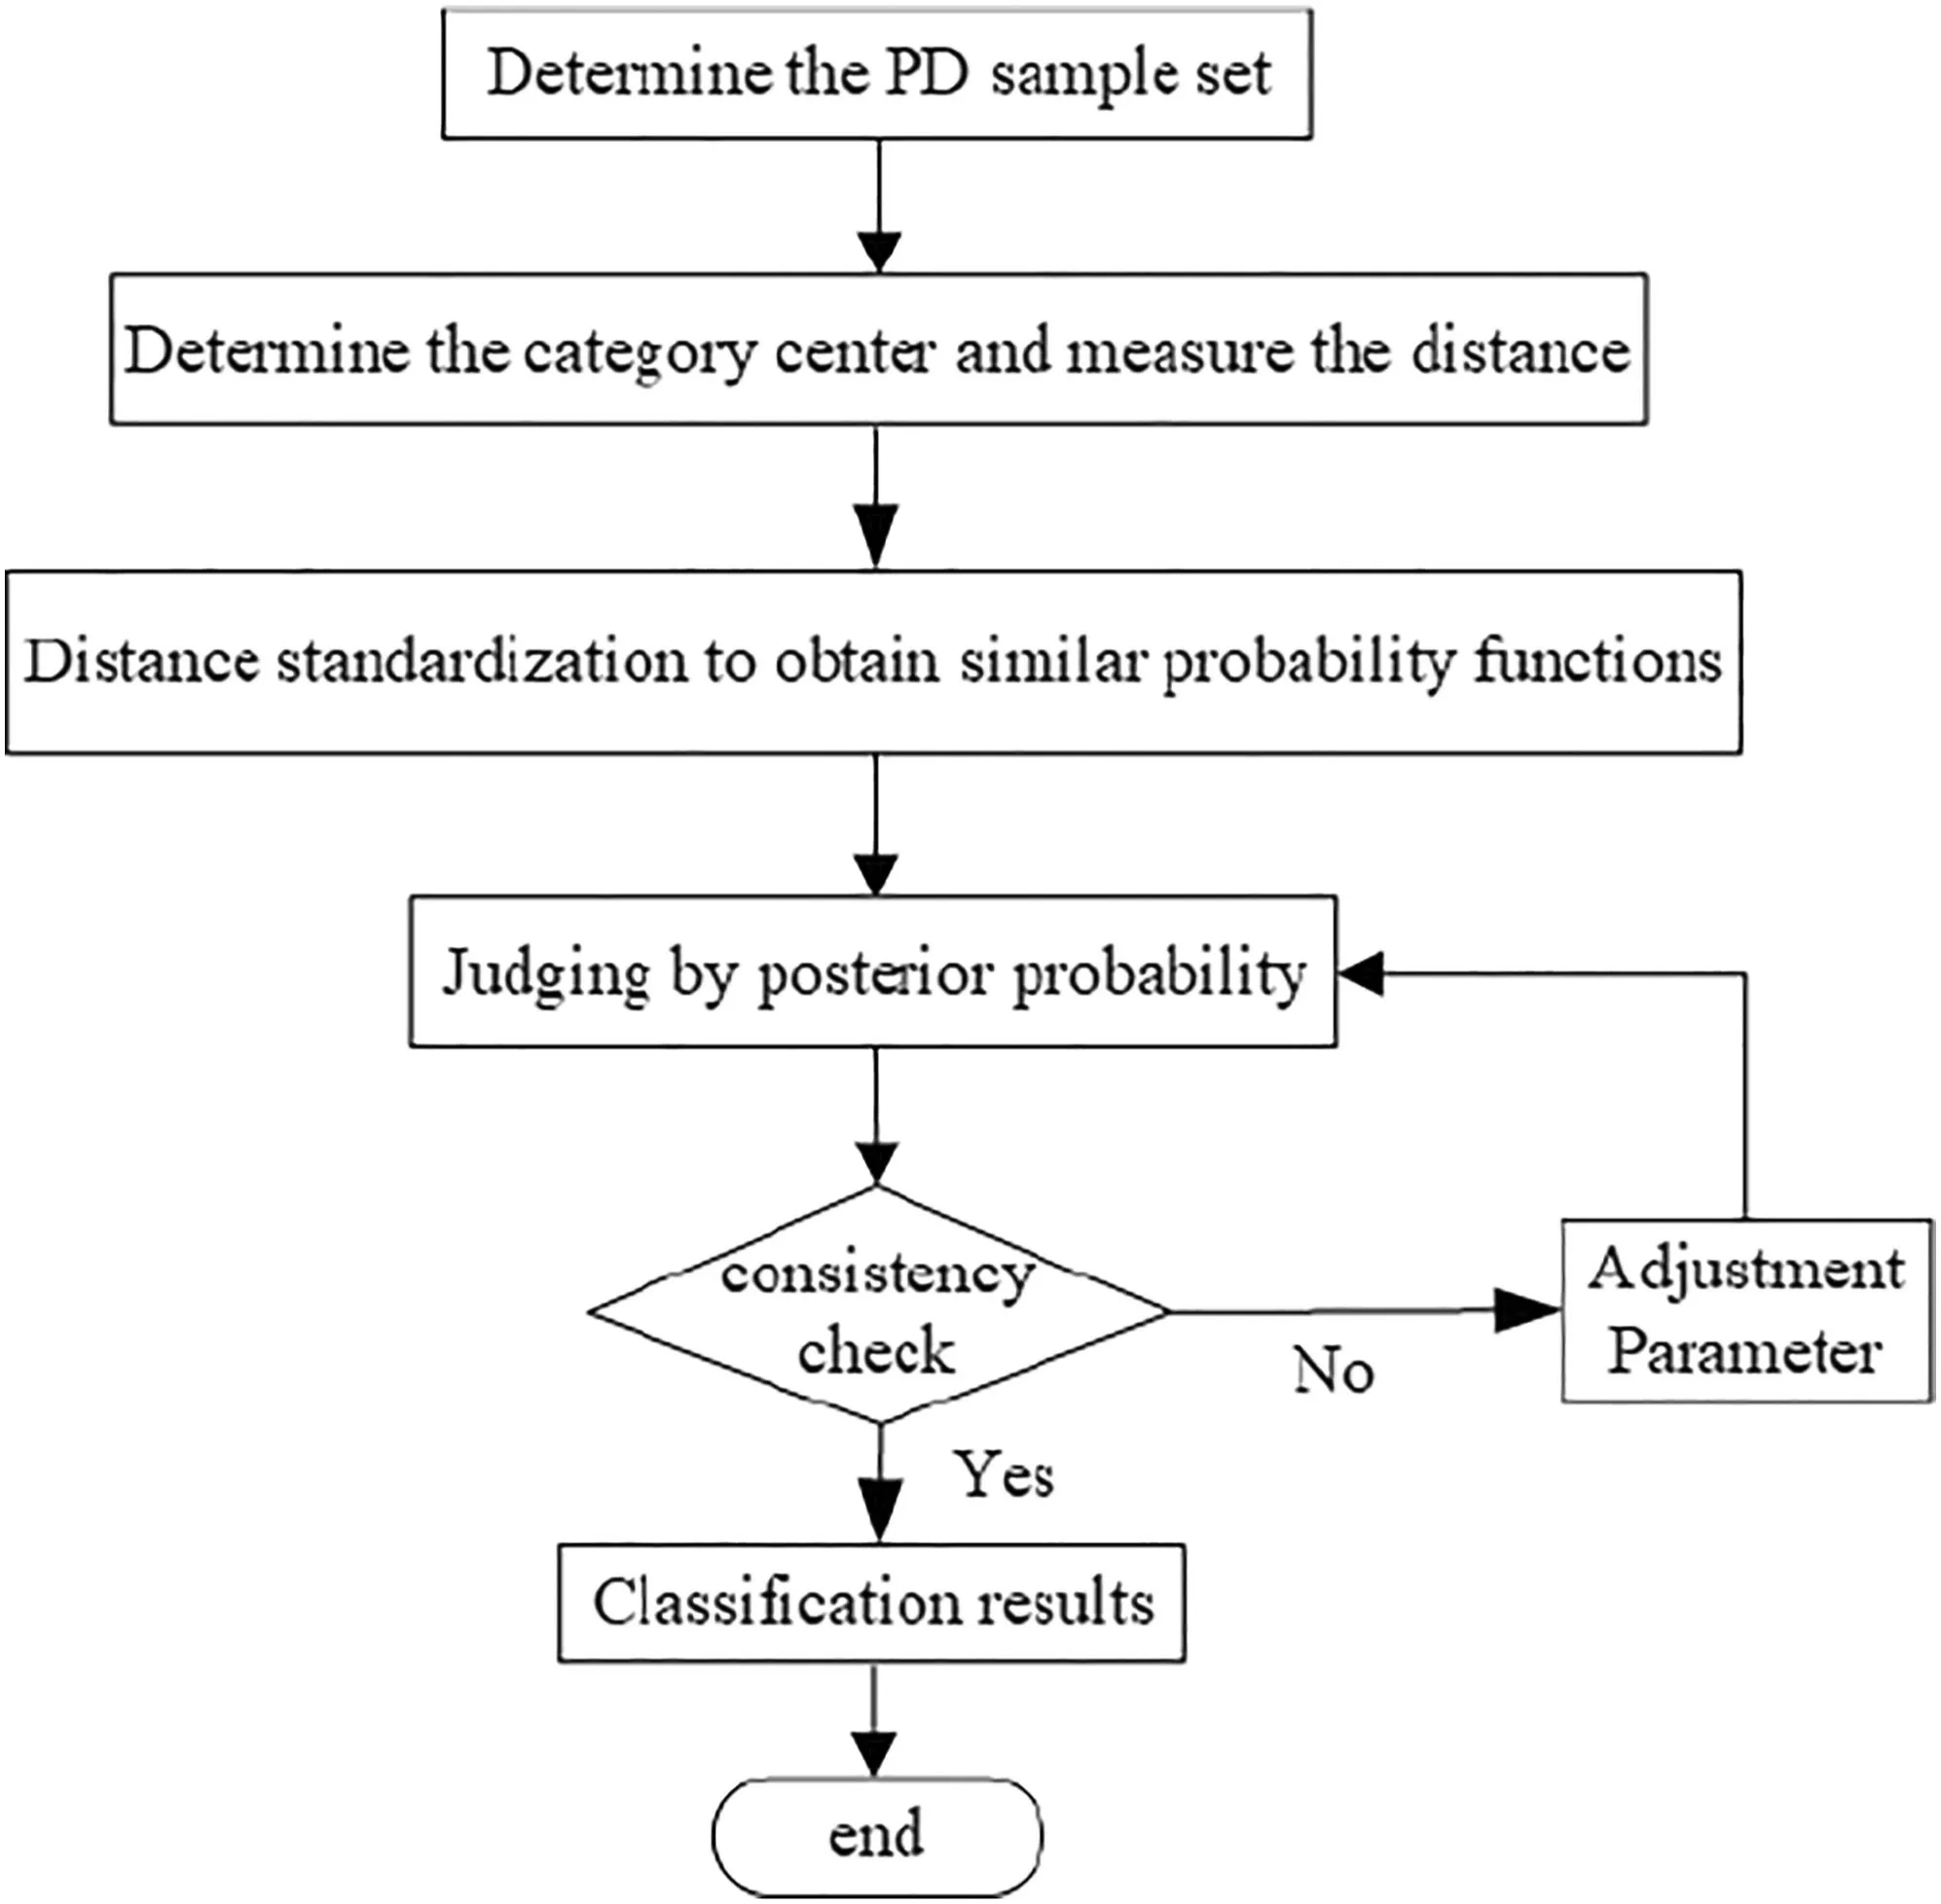
FIGURE 8 Flow chart of pattern recognition
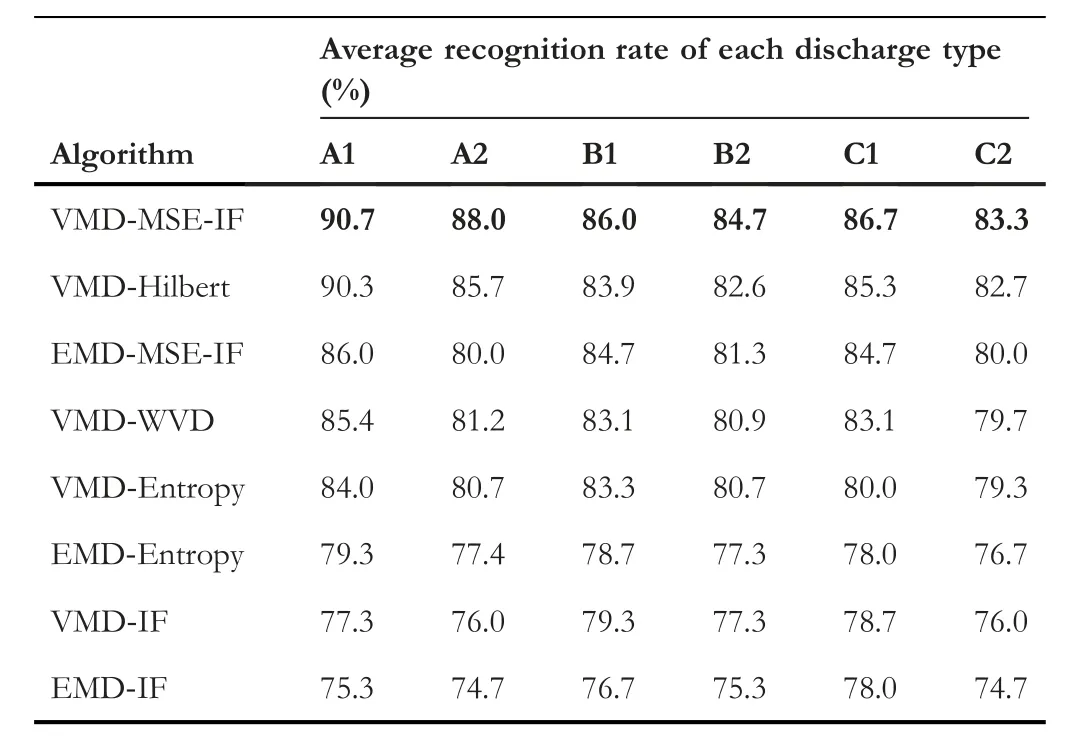
TABLE 4 Binary tree support vector machine(BT-SVM)recognition rate
The average recognition time of the feature extraction method after VMD decomposition is shown in Figure 9.It can be noticed that performances of different pattern recognisers are quite different.According to the principle,the KNN recogniser does not highly rely on samples while BTSVM does.However,due to the consideration of the Gaussian kernel function to weight the sample distance,it overcomes the shortcomings of the traditional KNN algorithm,and the recognition rate is improved.As a result,BTSVM is suitable for multi-dimensional and non-linear classification problems.Under the condition of same signal decomposition and recognition method,the time required to extract the MSE features is significantly longer than that of the image features.
In summary,6 types of PD signals were decomposed by VMD and EMD to extract different eigenvalues,and pattern recognition was carried out by BT-SVM and weighted KNN.By comparison,the VMD-MSE-IF feature extraction method proposed in this work is comparably more efficient than the others.
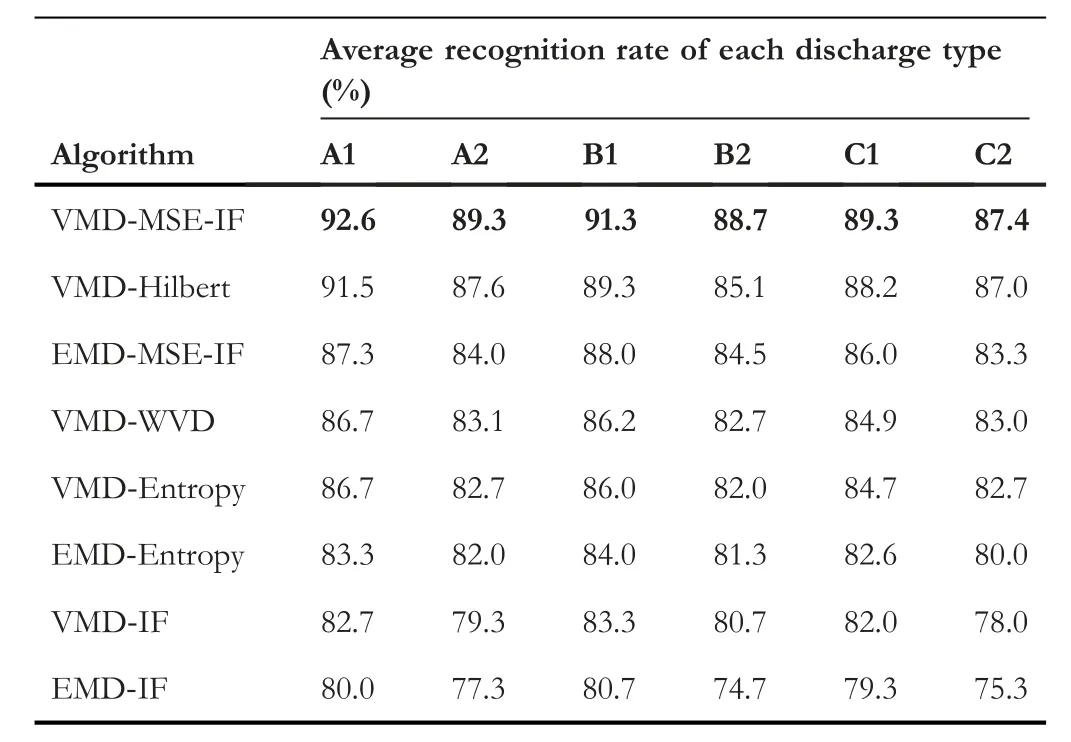
TABLE 5 Weighting KNN recognition rate
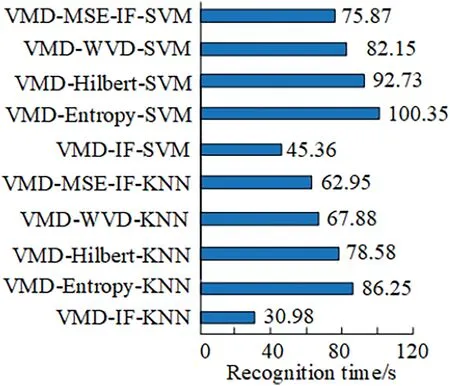
FIGURE 9 Various methods recognition time
5|CONCLUSIONS
Aiming at the problem of efficient feature extraction of PD in liquid nitrogen immersed composite insulation,this paper proposes a novel feature extraction method based on VMDMSE-IF.By dealing with measured and noised PD signals of three typical defects in the lab,the result shows that the proposed method is more efficient than the compared ones and it is robust in processing noisy signals.
ACKNOWLEDGEMENTS
This work is supported by the Chongqing Basic Research and Frontier Exploration Project (Chongqing Natural Science Fund) (cstc2018jcyjAX0295),the Science and Technology Research Project of Chongqing Education Commission(KJQN202001146) and the National Natural Science Foundation of China (52177129).
DATA AVAILABILITY STATEMENT
The data that support the findings of this study are available from the corresponding author upon reasonable request.
ORCID
Xi Chenhttps://orcid.org/0000-0002-2751-6678
 CAAI Transactions on Intelligence Technology2022年2期
- CAAI Transactions on Intelligence Technology的其它文章
- A comprehensive review on deep learning approaches in wind forecasting applications
- Bayesian estimation‐based sentiment word embedding model for sentiment analysis
- Multi‐gradient‐direction based deep learning model for arecanut disease identification
- Target‐driven visual navigation in indoor scenes using reinforcement learning and imitation learning
- A novel algorithm for distance measurement using stereo camera
- Learning discriminative representation with global and fine‐grained features for cross‐view gait recognition