
Mechanism of hyperproteinemia-induced blood cell homeostasis imbalance in an animal model
2022-06-07 10:50GuangWangYongFengWangJiangLanLiRuJiPengXinYinLiangXueDongChenGuiHuaJiangJinFangShiYangHuSiMaShiQingXu
Zoological Research 2022年3期
Guang Wang, Yong-Feng Wang, Jiang-Lan Li, Ru-Ji Peng, Xin-Yin Liang, Xue-Dong Chen, Gui-Hua Jiang,Jin-Fang Shi, Yang-Hu Si-Ma, Shi-Qing Xu,*
1 School of Biology and Basic Medical Sciences, Suzhou Medical College, Soochow University, Suzhou, Jiangsu 215123, China
2 Department of Clinical Laboratory, First Affiliated Hospital of Soochow University, Suzhou, Jiangsu 215006, China
ABSTRACT Hyperproteinemia is a metabolic disorder associated with increased plasma protein concentration (PPC)and is often clinically complicated by malignant diseases or severe infections.At present, however,research on the molecular mechanism underlying high PPC (HPPC) is scant.Here, an animal model of primary hyperproteinemia was constructed in an invertebrate (Bombyx mori) to investigate the effects of HPPC on circulating blood cells.Results showed that HPPC affected blood cell homeostasis, leading to increased reactive oxygen species levels, and induced programmed cell death dependent on the endoplasmic reticulum-calcium ion signaling pathway.HPPC induced the proliferation of blood cells, mainly granulocytes, by activating the Janus kinase/signal transducer and activator of transcription (JAK/STAT) signaling pathway.Supplementation with the endocrine hormone active substance 20E significantly reduced the impact of HPPC on blood cell homeostasis.Thus, we identified a novel signaling pathway by which HPPC affects blood cell homeostasis, which differs from hyperglycemia, hyperlipidemia, and hypercholesterolemia.In addition, we showed that down-regulation of gene expression of the hematopoietic factor Gcm could be used as a potential early detection indicator for hyperproteinemia.
Keywords: Animal model; Blood cell homeostasis; High plasma protein concentration(HPPC); JAK/STAT pathway; Programmed cell death
INTRODUCTION
Hyperproteinemia is a metabolic disorder with a persistently abnormal elevation of plasma protein concentration (PPC),which can clinically complicate other serious diseases, such as multiple myeloma (Chang et al., 2019; Hussain et al.,2019), nephropathy (da Costa Oliveira et al., 2019; Kitazawa et al., 2018), liver cirrhosis (Fujii et al., 2014), infection (Kluck et al., 2019), and pneumonia (Gerin et al., 2014), thereby adversely affecting patient prognosis (Abuzaid et al., 2020;Hussain et al., 2019).It can also appear after plasma therapy and intravenous immunoglobulin treatment (Boyle et al., 2011;Steinberger et al., 2003).Given the difficulty in distinguishing between hyperproteinemia and primary disease or the impactof infection on the body, there is no reliable primary disease model of hyperproteinemia (Chen et al., 2018; Riemer et al.,2016).Therefore, there is a paucity of research on the pathological mechanisms of hyperproteinemia and the effects of hyperproteinemia on the hematological system.
Studies have shown that blood system metabolic disorders,such as hyperglycemia, hyperlipidemia, and hypercholesterolemia, are associated with chronic inflammation (Wagner et al., 2021; Zhao et al., 2020), which disrupts blood cell homeostasis and balance, leading to a significant increase in monocytes and neutrophils (Aguilar-Ballester et al., 2020; Nagareddy et al., 2013).Metabolic blood disorder also affects the proliferation and differentiation of blood cells (Barrett et al., 2019; Gu et al., 2019).Patients with hyperproteinemia also commonly experience abnormal metabolic changes, such as disturbed blood glucose and lipid levels (Hussain et al., 2019; Kluck et al., 2019), suggesting that hyperproteinemia may have a complex effect on blood homeostasis.Clinically, many diseases associated with hyperproteinemia show an imbalance in the proportions of circulating blood cell type (Kitazawa et al., 2018; Sant et al.,2020), such as increased neutrophils in patients with multiple myeloma (Hussain et al., 2019) and increased non-classical monocytes in patients with metabolic syndrome (Khan et al.,2016).Thus, investigating the effects of primary high PPC(HPPC) on blood cell homeostasis is important.
Although hyperproteinemia is clinically common (Bergstedt& Lingen, 1957; Kitazawa et al., 2018), establishing animal models of primary hyperproteinemia remains challenging(Chen et al., 2018; Riemer et al., 2016).For example, early intravenous infusion of autologous plasma has been used to increase PPC in canines to explore effects on basic physiological parameters, such as blood flow and pressure(Manning, 1987, 1992, 1998a, 1998b), but exhibits poor reproducibility and difficult preparation.
We selected an invertebrate, i.e.,Bombyx mori(He et al.,2020; Tabunoki et al., 2016), to construct an animal model of HPPC (AM) with no primary disease impact and controllable PPC levels.We previously found that HPPC has complex effects on gonadal development and metabolic tissue fat remodeling (Chen et al., 2018; Wang et al., 2019) and influences antimicrobial peptide expression by activating the Toll and immune deficiency (IMD) pathway of the NF-κB signaling pathways, showing inconsistent changes in antimicrobial activity against gram-negative and -positive bacteria (Wang et al., 2021).Furthermore, HPPC inhibits phenoloxidase synthesis and weakens the immune effects of melanin in hemolymph (Wang et al., 2021).Silkworms have a completely open circulating hemolymph system, and hematopoiesis depends on the proliferation and differentiation of blood cells in hematopoietic organs and circulating hemolymph (Ling et al., 2005; Nakahara et al., 2010).Silkworm blood cells are generally classified into five major subsets based on morphology and function.Among them,prohemocytes are considered hematopoietic stem and progenitor cells (Ling et al., 2003; Nakahara et al., 2010),granulocytes are the main type of phagocytes, plasmatocytes are mainly involved in encapsulation and phagocytosis,oenocytoids primarily produce phenoloxidase and participate in melanization, while the function of spherulocytes is unknown (Ishii et al., 2014; Ling et al., 2005; Zhang et al.,2021).In the silkworm model of hyperproteinemia, significant changes occur in the number of blood cells (Wang et al.,2021), but the relevant mechanism is still unclear.To this end,we aimed to elucidate the mechanism underlying the influence of HPPC on the proliferation and differentiation(hematopoiesis) of circulating blood cells.
MATERIALS AND METHODS
Ethics statement
All silkworm rearing was performed under standard conditions,and all animal experiments were performed in strict accordance with the recommendations in the Guide for the Care and Use of Laboratory Animals of the National Institutes of Biological Sciences.All animal care and handling procedures were conducted in accordance with Chinese laws regulating the use of experimental animals and the protocols(#SUDA20210802H02) approved by the Committee on the Ethics of Animal Experiments of Soochow University.
Preparation of animals
The animal model of HPPC (AM) used by our group (Chen et al., 2018) and the processing time axis are shown in Supplementary Figure S1A.Bombyx morilarvae (Dazaostrain) were fed fresh mulberry leaves and reared under a temperature of 25 °C, relative humidity of 70%-80%, and 12 h-light:dark cycle.In the wandering stage, mature female larvae were selected, and low-melting point wax (55-60 ℃)was used to seal the silk holes at the front of their head to prevent spinning.The silkworm model (AM) with significantly increased PPC was constructed by releasing nontoxic silk protein into hemolymph during larval-pupal metamorphosis.By modeling at different times after spinning, we found that population development and survival rate decreased under earlier modeling times (Supplementary Figure S2A).Therefore, at 24 h after the start of spinning, mature larvae were selected and sealed to prepare mild model silkworms(mAM) with high non-lethal PPC.The PPC level after modeling was about 60% that of the AM group(Supplementary Figure S2B), with the same batch of naturally spinning silkworms used as the control (CK).The mAM group was injected with 20-hydroxyecdysone (20E, 10 μL, 0.4 μg/μL per individual) (Sigma-Aldrich, USA) at 0 or 24 h after modeling, and the AM group was injected with the JAK inhibitor AG490 (10 μL, 50 μmol/L per individual) (S1509,Beyotime, China) at 144 h after modeling.After disinfection with 75% ethanol at the scheduled time, the epidermis was punctured, and hemolymph was collected using an Eppendorf tube (with 10 μL saturated phenylthiourea solution) in an ice bath.Equal volumes of hemolymph from 3-6 individuals were mixed to form a hemolymph sample for testing.
Blood cell classification
Based on a previously employed method (Ling et al., 2003),the hemocytes ofBombyx moriwere classified by acridine orange-propidium iodide (AO-PI) staining.To 40 μL of hemolymph, a 10 μL AO (10 μg/mL) (A6014, Sigma-Aldrich,USA) and 10 μL PI (2 μg/mL) (P4170, Sigma-Aldrich, USA)working solution was added, well mixed, and stood for 2 min.Red fluorescence (535/615 nm) and green fluorescence(488/515 nm) were observed under a fluorescence microscope.
In vitro culture of hematopoietic organs
In vitroculture followed previous research (Liu et al., 2014).We used 75% ethanol to anesthetize the larvae on the second day of the 5th instar or 24 h after modeling, and then removed the two front-end hematopoietic organ (HPO)-wing disc complexes, followed by washing with phosphate-buffered saline (PBS) and Grace’s insect medium.Each single HPO-wing disc complex was cultured in 10 μL of Grace’s insect culture medium (11 605 094, Thermo Fisher Scientific, USA)supplemented with 10% (v/v) silkworm serum, 1% (v/v)phenylthiourea saturated solution, and appropriate antibiotics at 26 ℃ in a hanging drop.
Blood cell (hemocyte) staining
EdU staining to detect DNA replication in blood cells:Each individual was injected with 10 μL of EdU:PBS (3 mg/mL).After 8 h, the hemolymph was collected and diluted 5-10 times (v/v) with Hank’s Balanced Salt Solution (HBSS).In addition, 60 μL of diluted hemolymph was taken for the hemocyte climbing test (Qiu et al., 2019).We stained the hemocytes using a Click-iT™ EdU Cell Proliferation Kit for Imaging and Alexa Fluor™ 594 dye (C10339, Invitrogen,USA).The cell nucleus was counter-stained with DAPI(C1006, Beyotime, China), with red (590/615 nm) and blue fluorescence (364/454 nm) observed microscopically.The control group was injected with 10 μL of DMSO:PBS (1:2).
Reactive oxygen species (ROS) staining:Based on previous research (Li et al., 2017), 100 μL of hemolymph was diluted 5-10 times in normal saline and climbed on the film for 5 min.According to the kit instructions (S0033S, Beyotime,China), 1 000 μL of ROS staining working solution (10 μmol/L)was added, followed by incubation at 25 °C for 30 min in the dark, washing with saline three times in the dark, and observation of green fluorescence (488/525 nm) under a fluorescence microscope.
Detection of blood cell cycle phase distribution:We used propidium iodide-flow cytometry (PI-FCM) to detect the cell cycle phase of hemocytes (Qiu et al., 2019).First, 600 μL of cold HBSS (C0218, Beyotime, China) was added to 600 μL of hemolymph to collect hemocytes after centrifugation at 3 000 r/min for 10 min at 4 ℃.After HBSS washing and centrifugation (twice), 1 mL of 70% cold ethanol was gently added and the hemocytes were fixed at 4 ℃ for 12 h.Finally,the hemocytes were washed twice with HBSS, mixed with 400 μL of PI working solution (C1052, Beyotime, China), and incubated at 37 ℃ for 30 min in the dark.Cell cycle was analyzed using FC500 FCM (Beckman Coulter, USA).
Detection of blood cell autophagy:We used monodansylcadaverine (MDC) (30 432, Sigma-Aldrich, USA)and Lyso-Tracker Red (C1046, Beyotime, China) for staining(Li et al., 2017).For MDC staining, after the hemolymph samples were diluted, the hemocytes were first climbed and fixed, similar to the detection of apoptosis by terminal deoxynucleotidyl transferase-mediated dUTP nick-end labeling (TUNEL) staining (Li et al., 2017).After washing with PBS three times, we added 1 mL of MDC working solution (50 μmol/L), followed by incubation in the dark for 30 min.Green fluorescence (338/500 nm) was observed under a microscope.For lysosome staining, the hemocytes were first climbed for 5 min, then washed twice with PBS.After this, 1 000 μL of Lyso-Tracker Red working solution (0.1 μmol/L) was added to cover the hemocytes, which were then incubated at 25 ℃ for 30 min.After washing three times with PBS, red fluorescence(577/590 nm) was observed under a microscope.
Detection of blood cell apoptosis:First, 60 μL of hemolymph was diluted 5-10 times (v/v) with HBSS.After 5 min of climbing, the hemocytes were fixed with 4%paraformaldehyde for 15 min.We then applied three methods to detect apoptosis.For detection via TUNEL (Li et al., 2017),hemocytes were incubated with PBS containing 0.5% Triton X-100 (T8787, Sigma-Aldrich, USA) for 20 min at 25 °C.This was followed by detection using anIn SituCell Death Detection Kit TMR Red (12 156 792 910, Roche, Switzerland)program, in which samples were incubated with 60 μL of reaction working solution in the dark at 37 °C for 60 min.After DAPI counterstaining of the nucleus for 20 min, we observed red (540/580 nm) and blue fluorescence under a microscope.Calcium ion fluorescent probe was used to detect calcium ion concentration in the cytoplasm (Li et al., 2017).We added 1 000 μL of Fluo-3 AM (S1056, Beyotime, China) staining solution (5 μmol/L), which was then incubated for 30 min in the dark at 25 °C.Green fluorescence (488/530 nm) was observed after staining.Apoptosis was also detected by FCM(Qiu et al., 2019).Hemocytes were collected according to the method described above for PI-FCM, and the percentage of apoptotic blood cells was detected using an Annexin V FITC Apoptosis Detection Kit (AD10, DOJINDO, Japan) and FC500.
Immunofluorescence staining:After climbing, fixing, and permeabilizing blood cells following the same procedures used for TUNEL staining, primary antibodies (cleaved caspase-3 (Asp175) rabbit Ab (9661s, Cell Signaling Technology, USA) or purified anti-STAT (peptide sequence:LRKIKRAEKKGTESC) (1:200)) were added and incubated for 12 h at 4 ℃.After washing with PBS, the cells were incubated with goat anti-rabbit IgG (H+L) FITC-conjugated secondary antibody (GAR001, Multi Sciences, China) (1:200), and the nucleus was counter-stained with DAPI.Green fluorescence(495/515 nm) of the target protein and blue fluorescence(364/454 nm) of the nucleus were observed under a microscope.
Western blotting
Blood cells were collected from 5 mL of hemolymph by centrifugation at 5 000 r/min for 10 min at 4 ℃.Protein was then extracted using 100 μL of RIPA Lysis Buffer (P0013B,Beyotime, China) containing 1% phenylmethanesulfonyl fluoride (PMSF, Beyotime, China) and 1% phosphatase inhibitors (PhosSTOP, Sigma-Aldrich, USA).Using a TGX Stain-Free FastCast Acrylamide Kit (1 610 183, Bio-Rad,USA), the protein samples were separated by 10% sodium dodecyl sulfate-polyacrylamide gel electrophoresis (SDSPAGE) and transferred to polyvinylidene difluoride (PVDF)membranes using a semi-dry transfer film.The membranes were blocked with western blocking solution (P0023B,Beyotime, China) for 2 h at 25 °C, followed by incubation with purified anti-STAT antibody (1:200), anti-phospho-Stat5 antibody (Tyr694) (4 322, Cell Signaling Technology, USA)(1:1 000), and anti-tubulin (ab52901, Abcam, England)(1:5 000) for 12 h at 4 °C.After washing three times with Trisbuffered saline (TBS) containing 0.05% Tween 20 (TBST; pH 7.5), the membranes were incubated with horseradish peroxidase (HRP)-labeled anti-rabbit IgG (Bioworld Technology, USA) (1:5 000) for 2 h at 37 °C.After washing three times with TBST, an appropriate amount of ECL (Bio-Rad) color solution was added (1:1) in the dark, with the membranes then photographed at room temperature after 2 min using an EZ-ECL Chemiluminometer Detection Kit for HRP (Biological Industries, Israel).The resulting images were processed and analyzed using Image Lab software.
Gene expression analysis
Total RNA was extracted using a TRIzol®Reagent Invitrogen™ Kit (15 596 018, Life Technologies, USA), and cDNA was obtained by reverse transcription.The ABI StepOnePlus™ Real-Time PCR System (Ambion, USA) was used for quantitative real-time polymerase chain reaction(qPCR) in a 20 μL reaction system.Gene primers are listed in Supplementary Table S1, andBombyx moriRp49was used as the reference gene.
Gene silencing
Small interfering RNAs (siRNAs) forGcm(Gene ID: 101 742 696)were designed and synthesized by Genepharma (China).The primer sequences (siRNA-Gcm 598 and siRNA-Gcm 1 017)are shown in Supplementary Table S1.Both CK and mAM were injected into the dorsal vessel with 10 μg of siRNA(siRNA-Gcm598: siRNA-Gcm1017=1:1) at 96 h after modeling, and the negative control was injected with the same amount of negative control siRNA (si-NC).Hemolymph samples were collected 48 h after injection, and interference efficiency was detected by qPCR.
Biochemical assays
Hemolymph samples were collected from 48 to 192 h after modeling.The levels of blood ammonia, hydrogen peroxide,superoxide anion, and hydroxyl free radicals were detected using appropriate kits (BC4385, BC3595, BC1290, Solarbio;A018, Nanjing Jiancheng, China) in accordance with the provided instructions.The enzymatic activities and contents of catalase (CAT), superoxide dismutase (SOD), and glutathione S-transferase (GST) were measured using appropriate kits(A007; A001; A006, Nanjing Jiancheng, China) following the manufacturer’s instructions.Absorbance of all samples was measured using a microplate spectrophotometer (Eon,BioTek, USA).
Data analysis
Image-Pro Plus v6.0 and GraphPad Prism v8 (GraphPad,USA) were used for image and data processing, respectively.Multiplet-test (one per row) analysis was performed using the Holm-Sidak method.
RESULTS
HPPC induced changes in blood cell homeostasis
The PPC level increased significantly after modeling to 3.338 times that of the CK group at 192 h, and the cumulative mortality rate reached 52% (Supplementary Figure S1A-C).AO-PI staining accurately identified the five types of silkworm hemocytes (blood cells): i.e., plasmatocytes, prohemocytes,granulocytes, oenocytoids, and spherulocytes (Figure 1A).Compared with the CK group, HPPC increased blood cell density in the early and mid-term period (48-96 h) after modeling, but significantly decreased blood cell density in the later period (144-192 h) in the AM group (Figure 1B).With the significant increase in PPC starting at 48 h after modeling,plasmatocyte density in the model group (AM) continued to decrease until 144 h (to trace levels); the densities of prohemocytes, granulocytes, oenocytoids, and spherulocytes showed similar trends, i.e., first increasing and then decreasing.The density of spherulocytes dropped rapidly from 96 h to trace amounts, while the densities of prohemocytes,granulocytes, and oenocytoids were significantly higher than that of the control group before 96 h, but gradually decreased thereafter.Both prohemocytes and oenocytoids decreased to a significantly lower density than the control group at 144 h,while granulocytes maintained a similar density to CK after 144 h (Figure 1D, E; Supplementary Figure S1D-F).These results indicate that HPPC had the greatest effect on plasmatocyte density.
Percentage composition (PC) of the different hemocytes showed that blood cell homeostasis in the hemolymph of the AM group was severely unbalanced (Figure 1C).Compared with the CK group, the PC value of granulocytes in the AM group continued to increase with time after modeling (0-192 h), reaching 62.38% at 48 h and 85.50% at 192 h (12.63%and 25.95% higher than the control, respectively).The high PC values of prohemocytes and plasmatocytes at the beginning of modeling decreased rapidly with the increase in granulocytes, from 18.87% and 28.92% at 48 h to 7.63% and 3.63% at 192 h, respectively.The spherulocytes were basically undetectable at 96 h after modeling.Thus,granulocytes were the most abundant blood cell type in the hemolymph of the hyperproteinemia silkworm model,indicating that blood cells changed significantly under the influence of HPPC.
The transcriptional level of potential hematopoietic-related factor genes in blood cells was significantly affected by HPPC.Compared with the CK group, theUshandLozengegenes related to oenocytoid production in the AM group were upregulated at 48 h, significantly down-regulated at 96 h, and returned to CK levels at 144 h after modeling (Supplementary Figure S3).In addition, the transcriptional level of homologous geneGcmin the silkworm, which is aDrosophilaplasmatocyte-promoting factor, showed a cliff-like downregulation after modeling compared with the control group(Figure 1F).This suggests that HPPC may change the ability of blood cell formation by modulating the expression of hematopoietic-related factors, such asGcm.
The pathological effect of HPPC in the AM group wassevere, and all individuals died.To explore the relationship betweenGcmgene expression and changes in hemocyte composition in hyperproteinemic silkworms, a mild disease model was introduced.The PPC level was about 2.218 times higher than that of the control group at 192 h after modeling,and 30% of individuals survived and completed generation development (Supplementary Figure S1A-C).After mAM modeling, theGcmgene siRNA was immediately injected intothe silkworms.After 48 h,GcmmRNA levels in the blood cells of the CK and mAM groups were down-regulated by 59.37%and 72.51%, respectively (Figure 1G).Furthermore, the PC values of plasmatocytes decreased by 14.33% (CK) and 9.89% (mAM), PC values of prohemocytes decreased by 3.57% (CK) and 3.96% (mAM), and PC values of granulocytes increased by 17.58% (CK) and 15.21% (mAM) (Figure 1H),respectively.These results suggest that by silencing theGcmgene, not only did the CK group exhibit a similar blood cell homeostasis trend as the AM group, but changes in blood cell homeostasis in the mAM group also showed the additive effects of increased PPC and perturbedGcmgene expression.Furthermore, the influence of HPPC on the regulation of blood cell production was mutually constrained.
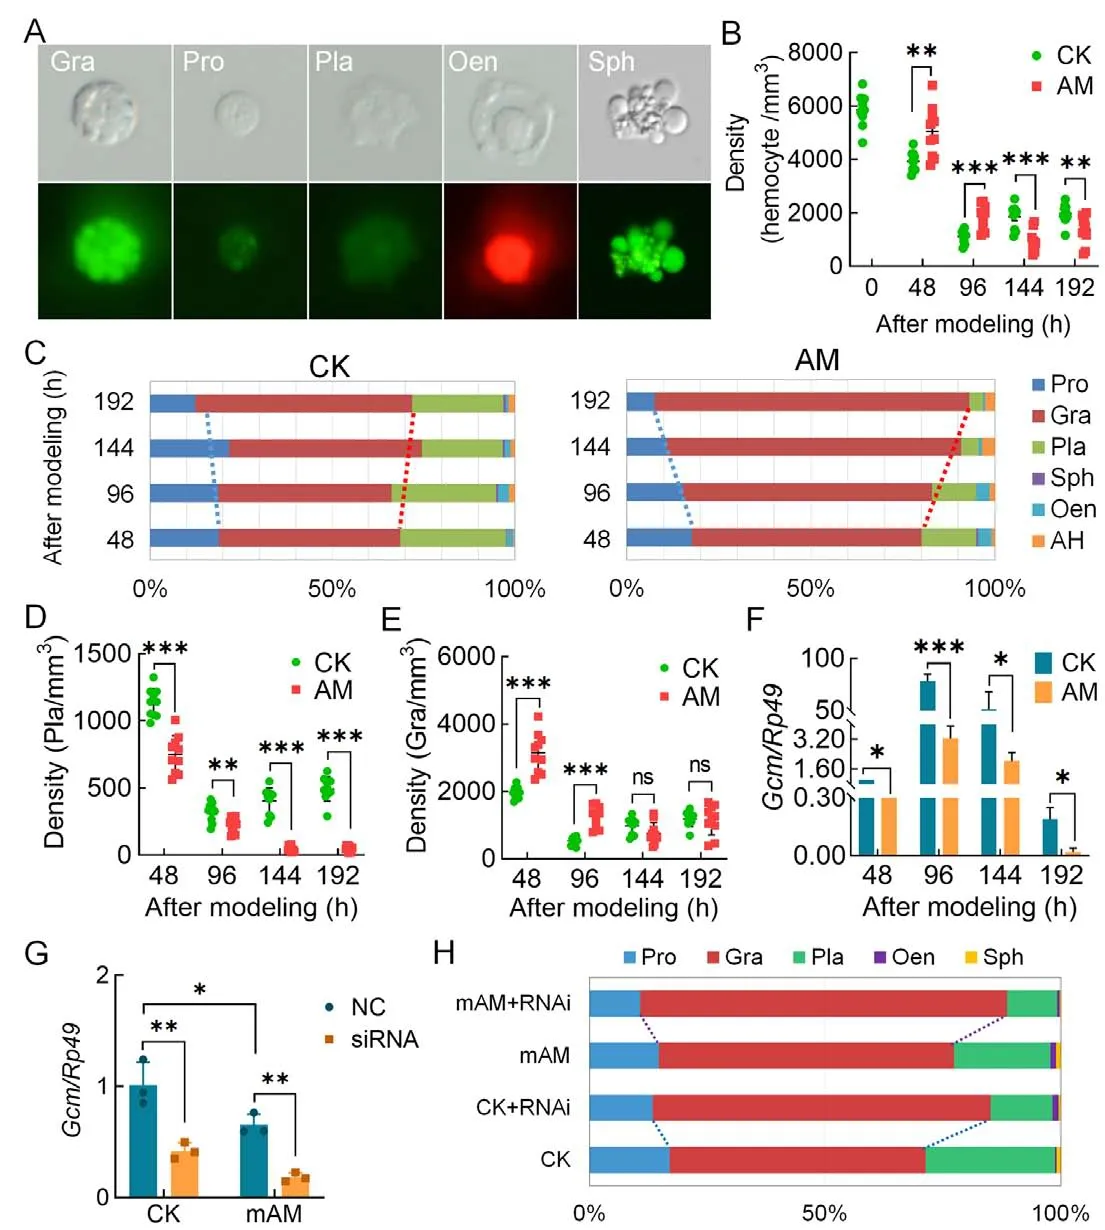
Figure 1 HPPC affected circulating hemocyte (blood cell) composition
HPPC induced elevation of programmed cell death (PCD)in blood cells
We analyzed the mechanism by which HPPC led to changes in hemocyte homeostasis from the perspective of blood cell death.Results showed that in the early to mid-term period(48-96 h) after modeling, hemocyte autophagy signals were enhanced and autophagy was increasingly dominated by granulocytes; however, both decreased at 192 h.Using MDC staining (Figure 2A) as a measure of autophagy level, the MDC positivity rate of hemocytes in the AM group was significantly higher than that of the CK group before 96 h but returned to CK levels at 192 h (Figure 2B).Regardless of the group (AM or CK), MDC-positive hemocytes in all investigation periods were primarily granular cells (Figure 2C).These cells were further stained using Lyso-Tracker Red (Figure 2D),which showed a similar trend as MDC staining, i.e., the autophagy-lysosome pathway (ALP) was significantly activated in the early to mid-term period (48-96 h) after HPPC-induced modeling but returned to CK levels at 192 h(Figure 2E).
We investigated the transcriptional level of marker genes in the autophagy signaling pathway.Expression of the upstream signal marker geneAtg6for autophagy initiation was significantly up-regulated in AM silkworm hemocytes compared with CK hemocytes at 48-96 h after modeling, but expression completely recovered at 192 h and was significantly down-regulated compared to the CK group(Figure 2F).However, the autophagy executive protein marker geneAtg8was up-regulated compared with the CK group at 48-192 h (Figure 2G).
TUNEL staining was applied to mark apoptotic hemocytes(Figure 3A).At 96 h after modeling, there was no significant difference in the positive cell rate between the AM and CK groups, with rates increasing in both groups compared to levels at 48 h., The TUNEL positivity rate in the CK group decreased from 9.12% at 96 h to 3.41% at 192 h and recovered to the level observed at 48 h.In the AM group, the TUNEL positivity rate increased significantly from 9.64% at 96 h to 23.23% at 192 h, which was significantly higher than that of the CK group (Figure 3B).According to the classification of TUNEL-stained blood cells, the majority of apoptotic blood cells in both groups were granulocytes (Figure 3C).We also studied the transcriptional level of the apoptosis initiation marker geneDroncand its level in hemocytes.Results showed thatDroncexpression was significantly higher in the AM group compared to the CK group at 48-96 h after modeling but decreased to a lower level at 192 h (Figure 3D).
We used Hoechst and PI co-staining to identify necrotic hemocytes (Supplementary Figure S4A).At 48, 96, and 192 h after modeling, the co-positivity rates of hemocytes in the AM group were 3.42%, 2.97%, and 3.88%, respectively, and in the CK group were 3.37%, 2.96%, and 3.13%, respectively (both at normal physiological levels) (Supplementary Figure S4B).Hemocyte co-positivity was further classified.At 48 h, the copositive cells in the CK and AM groups were mainly prohemocytes, granulocytes, plasmatocytes, and oenocytoids;at 96 and 192 h after modeling, the CK group was mainly composed of prohemocytes, granulocytes, and plasmatocytes,while the AM group was primarily comprised of granulocytes(Supplementary Figure S4C).
The Fluo-3 AM fluorescent probe was used to detect apoptosis signals released by endoplasmic reticulum-calcium ions (Figure 3E).At 48 h after modeling, the positivity rates of Fluo-3 AM in the CK and AM group hemocytes were high,reaching 17.64% and 18.52%, respectively.Subsequently, the positivity rates in the CK group decreased rapidly to 1.39% at 96 h and 0.99% at 192 h; while, in the AM group, the positivity rate increased rapidly to 25.55% at 96 h, but then dropped to trace levels (0.75%) at 192 h (Figure 3F).Immunofluorescence of the apoptosis signaling protein caspase-3 showed that the positivity rate in hemocytes at 48-192 h after modeling was very low, i.e., 0.60%-1.58% in the AM group and 0.77%-3.19% in the CK group(Supplementary Figure S5).
The above results indicated that HPPC-induced apoptosis of blood cells was not dependent on the mitochondrialcaspase pathway, but mainly depended on the endoplasmic reticulum-calcium ion release apoptotic signaling pathway.Apoptosis occurred in the later stage of modeling after autophagy signaling and levels decreased.The main apoptotic hemocytes included prohemocytes and granulocytes.
After investigating the reasons for the increase in PCD levels in circulating hemocytes induced by HPPC, we found that the blood ammonia level, which was closely related to HPPC, was significantly higher in the AM group than in the CK group, with levels 28.29, 12.69, and 28.02 times higher at 96,144, and 192 h, respectively (Supplementary Figure S6B).DCFH-DA staining was performed to determine the ROS level in hemocytes.Results showed that HPPC led to an increase in the rate of DCFH-DA-positive hemocytes (Figure 4A;Supplementary Figure S6A).Furthermore, relative fluorescence intensity (ROS intensity) continued to rise after modeling and was higher than that in the CK group(Figure 4B).After modeling, the hemolymph levels of hydrogen peroxide (H2O2) (Figure 4C) and superoxide anion(ORF) (Figure 4D) in the AM group were higher than that in the CK group, and the inhibitory ability of hydroxyl free radicals was also significantly lower than that in the CK group at 192 h (Figure 4E).Hemolymph enzyme activity at 48-192 h after modeling indicated that SOD (Figure 4F) and CAT activity (Figure 4G) and GSH content (Figure 4H) weresignificantly higher in the AM group than in the CK group.These results suggest that hemolymph increases the level of oxidative stress caused by the elimination of ROS, breakdown of peroxides, and adverse physiological environment produced by HPPC.Furthermore, HPPC induced continuous and enhanced oxidative stress in hemocytes, with H2O2being the main marker, which may explain the increase in PCD levels in hemocytes.

Figure 2 HPPC induced autophagy of circulating hemocytes (blood cells) in early and mid-stage period after modeling
HPPC affected blood cell proliferation and differentiation via the JAK/STAT pathway
As shown above, HPPC led to an increase in granulocytes and changes in the homeostasis of circulating blood cells.Thus, we next explored whether these pathological changes were related to changes in the proliferation and differentiation of hemocytes.
The proliferation of circulating hemocytes was investigatedby EdU staining, which showed more active cell proliferation in the later stage in the AM group (Figure 5A).At 48 h after modeling, there was no significant difference in the EdU-positivity rate in hemocytes between the CK and AM groups(2.32% and 2.11%, respectively, of base-line physiological level).The EdU-positivity rate in the CK group increased to 7.84% at 96 h, decreased to 6.62% at 144 h, and was restored to the base-line level (2.12%) at 192 h.In contrast,the EdU-positivity rate in the AM group increased significantly from 2.49% at 96 h to 8.88% at 144 h, remained at a high level (8.27%) at 192 h, then further increased to 12.26% at 216 h and 12.28% at 240 h, while levels in the CK group remained at 2.62% and 1.75%, respectively (Figure 5B).At 96-144 h after modeling, the CK group was in an active proliferation period, and the EdU-positive hemocytes were mainly granulocytes, with a small number of prohemocytes; in the AM group, however, only granulocytes were observed in the EdU-positive cells from 144-240 h (Figure 5C).RepeatedEdU staining was consistent with these results(Supplementary Figure S7E, F).These findings imply that the proliferation of circulating hemocytes in the AM group was delayed compared to that in the CK group, but in the later stages after modeling, active hemocyte proliferation continued to occur, and blood cells were mainly granulocytes.

Figure 3 HPPC induced apoptosis of circulating hemocytes (blood cells) via endoplasmic reticulum-calcium ion release signaling pathway

Figure 4 HPPC increased oxidative stress in hemocytes
To explore the cause of delayed proliferation of circulating hemocytes in HPPC, we investigated the cell cycle phase of hemocytes (Figure 5D; Supplementary Figure S7A).At 48-192 h after modeling, the proportion of hemocytes in the G0/G1 phase and S phase in the AM group showed the opposite trend to that in the CK group (Supplementary Figure S7B, C).At 96 h after modeling, cells were arrested in the G0/G1 phase, indicating that HPPC inhibited DNA synthesis of hemocytes (Figure 5E).The cell proliferation index also showed a significant difference at 96 and 192 h after modeling, with opposing changes between the CK and AM groups (Figure 5E, F).These results indicate that the distribution of blood cells in the cell cycle changed during hyperproteinemia.In the early stages after modeling,hemocytes were arrested in the G1 stage, but vigorous cell division in the later stages continued, thereby displaying delayed cell proliferation.
To assess the effects of HPPC on hematopoietic capacity, a previously establishedin vitroculture of hematopoietic organs was used (Liu et al., 2014).The HPO-wing disc complex was removed 24 h after modeling, and the level of hematopoiesis was observed after 48 h ofin vitroculture.In the CK group,the HPO-wing was at the initial stage of normal dissociation of metamorphosis development.Although the tissues were shrinking, they could still proliferate and release mature hemocytes, including prohemocytes and plasmatocytes(Figure 5G).However, in the HPO-wing of the AM group,although morphology was intact and the tissues had not begun to dissociate, the number of released hemocytes was very small (Figure 5G, H).Thus, even if the HPO was removed from the HPPC environmentinvivo, its hematopoietic ability was still severely affected by HPPC in the body during the initial 24 h of modeling.
To study the molecular signaling pathways by which HPPCaffects the proliferation of hemocytes, we focused on the JAK/STAT pathway, which plays evolutionarily conserved roles in cell proliferation and hematopoiesis and is related to the cell cycle in silkworm cell lines (Hao & Jin, 2017; Hu et al.,2015).Immunofluorescence was used to detect the STAT protein in hemocytes.Results showed STAT-positive hemocytes in both the CK and AM groups (Figure 6A).At 48 and 96 h after modeling, there was no significant difference in the STAT-positivity rate between the CK and AM hemocytes,which increased from 1.40% and 1.28% to 3.72% and 3.18%,respectively.The STAT-positivity rate in the CK group decreased to 1.43% at 192 h, whereas the AM group rate increased significantly to 8.11% (Figure 6B).Classification and analysis of STAT-positive hemocytes showed that granulocytes were the main cell type (Figure 6C).
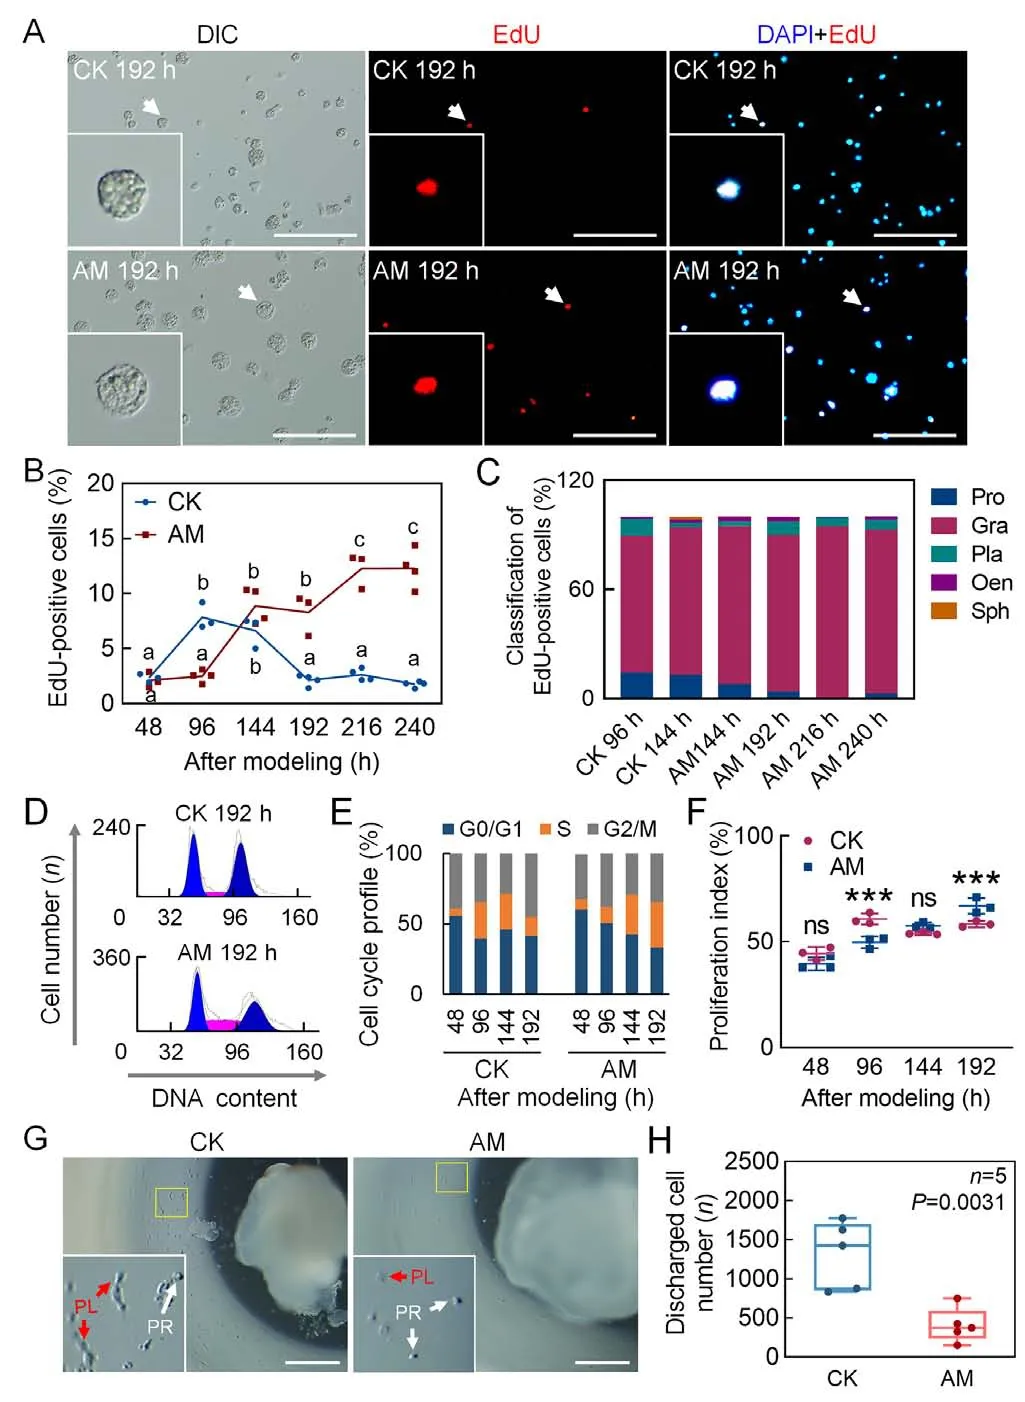
Figure 5 Hyperproteinemia delayed proliferation of hemocytes in later stages of modeling
Based on phosphorylation of the STAT protein in circulating blood cells, both STAT and phosphorylated-STAT protein levels in the AM group showed pathway activation signals,with similar levels to the CK group at 48-96 h after modeling,but higher levels (20.75 and 6.73 times, respectively) than the CK group at 192 h, consistent with the immunofluorescence trends (Figure 6D-F).These results imply that the JAK/STAT pathway was activated at 192 h after modeling based on STAT protein translation and phosphorylation activation.
We investigated gene transcriptional levels of key members of the JAK/STAT pathway in hemocytes.STATmRNA expression in the CK group increased with silkworm development, whereas expression in the AM group was significantly up-regulated compared with the CK group at 48 to 96 h after modeling, but rapidly decreased to the CK level at 192 h (Figure 6G).The transcriptional level ofHOP, a homologous gene ofDrosophila JAK(Peng et al., 2012),showed a very similar trend to that of theSTATgene, and was significantly up-regulated in the AM group compared with the CK group at 48 to 192 h after modeling (Figure 6H).We also studied the transcriptional levels of negatively regulated genesSOCS2andSOCS6downstream of the JAK/STAT pathway.Although both genes were down-regulated in the AM group compared with the CK group at the initial stage after modeling,they were significantly up-regulated compared with the CK group in the later stages.Thus, compared with theHOPandSTATgenes, only the temporal expression profiles showed a phase delay (Figure 6I, J).
To test the regulatory effects of the JAK/STAT signaling pathway on silkworm hematopoiesis, highly congruent symmetrical HPO-wing complexes from 5L2d larvae with strong hematopoiesis were used for hanging drop culture with insect medium supplemented with the JAK inhibitor AG490.The number of hemocytes in the culture medium after 72 h showed that AG490 significantly reduced the proliferation and release of hemocytes in the HPO (Figure 6K-M).Thus, these findings indicate that the JAK/STAT signaling pathway promotes blood cell production in hematopoietic organs and,under the physiological environment of hyperproteinemia, this pathway is activated in hemocytes and physiological processes, such as regulation of blood cell proliferation, are initiated.
To verify the effects of the JAK/STAT pathway on homeostasis of circulating hemocytes caused by HPPC, the AM group was injected with the JAK inhibitor AG490 at 144 h after modeling and circulating hemocytes were collected at 192 h.Results showed that the JAK/STAT signaling pathway,as determined by the phosphorylated-STAT protein level, was significantly weakened (Figure 7A).In addition, the EdU-positivity rate in the proliferating cells was significantly reduced in the AM group from 8.03% to 1.82%, similar to the level in the CK group (1.80%) (Figure 7B, C).Classification of the EdU-positive hemocytes revealed that the decreased cells were mainly granulocytes (Supplementary Figure S8A).These results indicated that the JAK/STAT pathway regulates the proliferation of blood cells, mainly granulocytes, in silkworms.
After injection of AG490, the occurrence of hemocyte apoptosis in the AM group increased significantly and the number of surviving hemocytes decreased significantly(Supplementary Figure S8C-E).In addition, at 192 h after modeling, although the main antimicrobial peptide genesmoricin,cecropin, anddefensinwere significantly up-regulated in the hemocytes of the AM group compared with the CK group, the mRNA levels were not significantly changed by AG490 injection (Supplementary Figure S8B).These results indicate that activation of the JAK/STAT signaling pathway in the later stage of HPPC is not the primary cause of immune gene response.
The clinical HPPC case validation results are shown in Figure 7D and Supplementary Figure S9.In four clinical cases(aged 46-64 years, three males and one female) with HPPC,including two cases of multiple myeloma and two cases of liver damage, routine blood examination showed that peripheral blood homeostasis was unbalanced; however, the change indicators of the different cases were inconsistent.There were four cases (aged 40-58 years, two males and two females) (NPPC) with PPC in the reference range, including three cases of kidney transplantation and one case of pleural effusion.Routine blood tests showed that peripheral blood homeostasis was not significantly different.The transcriptional levels of transcription factorsSTAT1andSTAT3in blood cells of HPPC patients were also significantly higher than that in NPPC patients, while the transcriptional level ofSOCS1, a downstream negative regulator of the JAK/STAT signaling pathway, was significantly lower than that in NPPC patients(Figure 7E).These results suggest that the JAK/STAT pathway is up-regulated in the peripheral blood of disease samples with high total protein.On the other hand, the transcriptional level ofGcm, a conservative hematopoietic factor, was down-regulated in a cliff-like manner compared to the control group, and theGcm1level was only 0.40% that of the NPPC group (Figure 7F).These results indicate that the JAK/STAT pathway is also up-regulated in peripheral blood cells, withGcmgene expression sharply decreased in four clinical patients with high PPC.
Previous research has shown that the endocrine hormone active substance 20E can effectively rescue the physiological harm of HPPC to silkworm fat body remodeling (Chen et al.,2018); however, the underlying molecular mechanism is unknown.Here, we constructed a mild disease model (mAM)and injected 20E at 24 h after modeling to investigate its rescue effects on damage to circulating blood cell homeostasis caused by HPPC.Results showed that the levelof PPC decreased slightly after 20E rescue treatment but could not be recovered.At 192 h after the wandering stage,although the level of PPC in the rescue group was still significantly higher than that in the CK group, circulating blood cell homeostasis was significantly restored (Figure 7G-I).These findings suggest that changes to circulating blood cell composition caused by mild hyperproteinemia can be effectively recovered by endocrine hormone rescue.

Figure 8 Summary of effects of HPPC on blood cell homeostasis
We next investigated the relationship between changes in blood cell homeostasis after 20E rescue and the JAK/STAT signaling pathway.First, 20E was supplemented at 0 h after modeling in the mAM group.Results indicated that the hematopoietic factorGcmin the hemocytes and transcriptional levels of key genes in the JAK/STAT pathway showed changes similar to the CK group.In the mAM group supplemented with 20E,GcmmRNA expression in the hemocytes was significantly higher than that in the mAM group and notably higher than that in the CK group at 48 h after modeling (Figure 7J).After 20E supplementation, the significant increases inHOPandSTATexpression in the mAM group were significantly down-regulated (Figure 7K, L).This suggests that supplementation with 20E can improve hematopoietic function and restore circulatory blood cell homeostasis by affecting the JAK/STAT signaling pathway.
DISCUSSION
Hyperglycemia, hyperlipidemia, hypercholesterolemia, and other metabolic disorders can affect blood cell proliferation,differentiation, and death (Kraakman et al., 2017; Nagareddy et al., 2013; Sarrazy et al., 2016), leading to changes in blood cell homeostasis and development of hematopoietic disorders(Adler et al., 2014; Barrett et al., 2019).The effects of high cholesterol on blood cell homeostasis are related to theproliferation of multipotent progenitor cells (HSPCs) and preferential differentiation into myeloid precursors (Chistiakov et al., 2018).ApoA-I binding protein-mediated cholesterol efflux activates endothelial Srebp2 and promotes the expansion and mobilization of HSPCs by regulating Notch pathway genes (Gu et al., 2019).Myeloid progenitor cell proliferation and migration are induced by hyperglycemia,which is related to S100 calcium-binding proteins A8/A9(S100A8/A9) produced in neutrophils acting on the receptor for advanced glycation end products in common myeloid progenitors (Nagareddy et al., 2013).Hyperlipidemic serum promotes the production of interleukin 6 (IL-6) by immunocytes called dendritic cells (DCs), thereby enhancing the production of IL-17A, leading to an increase in granulocytes (Bagchi et al., 2017).AMP-activated protein kinase (AMPK) activated by macrophage colony-stimulating factor (M-CSF) accelerates atherosclerosis by enhancing the differentiation of monocytes into macrophages (Zhang et al.,2017).Although the pathological mechanisms of blood cell homeostasis imbalance caused by different metabolic disorders are different, they are all related to conserved hematopoietic transcription factors and dysregulation of gene expression in signaling pathways, such as M-CSF, AMPK, and Notch (Gu et al., 2019; Zhang et al., 2017).
Hematopoietic function in silkworms is regulated by a series of conserved hematopoietic factors and signaling pathways,includingUsh,Lozenge, andGcm(Gene ID: 101 742 696)(homologous gene ofDrosophila DmGcm).UshandLozengeare involved in regulating oenocytoid production (Xu et al.,2015) andDmGcmis involved in regulating the differentiation and formation of plasma cells inDrosophila(Bataillé et al.,2005; Lebestky et al., 2000).Down-regulation of theDmGcmgene enhances the phenotype caused by overexpression of the JAK/STAT pathway (Bazzi et al., 2018; Trébuchet et al.,2019).In mammals and fruit flies, highly conserved signaling pathways, such as JAK/STAT, are necessary to maintain normal blood cell homeostasis (Hao & Jin, 2017; Koranteng et al., 2020; Raivola et al., 2020).Imbalance in blood cell homeostasis due to leukemia or diabetes can result in dysregulation of the cellular JAK/STAT pathway (Dodington et al., 2018; Huang et al., 2018).Previous research has also indicated that JAK/STAT may be involved in regulation of the silkworm cell cycle (Hu et al., 2015) and may interact with the epidermal growth factor receptor pathway in silkworm larvae(Abbas et al., 2018).
In the current study, we found that HPPC instigated changes in the basal metabolism of hemolymph inBombyx mori, induced a significant increase in the activity of the endocrine hormone bombyxin, which regulates glucose metabolism, and caused synthesis and catabolism disorders related to protein, sugar, lipids, and other metabolites(Supplementary Figure S10).In addition, HPPC severely and adversely affected blood cell homeostasis.This led to a decrease in the number of prohemocytes with multidirectional differentiation potential in the circulating hemolymph and a significant increase in granulocytes, which exerted phagocytic ability, while the other phagocytic blood plasmatocytes were significantly reduced.In addition to the cause of apoptosis, the decrease in plasma cell density may also be related to the differentiation of plasmatocytes into oenocytoids (Nakahara et al., 2010).Thus, hematopoietic disorder appears to be an important reason for blood cell ratio imbalance caused by primary hyperproteinemia.Further mechanistic studies indicated that the effects of HPPC on hemocyte proliferation and differentiation were closely related to the increase in JAK/STAT signaling and significant down-regulation ofGcmtranscription.After 20E hormone supplementation, expression of the hematopoietic factorGcmwas restored in blood cells with down-regulated JAK/STAT signaling; moreover,imbalance in circulating blood cell composition was improved.These results implied that endocrine hormones reversed the activation of related molecular pathways and rescued the effects of HPPC on circulating hemocyte homeostasis.Therefore, HPPC activates signaling pathways that affect blood cell homeostasis by a mechanism distinct from the effects of hyperglycemia, hyperlipidemia, and hypercholesterolemia.
Clinical studies on multiple myeloma that is secondary to hyperproteinemia have found that the JAK/STAT3 signaling pathway, which is abnormally activated by IL-6, plays an important role in promoting myeloma cell survival,proliferation, and drug resistance (Chong et al., 2019; Ren et al., 2019).At present, however, there is still a lack of in-depth research on the effects or mechanism of action on peripheral blood cells.Based on four clinical cases with elevated PPC,including patients with multiple myeloma, we found that compared with normal PPC samples, JAK/STAT pathway genes in blood cells were activated to varying degrees andGcmexpression was significantly reduced, with an imbalance in peripheral blood homeostasis.These observations supported the results that HPPC in silkworms activated the JAK/STAT signaling pathway in circulating blood cells.It is worth noting that whether JAK/STAT inhibition has therapeutic effects has not been tested in animal models, such as mammalian multiple myeloma, as hematopoietic toxicity can be produced through osteomyelitis, even in the absence of secondary HPPC.
Blood cell PCD is a common response of the body to hyperglycemia, atherosclerosis, hyperhomocysteinemia, and other metabolic diseases (Simion et al., 2020; Vion et al.,2017; Xi et al., 2016), with molecular mechanisms including the caspase-dependent mitochondria, endoplasmic reticulum stress, and death receptor-mediated apoptosis pathways(Mattisson et al., 2017; Xi et al., 2016).In addition, ROS, such as H2O2, hydroxyl radicals, and superoxide anions, can resist the adverse external environment and promote the bactericidal activity of phagocytes (Laforge et al., 2020; West et al., 2011); however, excessive production of ROS can cause continuous inflammation and promote blood cell apoptosis (Cui et al., 2018; Silwal et al., 2020).ROS formation is exacerbated in diabetic monocytes and macrophages,which are important factors in the progression of diabetes(Flynn et al., 2020; Rendra et al., 2019).In this paper, the density of granulocytes increased at 48 and 96 h after modeling and ROS levels in blood cells continued to increase,which may be important factors in the development of high PPC diseases.
In silkworm hemocytes, the PCD pathway depends on theexogenous apoptosis pathway mediated by death receptors expressed in the plasma membrane and the intrinsic apoptosis pathway controlled by mitochondria (Fuchs &Steller, 2015; Galluzzi et al., 2018).In the present study, along with the development of HPPC, autophagy and apoptosis of hemocytes were observed in the silkworm model, consistent with previous PCD research on silkworm showing that autophagy precedes apoptosis (Xie et al., 2016).In addition,we also found consistent low-level cell necrosis(Supplementary Figure S4).Interestingly, the main blood cells exhibiting autophagy, apoptosis, and proliferation in the AM group were granulocytes, indicating active HPPC-induced formation of new granulocytes and apoptosis of old granulocytes.At the same time, HPPC caused severe oxidative stress in the hemocytes, and the level of H2O2(main marker of ROS) increased.Mechanistic analysis indicated that HPPC led to an increase in calcium ion levels in hemocytes,which was typically time-dependent with blood cell apoptosis.This suggests that hemocyte PCD induced by the apoptotic signaling pathway of endoplasmic reticulum-calcium ion release was an active response.
CONCLUSIONS
HPPC induced ROS in hemocytes, and further to the PCD via the endoplasmic reticulum-calcium ion release signaling pathway.Conversely, HPPC activated the JAK/STAT signaling pathway in hemocytes to induce proliferation, mainly of granulocytes, and inhibited PCD in cells (Figure 8).Supplementation with 20E improved hematopoietic function and restored homeostasis of circulating hemocytes by modulating the JAK/STAT signaling pathway.
SUPPLEMENTARY DATA
Supplementary data to this article can be found online.
COMPETING INTERESTS
The authors declare that they have no competing interests.
AUTHOR CONTRIBUTIONS
G.W., Y.F.W., and S.Q.X.conceived and designed the study,conducted the primary analyses, and wrote the initial manuscript.G.W., Y.F.W., J.L.L., R.J.P., X.Y.L., X.D.C., and G.H.J.performed the experiments.S.Q.X., Y.F.W., G.H.J.,and Y.H.S.M.reviewed the findings.J.F.S., Y.H.S.M., X.D.C.,and S.Q.X.collected samples and helped analyze and interpret the data.S.Q.X.and G.W.were responsible for statistical analyses and manuscript revision.All authors read and approved the final version of the manuscript.
ACKNOWLEDGEMENTS
We thank Dr.Wei-Min Yin and Dr.Jian-Fen Qiu from Soochow University for their constructive suggestions.

- Zoological Research的其它文章
- Identification of global alternative splicing and sexspecific splicing via comparative transcriptome analysis of gonads of Chinese tongue sole (Cynoglossus semilaevis)
- Phylogenetic relationships of the zokor genus Eospalax(Mammalia, Rodentia, Spalacidae) inferred from wholegenome analyses, with description of a new species endemic to Hengduan Mountains
- MonkeyTrail: A scalable video-based method for tracking macaque movement trajectory in daily living cages
- Unknown species from China: The case of phrurolithid spiders (Araneae, Phrurolithidae)
- A new species of the gudgeon genus Microphysogobio Mori, 1934 (Cypriniformes: Cyprinidae) from Zhejiang Province, China
- High-quality chromosome-level genome assembly of Tibetan fox (Vulpes ferrilata)