
Peroxisome proliferator-activated receptor-alpha activation and dipeptidyl peptidase-4 inhibition target dysbiosis to treat fatty liver in obese mice
2022-06-11 09:08FlaviaMariaSilvaVeigaCarollineSantosMirandaIsabelaMacedoLopesVasquesMonteiroHenriqueSouzaTavaresFabianeFerreiraMartinsJulioBeltrameDalepraneVanessaSouzaMello
World Journal of Gastroenterology 2022年17期
Flavia Maria Silva-Veiga, Carolline Santos Miranda, Isabela Macedo Lopes Vasques-Monteiro, HenriqueSouza-Tavares, Fabiane Ferreira Martins, Julio Beltrame Daleprane, Vanessa Souza-Mello
Abstract
Key Words: Nonalcoholic fatty liver disease; High-fat diet; Peroxisome proliferator-activated receptor-alpha;Dipeptidyl-peptidase-4 -inhibitor; Dysbiosis; Inflammation
INTRODUCTION
The prevalence of obesity worldwide has tripled during recent decades, necessitating large budgets for public health systems due to associated comorbidities[1 ,2 ]. Excessive dietary saturated fat intake triggers insulin resistance, white adipocyte hypertrophy, low-grade inflammation (metainflammation),brown adipose tissue dysfunction (whitening), fatty liver, and, as more recently described, alteration in the composition of the gut microbiota (dysbiosis)[3 ,4 ].
The digestive tract is populated by several microorganisms, predominantly including bacteria from theFirmicutesandBacteroidetesphyla, and this population is influenced by the quality of the diet[5 ].Excessive saturated fat in the diet increases the proportion of gram-negative bacteria with lipopolysaccharides (LPS) in the composition of their outer wall[6 ]. LPS is an endotoxin that compromises the integrity of the intestinal mucosa through alterations in the structural proteins of tight junctions (TJs),resulting in increased intestinal permeability and the migration of LPS to other tissues[5 ,7 ].
The gut-liver axis comprises the anatomical communication between these two organsviathe portal vein[8 ]. A recent study by our group has demonstrated phylogenetic changes in the gut microbiota of mice after seventeen weeks of high-fructose diet feeding, with a significant increase in liver steatosis and inflammation, indicating the progression of nonalcoholic fatty liver disease (NAFLD) (fatty liver disease associated with metabolic dysfunction) to more harmful forms of liver diseases[9 ]. Given this scenario,the identification of metabolic pathways that rescue gut dysbiosis and mitigate the liver changes arising from a dietary excess of saturated fat is pertinent, considering the high prevalence of obesity, its deleterious health effects, and the fact that there is, thus far, no treatment directed exclusively toward NAFLD[10 ].
Peroxisome proliferator-activated receptors (PPARs) are transcription factors involved in several metabolic pathways. The pharmacological activation of the PPAR-alpha isoform promotes reduced body mass, increased insulin sensitivity, the formation of beige adipocytes[11 ], and a significant reduction in NAFLD by increasing mitochondrial beta-oxidation[9 ]. Recently, PPAR-alpha deletion promoted intestinal dysbiosis and inflammation in mice[12 ]. The dipeptidyl-peptidase-4 (DPP-4 )inhibitor linagliptin extends the glucagon-like peptide-1 (GLP1 ) time of action through beneficial brown and white adipocyte remodeling, browning induction, and M2 macrophage polarization, in addition to enhancing liver vascularization, supressingde novolipogenesis, and alleviating endoplasmic reticulum stress[13 ,14 ].
This study aimed to address the effects of PPAR-alpha activation and DPP-4 inhibition (isolated or combined) on the gut-liver axis, emphasizing inflammatory pathways in NAFLD management in highfat-fed C57 BL/6 J mice.
MATERIALS AND METHODS
Animals and diet
Adult male C57 BL/6 J mice were group-housed (n = 5percage) and maintained under controlled temperature (21 ± 2 °C) and humidity (60 ± 10 %) with free access to water and feed in a ventilated rack containing cages for the mice (NexGen mouse 500 , Allentown, PA, United States). The environment comprised a 12 /12 h light-dark period and air renewal cycles (15 min/h). The procedures followed the recommendations of the National Institutes of Health Guide for the Care and Use of Laboratory Animals (NIH publication No. 85 -23 , revised 1996 ) and were approved by our local Ethics Committee(Institute of Biology, CEUA number 041 /2018 ).
Experimental protocol
Fifty adult male C57 BL/6 J mice (3 month old) from the Central Biotery of the Federal Minas Gerais University were used in this study. Initially, the animals were randomly assigned to two nutritionally different groups: (1 ) Control group (C) - animals that received a control diet (14 % of energy as protein,10 % as fat, and 76 % as carbohydrates; total energy 15 KJ/g, n = 10 ); and (2 ) High-fat group (HF) -animals that received a high-fat diet (14 % of energy as protein, 50 % as fat and 36 % as carbohydrates;total energy 21 KJ/g, n = 40 ).
After twelve weeks, the C group and ten animals from the HF group continued the same food scheme for an additional five weeks, whereas the remaining animals from the HF group were randomly subdivided according to the treatment into the following groups: (1 ) HFA received the PPAR-alpha agonist (WY14643 , Sigma-Aldrich, 3 .5 mg/kg body mass) incorporated into the HF diet (n = 10 ) for five weeks; (2 ) HFL received the DPP-4 inhibitor (linagliptin, Boehringer Ingelheim, 15 mg/kg body mass)incorporated into the HF diet (n= 10 ) for five weeks; and (3 ) HFC received the combination of a PPARalpha agonist with a DPP-4 inhibitor (at the same doses used in the groups receiving monotherapy)incorporated into the HF diet (n= 10 ) for five weeks.
The entire experimental protocol lasted for 17 wk (12 wk of obesity induction + 5 wk of treatment).The doses of WY-14643 and linagliptin were based on previous experiments conducted by our group[4 ,9 ]. PragSoluções (Jaú, São Paulo, Brazil) produced the experimental diets according to the recommendations of the American Institute of Nutrition (AIN 93 M)[15 ]. All groups were treated following the order in which the groups were described.
Food/energy intake and body mass
Food intake was measured daily by subtracting the remainder of the diet verified on the following day from the amount of diet offered on the previous day. Energy intake comprised the product of the food consumption and the energy contained in 1 g of each diet (in kJ). Animal body masses were assessed on a digital scale once a week (BL-3200 H, precision 0 .01 g).
Metabolic analysis
One week before sacrifice, the animals were subjected to the oral glucose tolerance test (OGTT). Under a 6 -h fast (time 0 ) and after 15 , 30 , 60 , and 120 minutes of the orogastric gavage of a glucose solution (2 g/kg body mass), blood samples were obtained from the caudal vein. A manual glucometer (Accu-Chek, Roche, São Paulo, SP, Brazil) was used to measure the blood glucose levels at different times. The area under the curve (AUC) indicated the oral glucose tolerance (GraphPad Prism, version 8 .3 for Windows, GraphPad Software, La Jolla, CA, United States).
Sacrifice and ELISA
Mice were fasted for 6 h. Under intraperitoneal anesthesia with ketamine (240 mg/kg) and xylazine (30 mg/kg), blood samples obtained by cardiac puncture were separated by centrifugation (712 ×g) to obtain plasma samples to perform biochemical analyses. The liver, large intestine (cecum), and small intestine (jejunum and ileum) were carefully dissected, weighed, and analyzed following the protocols for different techniques.
An ELISA was performed to measure plasma GLP1 (multispecies GLP1 ELISA Kit Cat. #EZGLP1 T-36 K, Millipore, Missouri, United States), and LPS (multispecies LPS ELISA Kit Cat. #SEB526 Ge-96 T,Cloud-Clone Corp., Katy, United States). A semiautomatic spectrophotometer and a commercial kit(K117 , Bioclin, Quibasa, Belo Horizonte, MG, Brazil) were used to measure hepatic triacylglycerol (TAG)as previously described[16 ].
Histology
Liver and cecum fragments fixed in Millonig-buffered formalin (pH 7 .2 -7 .4 ) were subsequently dehydrated, diaphanized, embedded in Paraplast Plus (Sigma-Aldrich, St. Louis, MO, United States)and sectioned (5 μm thick) with a microtome. Slides stained with hematoxylin and eosin (liver) or Alcian Blue (Sigma Chemical Company-pH 2 .5 ) plus Periodic Acid-Schiff (PAS, intestine-Sigma Chemical Company) were photographed using a Leica DMRBE microscope (Wetzlar, Germany) and an Infinity Lumenera digital camera (Ottawa, ON, Canada). The images were analyzed in a blinded manner with STEPanizer (www.stepanizer.com) as described below:
Hepatic stereology:Five animalspergroup and ten imagesperanimal were analyzed. The volume density of liver steatosis [Vv (liver, st)] was estimated by the point-counting technique, following the formula: Vv (liver, st) = Pp (liver, st)/PT (Pp is the number of points that reached fat droplets, and PT is the total test points). The images were analyzed with STEPanizer using a 36 -point test system[17 ].
Gut stereology:The number of goblet cellsperarea [QA(goblet)] was estimated using STEPanizer. All goblet cells within the test area were counted, except those touching the forbidden lines. The result was divided by the test area measured in mm2.
1 6 S rDNA polymerase chain reaction amplification
The feces found in the mouse cecum were used to extract microbial DNA using the QIAamp Fast DNA Stool Mini Kit (Qiagen, Düsseldorf, Germany) according to the manufacturer's instructions. The DNA quantity, purity, and concentration were determined using Qubit (Life Technologies, Carlsbad,California, United States) and horizontal electrophoresis (1 % agarose gel). Real-time quantitative polymerase chain reaction (PCR) assays were used for the relative quantification of specific phyla of microorganisms (Bacteroidetes, Firmicutes, Actinobacteria, Proteobacteria) in fecal microbiota from the mouse guts by detecting 16 S rRNA genes. For relative quantification, the abundances of different phyla were normalized by theΔΔCt method relative to the total bacterial amount in the samples[18 ]. The indicators used are described in Table 1 .
Real-time reverse transcriptase–PCR
Total RNA was extracted from 50 mg of the liver and 70 mg of the small intestine (jejunum and ileum)using TRIzol reagent (Invitrogen, CA, United States). Afterward, the addition of 200 μL of chloroform was followed by centrifugation (1200 g for 10 min at 4 °C for liver samples and 12000 g for 15 min at 4 °C for intestine samples). The RNA extract portion was separated, and 500 μL of isopropanol was added and allowed to stand for 10 min (liver samples) or 15 min (intestine samples) to precipitate the RNA.Then, the samples were centrifuged (1200 g for 10 min at 4 °C for liver samples and 12000 g for 10 min at 4 °C for intestine samples). The isopropanol was removed, and the formed pellet was resuspended in 500 μL of 75 % ethanol for liver samples or 70 % ethanol (ice-cold) for intestine samples and then centrifuged (1200 g for 5 min at 4 °C for liver samples and 10000 g for 5 min at 4 °C for intestine samples).
The ethanol was removed, and the pellet was resuspended in 20 μL (liver)/50 μL (intestine) of deionized water (Milli-Q). The samples were subjected to a dry bath (50 °C for 5 min) and quantified by using Nanovue equipment (GE Life Sciences). For RNA transcription into complementary DNA(cDNA), 1 .0 μg RNA was treated with DNAse I (Invitrogen, CA, United States). First-strand cDNA synthesis was performed using Oligo (dT) primers for reverse transcriptase mRNA and Superscript III(both from Invitrogen). qPCR was performed using a CFX96 recycler (Bio-Rad, Hercules, CA, United States) and SYBR Green mix (Invitrogen, Carlsbad, CA, United States).Beta-actinwas used to correct the expression of the target genes in liver samples, andGapdhwas used for intestine samples. The primer sequences used are shown in Table 2 (liver) and Table 3 (intestine). All gene symbols are italicized (the first letter capitalized), and protein symbols are italicized in uppercase[19 ].
Data analysis
Sample size calculation considered that, in metabolic and molecular biology analyses, if a factorincreases or decreases in five replicates, the probability of occurrence isP= (1 /2 )5 = 0 .05 . Therefore, a minimum of 5 replicates was adopted for the analyses[20 ]. The data are shown as the mean and SD.During the first 12 wk, statistical analysis comprised Student’s t test and Welch's correction. At the treatment phase, data were analyzed using Brown-Forsythe and Welch one-way ANOVA with the Dunnett T3 post hoc test[21 ]. A P < 0 .05 was considered significant (GraphPad Prism version 8 .3 for Windows, GraphPad Software, La Jolla, CA, United States).
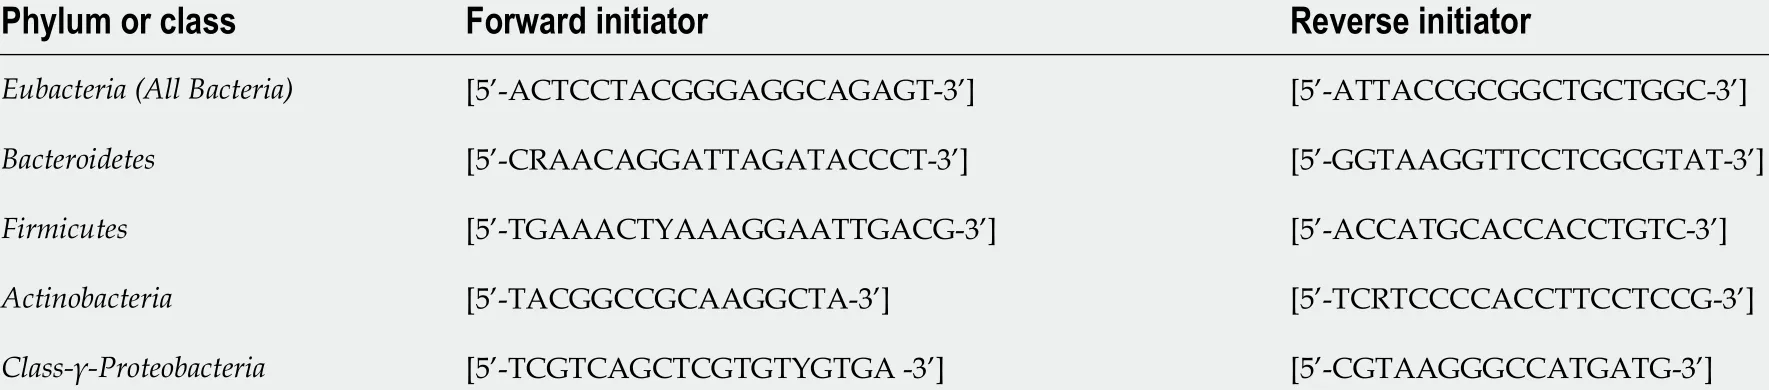
Table 1 Initiators of the phylum or class of microorganisms of gut microbiota
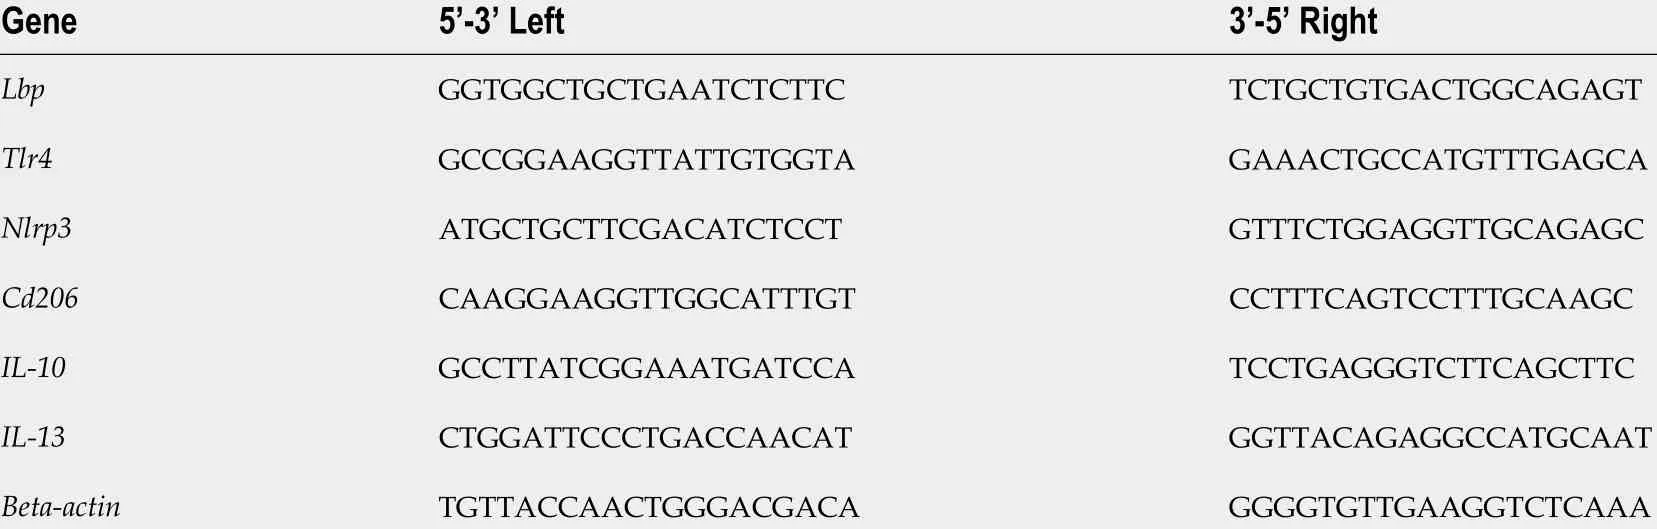
Table 2 Forward and reverse sequences of real-time reverse transcriptase–polymerase chain reaction primers–liver
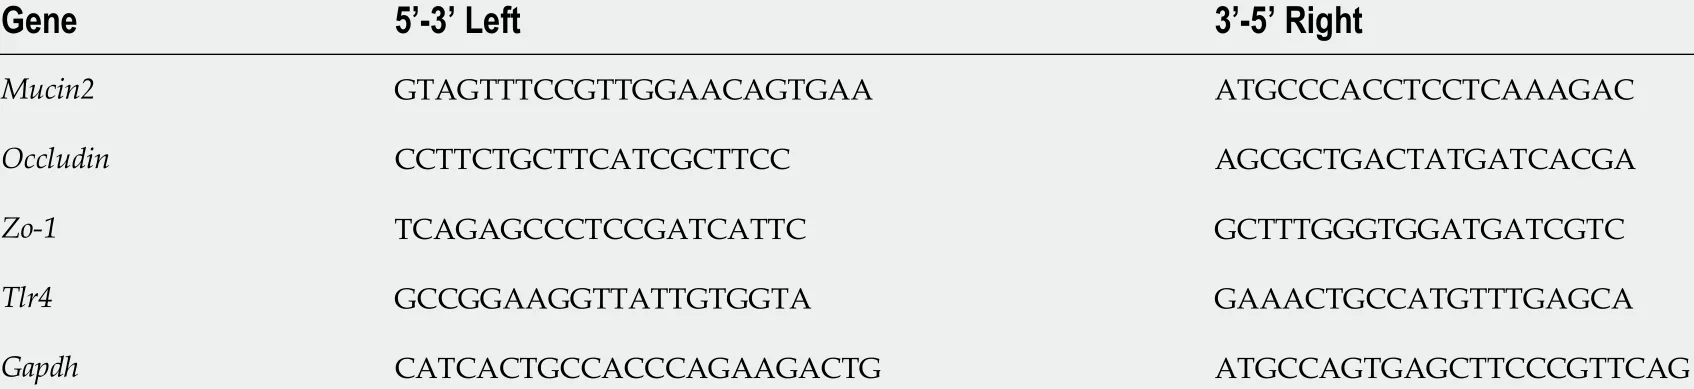
Table 3 Forward and reverse sequences of real-time reverse transcriptase–polymerase chain reaction primers–intestine
RESULTS
Treatment reduced body mass without altering energy intake
The animals in the C and HF groups had equal body mass (BM) at baseline. All animals tolerated the diets and treatments well. The protocol was maintained as previously stated. In the 13thweek, the HF group was overweight compared to the C group (+30 %), and this characteristic persisted until the end of the experiment. Figure 1 A depicts these results. Although food intake did not differ between the groups (Figure 1 B), the energy intake in the HF-fed groups was higher than that in the C group(Figure 1 C).
All proposed treatments rescued glucose tolerance and increased GLP1 concentrations
Figure 2 A shows the OGTT curve, in which the HF group showed a significant increase in fasting glucose (T0 ) compared to the C group. This difference remained until the end of the test (T120 ). The C group and the treated groups exhibited rescued baseline blood glucose levels at the other evaluation times (T30 , T60 , and T120 ). On the other hand, the HF group did not reach baseline glucose levels,indicating a delay after glucose overload and implying oral glucose intolerance, as confirmed by the higher AUC for OGTT in the HF group than in the C group (+23 %, Figure 2 B). In contrast, all treated groups showed lower AUCs than the HF group, indicating oral glucose intolerance alleviation.
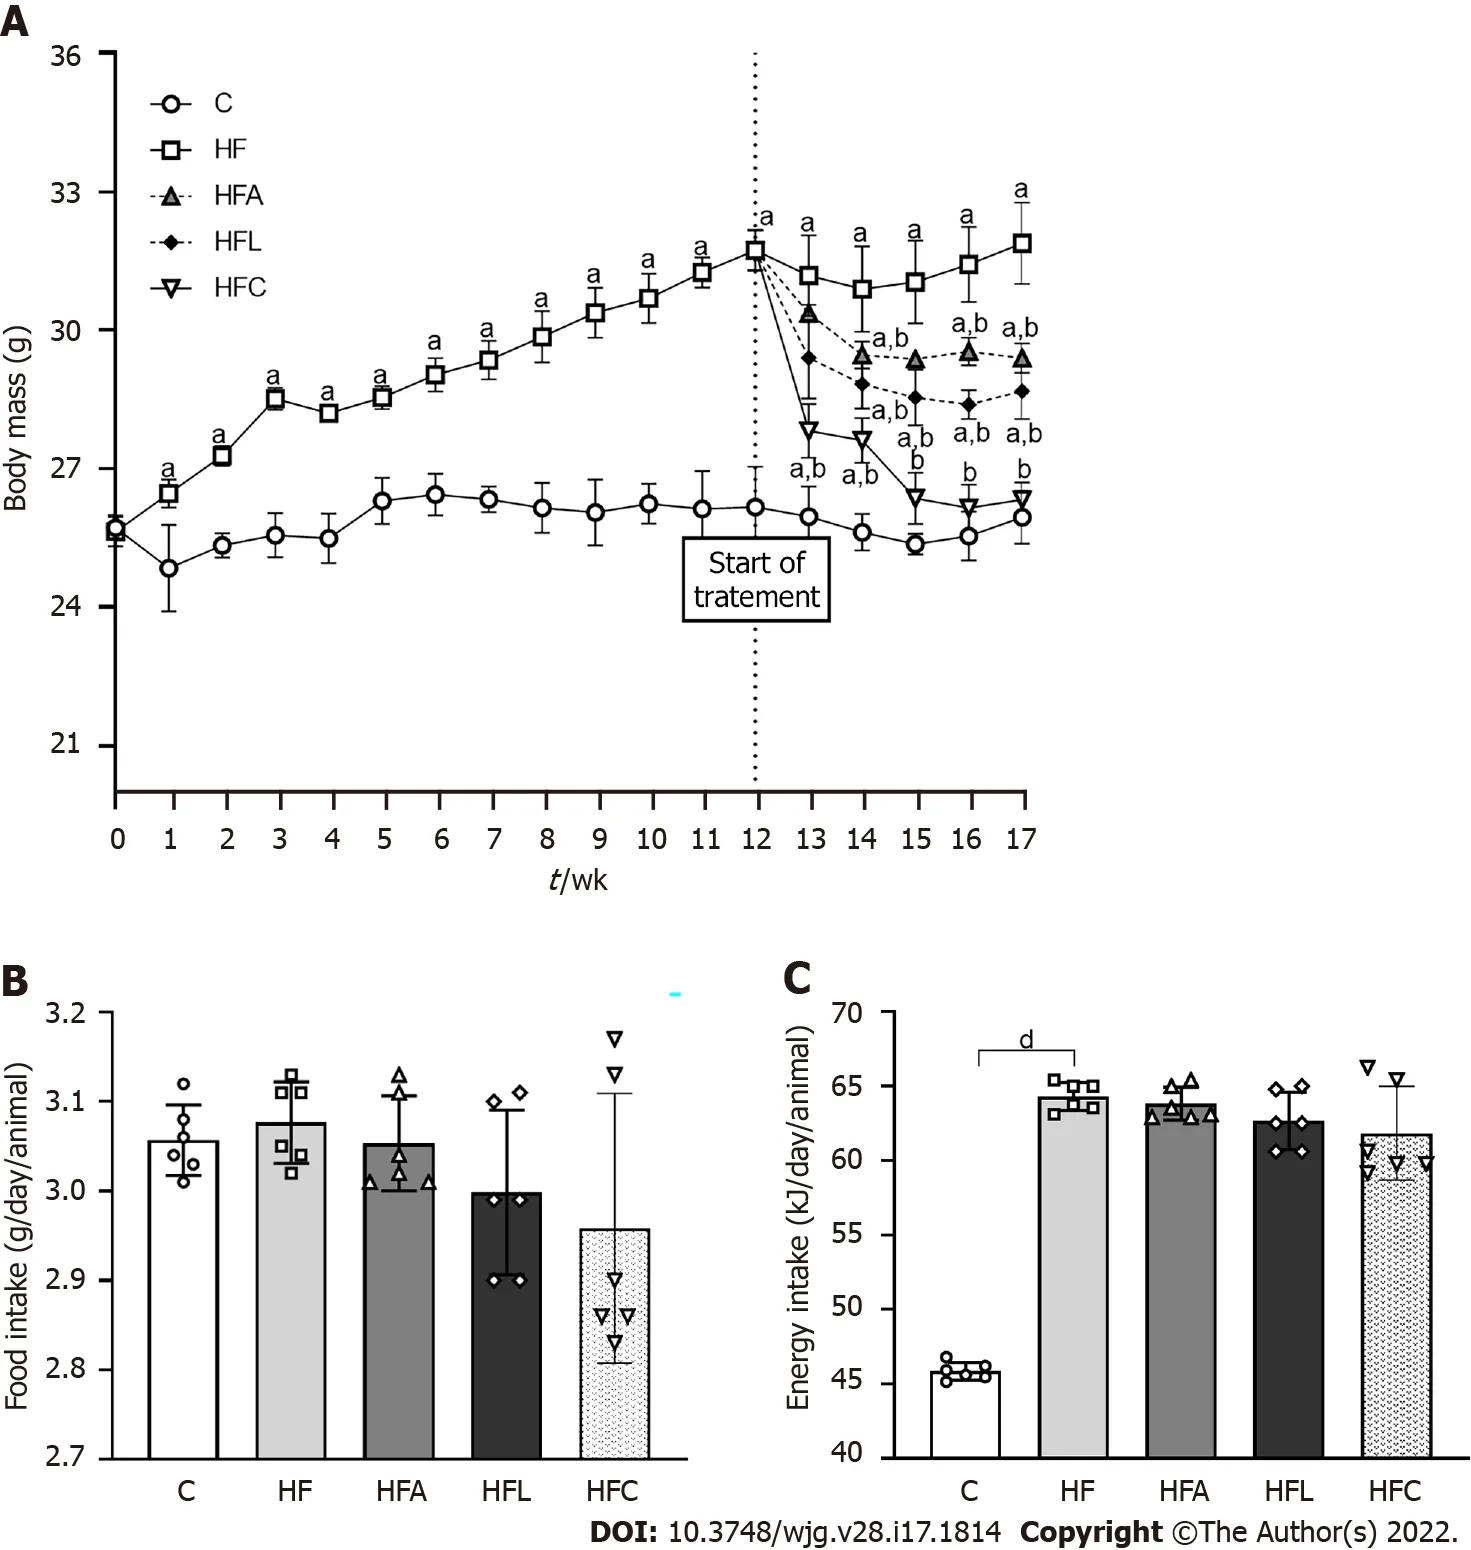
Figure 1 Body mass and food behavior. A: Body mass evolution; B: Food intake; C: Energy intake. Brown-Forsythe and Welch one-way ANOVA and Dunnett T3 post hoc test (mean ± SD, n = 6 ). Significant differences are indicated as follows: aP < 0 .05 ; bP < 0 .01 ; dP < 0 .0001 . C: Control diet; HF: High-fat diet; HFA: Highfat diet plus PPAR-alpha agonist (WY14643 ); HFL: High-fat diet plus DPP-4 inhibitor (linagliptin); HFC: High-fat diet plus the combination of WY14643 with linagliptin.
Plasma GLP1 concentrations diminished in the HF group compared to the C group (Figure 2 C). As expected, treatment with linagliptin enhanced GLP1 concentrations in the HFL group (+13 %), which also occurred in the HFC group and after the single treatment with the PPAR-alpha agonist in the HFA group compared to the HF group (Figure 2 C).
Treatments recovered the microbiota composition and reversed endotoxemia in HF-fed mice
The amplified 16 S rRNA genes of cecal gut bacteria were measured at the end of the experiment to evaluate the microbiota composition. The HF group showed aFirmicutesphylum increase coupled with decreases in theProteobacteriaandBacteroidetesphyla compared to the C group, as shown in Figure 3 A.However, all treatments reversed these phylogenetic alterations in the treated groups. The treatments restored the amount ofBacteroidetesto resemble that in the C group and caused a significant decrease inProteobacteria, which can play a decisive role in the beneficial effects observed due to the proposed treatments. Changes in the microbiota composition in the HF group triggered increased LPS concentrations (+10 %, Figure 3 B), while the HFL and HFC groups showed significantly reduced plasma LPS concentrations (-11 % for HFL vs HF and -12 % for HFCvsHF).
The hepatic mRNA expression of bothLbp(Figure 3 C) and Tlr4 (Figure 3 D) genes increased in the HF group compared to the C group, while the treated groups showed significantly reduced expression.
DPP-4 inhibitor and PPAR-alpha agonist improved the intestinal barrier structure and protection
The HF group showed an 80 % decrease in intestinal Mucin2gene expression compared with the C group. Conversely, the HFA, HFL, and HFC groups showed significant increases inMucin2expression(+439 % for HFA vs HF, +345 % for HFL vs HF, and +670 % for HFC vs HF; Figure 4 A).

Figure 2 Carbohydrate metabolism. A: Oral glucose tolerance test; B: Area under the curve for oral glucose tolerance test; C: Plasma glucagon-like peptide 1 concentrations. Brown-Forsythe and Welch one-way ANOVA and Dunnett T3 post hoc test (mean ± SD, n = 6 ). Significant differences are indicated as follows: aP <0 .05 ; cP < 0 .001 ; dP < 0 .0001 . C: Control diet; HF: High-fat diet; HFA: High-fat diet plus PPAR-alpha agonist (WY14643 ); HFL: High-fat diet plus DPP-4 inhibitor(linagliptin); HFC: High-fat diet plus the combination of WY14643 with linagliptin; AUC: Area under the curve; OGTT: Oral glucose tolerance test; GLP1 : Glucagon-like peptide 1 .
In agreement with the previous result, the HF group also had reduced intestinalZo-1(-38 %,Figure 4 B) and Occludin (-78 %, Figure 4 C) expression compared to the C group. On the other hand, the HFA group showed a 238 % increase inOccludinexpression, whereas the HFL and HFC groups had >500 % increases in the expression of this gene (Figure 4 C). Regarding Zo-1gene expression, all treated groups had a significant increase (+166 % for HFA vs HF, +397 % for HFL vs HF, and +102 % for HFCvsHF; Figure 4 B).
The high intake of saturated fat altered the histochemical pattern of the intestinal mucosal cells, as revealed by the reaction with Alcian Blue and PAS. Figure 4 D shows decreased mucus in the HF group,while the treatments elicited an increase in mucus production in the apical region of the crypts, followed by an increased presence of goblet cells (mucus-producing cells). Gut stereology confirmed these observations with the results of QA(goblet), which showed a reduction in the HF group compared to the C group (-44 %), while the HFA (+68 %), HFL (+47 %), and HFC (+56 %) groups showed an increase in the number of goblet cellspertissue area (Figure 4 E).
DPP-4 inhibitor and PPAR-alpha activation mitigated liver steatosis
HF-fed mice exhibited noticeable microvesicular liver steatosis, while mice in all treated groups showed liver steatosis mitigation, with the liver parenchyma resembling that in the C group (Figure 5 A).
In accordance with these histological findings, Vv (liver, st) in the HF group was higher than that in the C group (+38 %, Figure 5 B). All treated groups showed drastic reductions in liver steatosis (-72 % for HFAvsHF, -50 % for HFL vs HF, and -77 % for HFCvsHF).
Consistent with the stereological findings, hepatic TAG levels increased in the HF group (+38 %).Conversely, the treated groups showed lower hepatic TAG concentrations than that in the HF group (-11 % for HFA, -16 % for HFL, and -13 % for HFC; Figure 5 C).
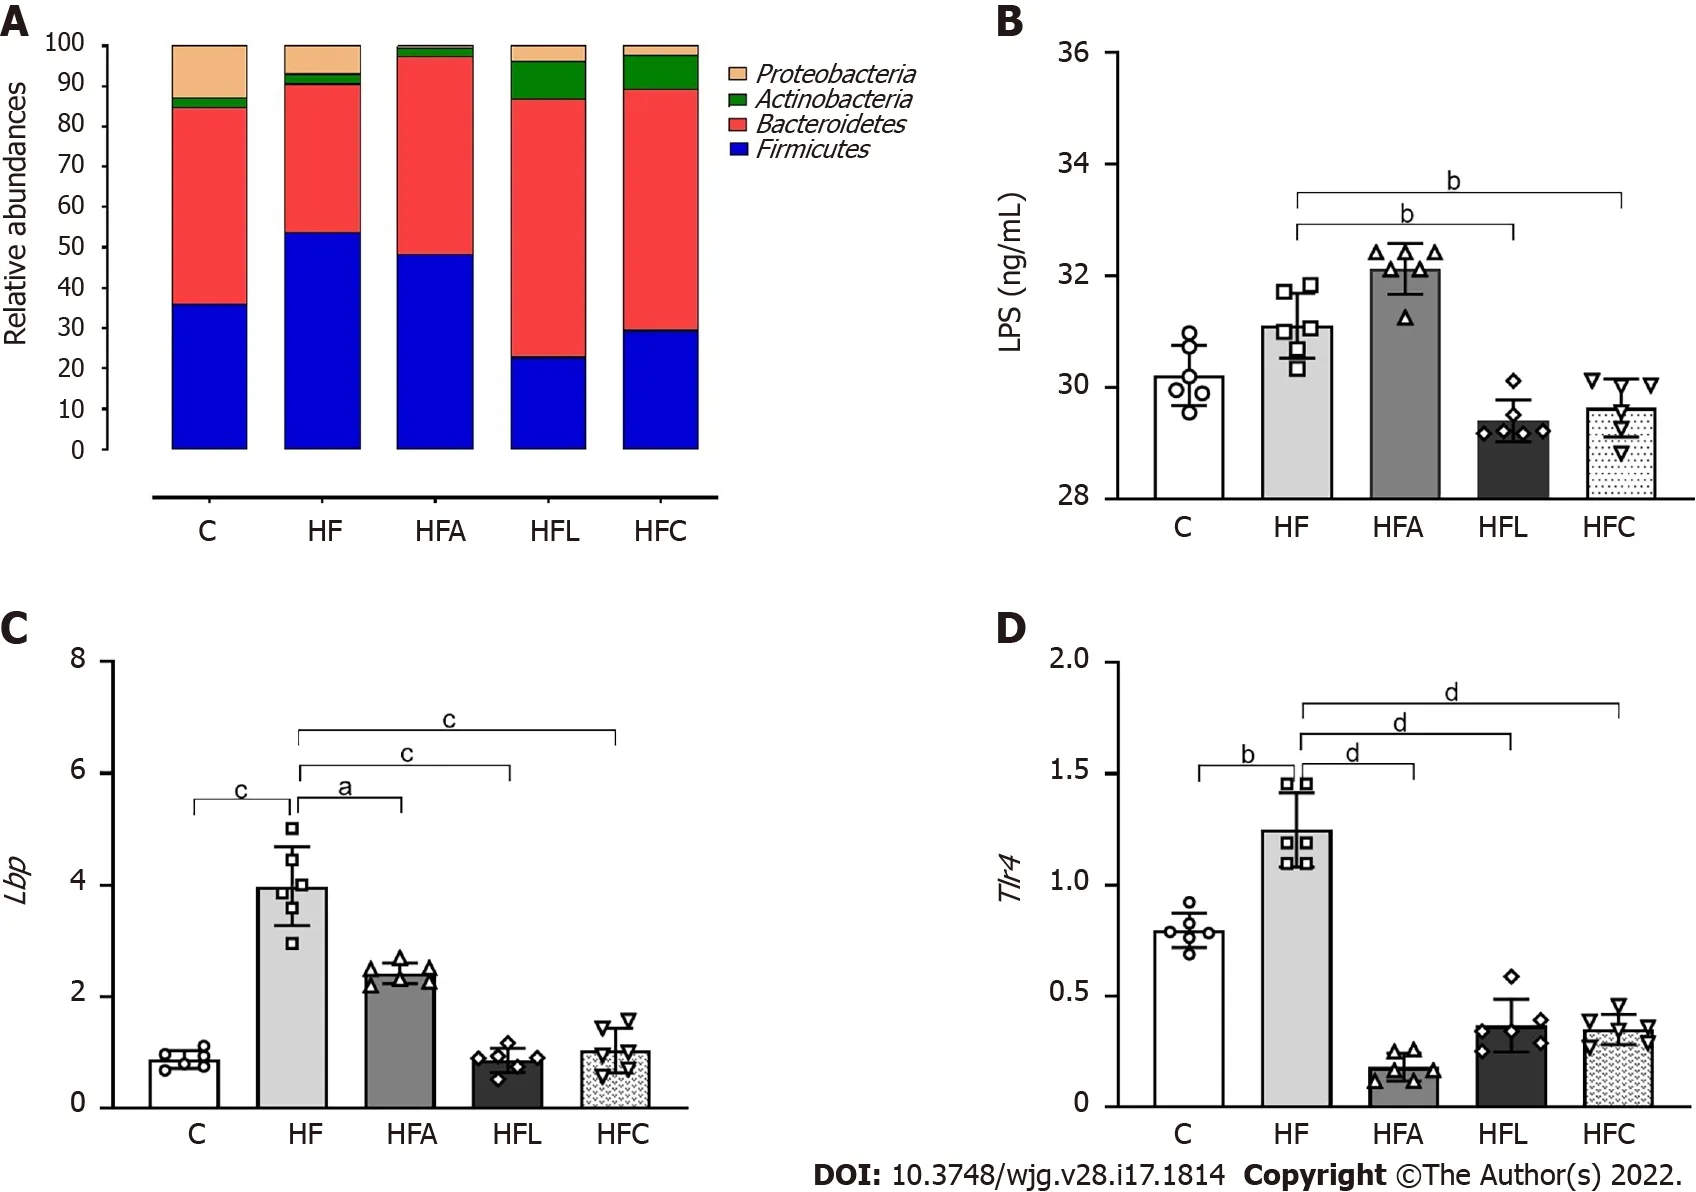
Figure 3 Gut-liver axis. A: Phylogenetic microbiota composition; B: Plasma lipopolysaccharide concentrations; C: Hepatic Lbp gene expression; D: Hepatic Tlr4 gene expression. Brown-Forsythe and Welch one-way ANOVA and Dunnett T3 post hoc test (mean ± SD, n = 6 ). Significant differences are indicated as follows: aP <0 .05 ; bP < 0 .01 ; cP < 0 .001 ; dP < 0 .0001 . C: Control diet; HF: High-fat diet; HFA: High-fat diet plus PPAR-alpha agonist (WY14643 ); HFL: High-fat diet plus DPP-4 inhibitor (linagliptin); HFC: High-fat diet plus the combination of WY14643 with linagliptin; LPS: Lipopolysaccharide.
DPP-4 inhibition and PPAR-alpha activation attenuated macrophage activation and reduced liver inflammation in HF-fed mice
The HF group showed higher expression ofCd206 , which is a specific marker of macrophages, than the C group (+103 %, Figure 6 A). In contrast, the treated groups showed reduced Cd206 expression (-67 % for HFAvsHF, -65 % for HFL vs HF, and -74 % for HFCvsHF).
In addition to theCd206 results, the HF diet significantly reduced IL-10expression compared to the C group (-54 %), whereas the combined treatment yielded an 80 % decrease in HFC IL-10expression compared to HF (Figure 6 B). Nlrp3 showed similar results to those of the Cd206 gene, with higher expression in the HF group than in the C group (+128 %) and reduced expression in the HFA (-72 %),HFL (-88 %), and HFC (-85 %) groups compared to the HF group (Figure 6 C).
Regarding theIL-13cytokine, the HF group exhibited a significant increase compared to the C group(+290 %). Only the HFA and HFC treatments were able to reduce the expression of this cytokine in comparison with the HF group (-39 % and -67 %) (Figure 6 D).
DISCUSSION
Excessive saturated fat intake causes overweightness, oral glucose intolerance, gut dysbiosis, and morphological and functional intestinal barrier alterations. Hence, HF animals had endotoxemia with proinflammatory signals directed toward the liver, causing substantial NAFLD. Single treatment with the PPAR-alpha agonist or DPP-4 inhibitor and the combined treatment yielded beneficial results,rescuing body mass, oral glucose tolerance, gut goblet cell numerical densityperarea,TJgene expression, phylogenetic microbiota distribution, and LPS concentrations. Thus, treated animals showed liver steatosis and inflammation mitigation due to gut dysbiosis and endotoxemia control.
The chronic ingestion of a diet with a high content of saturated fats increases body mass and impairs glucose and lipid metabolism[22 ]. Accordingly, HF-fed mice were overweight and showed oral glucose intolerance, along with difficulty in rescuing glycemic levels during the OGTT compared to the C group. These metabolic alterations were paralleled by gut dysbiosis in the HF group, confirming that dietary patterns interfere with the gut-liver axis, favoring NAFLD pathogenesis and progression.
The integrity of the intestinal barrier structure and function relates to the gut microbiota composition.The gut microbiota comprises a great diversity of symbiotic bacteria, whereas the intestinal barrier relies on junctional proteins that make this epithelium less permeable to pathogens and toxins. In this way,both mechanisms prevent metabolic dysregulation and contribute to maintaining gut homeostasis[23 -25 ].
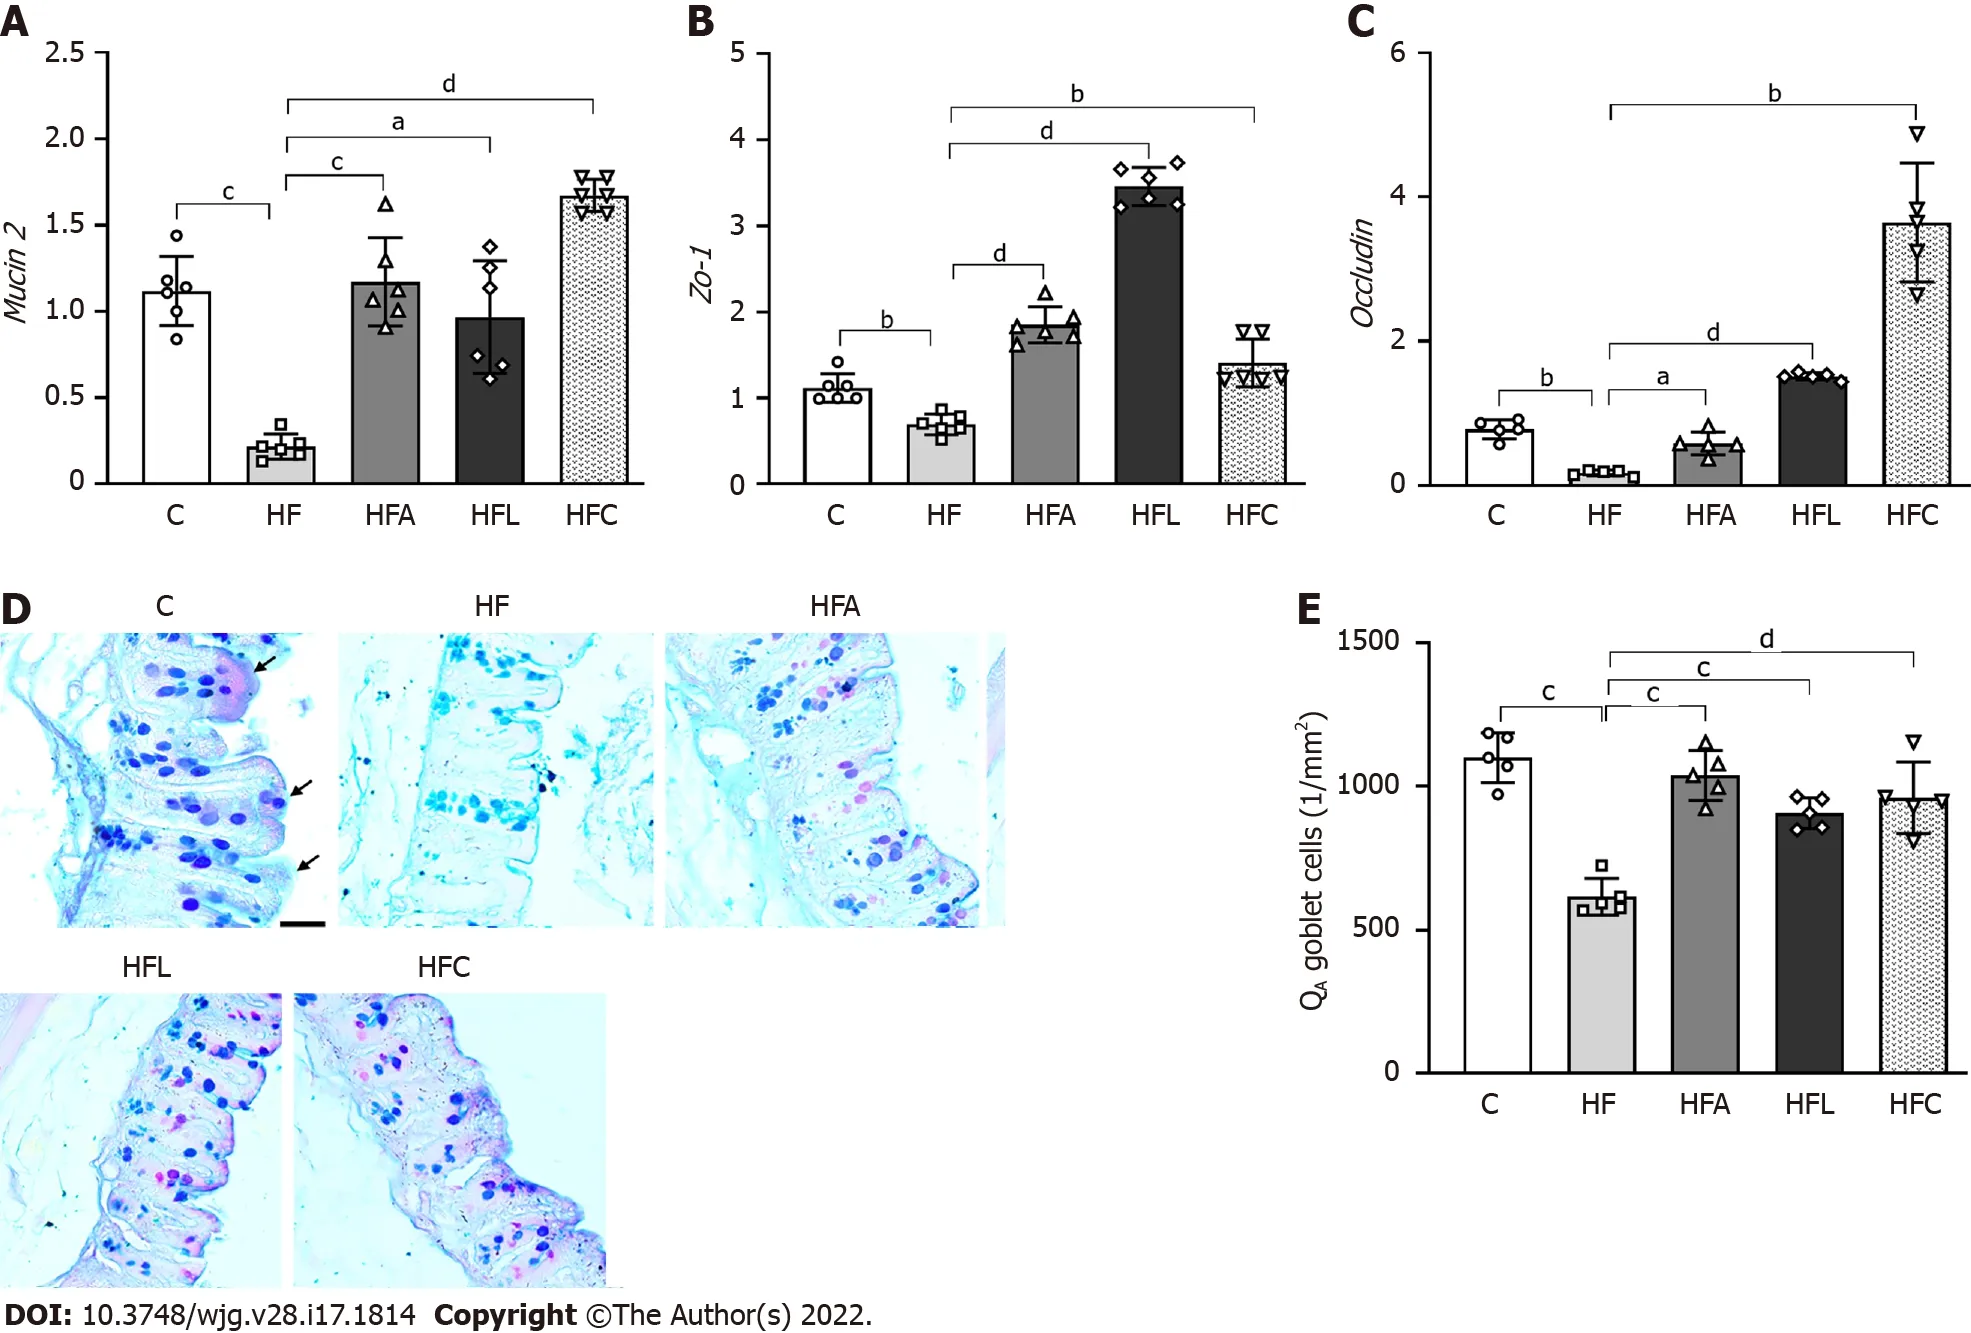
Figure 4 Gut gene expression, histology, and stereology. A: Gut Mucin2 ; B: Zo-1 ; C: Occludin gene expression; D: Large intestine stained with Alcian Blue and Periodic Acid-Schiff (PAS); E: Numerical density of goblet cells per area. Alcian blue and PAS stain glycoproteins produced by goblet cells (scale bar = 40 μm), which were markedly reduced by the high-fat diet and rescued by the treatments according to stereology (QA goblet). Brown-Forsythe and Welch one-way ANOVA and Dunnett T3 post hoc test (mean ± SD, n = 6 for real-time reverse transcriptase–polymerase chain reaction and n = 5 for stereology). Significant differences are indicated as follows: aP < 0 .05 ; bP < 0 .01 ; cP < 0 .001 ; dP < 0 .0001 . C: Control diet; HF: High-fat diet; HFA: High-fat diet plus PPAR-alpha agonist(WY14643 ); HFL: High-fat diet plus DPP-4 inhibitor (linagliptin); HFC: High-fat diet plus the combination of WY14643 with linagliptin; PAS: Periodic Acid-Schiff; QA:Numerical density per area.
Dysbiosis caused by the chronic consumption of fats is usually characterized by an increase inFirmicutesrelative toBacteroidetes, as shown by the HF group. These two phyla constitute more than 90 %of the phylogenetic category currently known and characterized in the intestine of experimental models[26 ]. Conversely, all treated groups showed a reduction in the quantitative percentage ofFirmicutes,especially the groups treated with the DPP-4 inhibitor and the combined therapy.
The rescuing of gut dysbiosis in the treated groups resulted in marked improvements in TJ gene expression. An HF diet also impairs the junctional components present in the intestinal epithelium,making it more permeable and consequently more susceptible to the translocation of microorganisms and toxins into systemic circulation. The increase in intestinal permeability is known as a leaky gut[25 ,27 ].
The leaky gut was rescued through enhanced expression of TJ genes in all treated groups. MUCIN2 knockout mice exhibit alterations in TJ structural proteins, in addition to mitochondrial damage and inflammation, which agrees with a leaky gut[28 ]. The treatments significantly augmented Mucin2 ,which is the major goblet cell gene responsible for mucin secretion, in addition to the gene expression of the TJsOccludinandZo-1[29 ]. PPAR-alpha has recently been described as essential for lipid droplet formation and crypt expansion in the intestine during chronic HF diet intake[30 ]. Sitagliptin, as a DPP-4 inhibitor, exerted protective effects on the intestinal barrier (highoccludinandZo-1levels) by GLP-2 induction in experimental colitis[31 ]. Herein, the combination of these drugs resulted in the highest intestinal expression ofMucin2andOccludin, indicating that adequate function of goblet cells and wellpreserved TJs may underlie the mechanisms involved in the beneficial results obtained in the HFC group.
HF diet intake also impairs the epithelium lining the intestinal mucosa. The goblet cells found in the intestinal villi and crypts are mucin producers that play a crucial role in protecting and lubricating the intestinal mucosa. The number of goblet cells indirectly reflects the ability to secrete mucus[25 ]. Herein,the HF diet caused a reduced number of goblet cellsperarea of the gut crypt, while all treatments reversed this alteration with the normalization of the numerical density of goblet cells andMucin2gene expression. Hence, the treatments supported intestinal barrier integrity and reduced the translocation of endotoxins, such as LPS, into systemic circulation, rescuing the mice from a condition called metabolic endotoxemia[32 ].
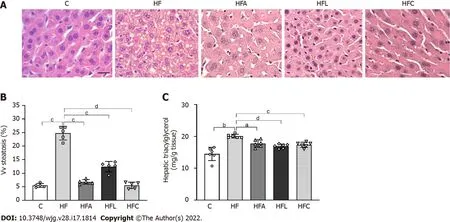
Figure 5 Liver histology, stereology, and biochemistry. A: Hematoxylin-eosin liver sections; B: Volume density (Vv) (liver steatosis); C: Hepatic triacylglycerol. Liver sections show widespread hepatic steatosis after chronic HF diet intake and expressive reduction in all treated groups (scale bar = 50 μm. Both stereology (Vv steatosis) and biochemical analyses (hepatic triacylglycerol) confirm these observations. Brown-Forsythe and Welch one-way ANOVA and Dunnett T3 post hoc test (mean ± SD, n = 6 for biochemistry and n = 5 for stereology). Significant differences are indicated as follows: aP < 0 .05 ; bP < 0 .01 ; cP < 0 .001 ; dP <0 .0001 . C: Control diet; HF: High-fat diet; HFA: High-fat diet plus PPAR-alpha agonist (WY14643 ); HFL: High-fat diet plus DPP-4 inhibitor (linagliptin); HFC: High-fat diet plus the combination of WY14643 with linagliptin; Vv: Volume density.
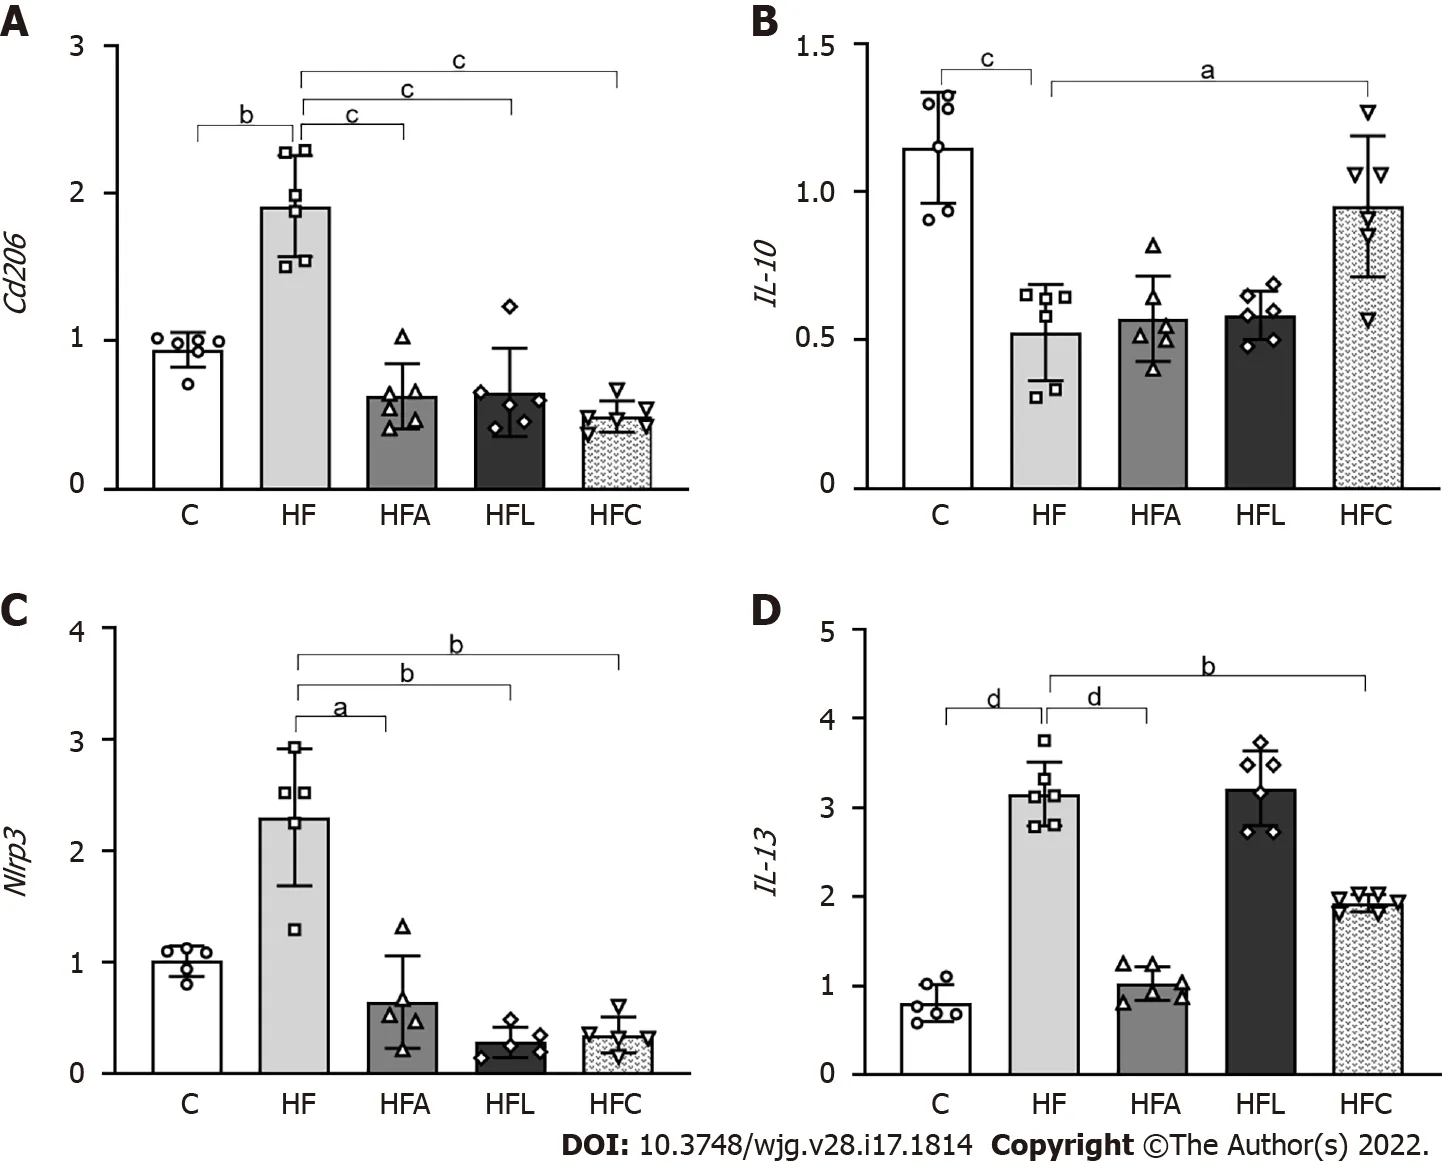
Figure 6 Liver gene expression. A: Cd206 ; B: IL-10 ; C: Nlrp3 ; D: IL-13 . Brown-Forsythe and Welch one-way ANOVA and Dunnett T3 post hoc test (mean ± SD,n = 5 or 6 ). Significant differences are indicated as follows: aP < 0 .05 ; bP < 0 .01 ; cP < 0 .001 ; dP < 0 .0001 . C: Control diet; HF: High-fat diet; HFA: High-fat diet plus PPAR-alpha agonist (WY14643 ); HFL: High-fat diet plus DPP-4 inhibitor (linagliptin); HFC: High-fat diet plus the combination of WY14643 with linagliptin.
The high translocation of endotoxins derived from the gut microbiota induces Toll-like receptor (TLR)activation. LPS is the most common pathogen-associated molecular pattern (PAMP), and its binding to TLR4 is catalyzed by lipopolysaccharide-binding protein (LBP), which is mainly expressed in the liver and adipose tissue[32 ].
LPS stems from the destruction of the bacterial cell wall. An increase in LPS in systemic circulation triggers the release of proinflammatory cytokines and an inadequate amplification of the immune response, causing tissue damage[26 ]. An increase in plasma LPS levels was observed in the HF group,characterizing the involvement of the epithelium with a consequent increase in intestinal permeability,making the epithelium more permeable to the entry of microorganisms. Additionally, we showed that hepaticLbpandTlr4gene expression increased in the HF group, inducing the translocation of cytokines associated with inflammation and changing hepatic lipid metabolism, reconfiguring this metabolism to become a potent inducer of fatty liver, and contributing to the pathogenesis of NAFLD.
In contrast, the treatments normalizedLbpandTlr4expression, with both emerging as targets for NAFLD treatment. The DPP-4 inhibitor alogliptin suppressed TLR4viaERK activation, resulting in decreased matrix metalloproteinases and proinflammatory cytokines in U937 histiocytes[33 ]. Sitagliptin was previously shown to attenuate NAFLD by suppressing inflammation and insulin resistance due to TLR4 /NF-kB pathway downregulation in diabetic rats[34 ]. PPAR-alpha activation by WY-14643 mitigated liver steatosis in high-fructose-fed mice by reducing LPS concentrations, improving the intestinal barrier ultrastructure, upregulating hepatic beta-oxidation, and suppressing lipogenesis in mice[9 ].
A recent study showed that systemic LBP blockade or decreased LBP levels in the liver normalized glucose homeostasis, mainly by reducing fasting glucose levels, without changing adiposity or liver steatosis[35 ]. In this study, the group treated with the PPAR-alpha agonist as monotherapy did not show reduced LPS concentrations. However, the treatment reducedLbpexpression, producing antiinflammatory and anti-steatotic effects similar to those of the other treatments.
In this context, macrophages play roles in acute and chronic inflammatory liver diseases.Macrophages have receptors, such as CD163 and CD206 , which participate in the phagocytosis of harmful substances. Due to its high affinity for macrophages, CD206 is a potential biomarker of hepatic macrophage (Kupffer cells) activation, which indicates inflammation and fibrosis in chronic liver diseases[36 ]. In response to LPS and other stimuli, the metabolic profile of macrophages and dendritic cells stimulates the glycolytic pathway, resulting in the metabolic accumulation of citrate and succinate,which, in turn, regulate the gene expression of cytokines such as interleukin 10 (IL-10 )[37 ]. Recent evidence shows that IL-10 may play a dual role in some contexts by stimulating the immune response rather than suppressing it. However, the cytokine IL-10 has emerged as an anti-inflammatory mediator determining the protection of its host in response to pathogens[38 ].
Our results showed thatCd206 macrophages were activated in the HF group, reinforcing the idea that the chronic consumption of this type of diet activates inflammatory pathways that contribute to the development of liver disease. In contrast, the groups treated with the PPAR-alpha activator and DPP-4 inhibitor showed reduced expression ofCd206 macrophages, conferring a protective effect against the activation of inflammatory pathways. Recent evidence showed that highly fibrous livers had a higher density ofCd206 macrophages[36 ]. IL-10 gene expression was reduced in the HF group. However, only the combined treatment increasedIL-10 expression, implying that the isolated treatments might have acted through another anti-inflammatory pathway. IL-13 overexpression in HF diet-fed mice is a pathway related to fatty liver and insulin resistance onset. Combined treatment and PPAR-alpha activation alone markedly reduced hepaticIL-13 expression, which combined with reduced macrophage activation and glycemic homeostasis to alleviate fatty liver[39 ].
Concerning inflammasomes, NLRP3 is present mainly in immune and inflammatory cells, such as macrophages, monocytes, dendritic cells, and neutrophils, after activation by inflammatory stimuli.NLRP3 is activated by numerous PAMPs, such as hyperglycemia, fatty acids, bacterial toxins, and bacterial and viral nucleic acids[40 ]. Studies in macrophages and animal models have shown that oxidized low-density lipoproteins and cholesterol crystals trigger NLRP3 activation. In macrophage and type 2 diabetes animal models, glucose and free fatty acids trigger inflammasome activation, damaging glucose metabolism and favoring insulin resistance[41 ]. Thus, NLRP3 may contribute to the appearance and progression of several diseases related to metabolic syndrome.
In this study, we showed that treatment with the PPAR-alpha agonist and DPP-4 inhibitor produced a potent anti-inflammatory effect in the liver, as they demonstrated reduced gene expression ofNlrp3andCd206 . The blockade of NLRP3 has recently improved NAFLD and mitigated liver fibrosis in two models of steatohepatitis[42 ], highlighting the proposed treatments as viable tools to control fatty liver.Two DPP-4 inhibitors were previously shown to suppress NLRP3 in human macrophages by downregulating the TLR4 -IL-1 beta pathway[43 ]. Sitagliptin alleviated liver injury caused by thioacetamide in mice by decreasing NLRP3 and exerting anti-apoptotic effects[44 ]. Regarding PPAR-alpha activation,oleoylethanolamide protected against LPS-induced liver injury in mice by suppressing NLRP3 [45 ].However, the present study is the first to report the effects of both drugs and their combination on the gut-liver axis in HF-fed mice. Figure 7 summarizes our main findings.
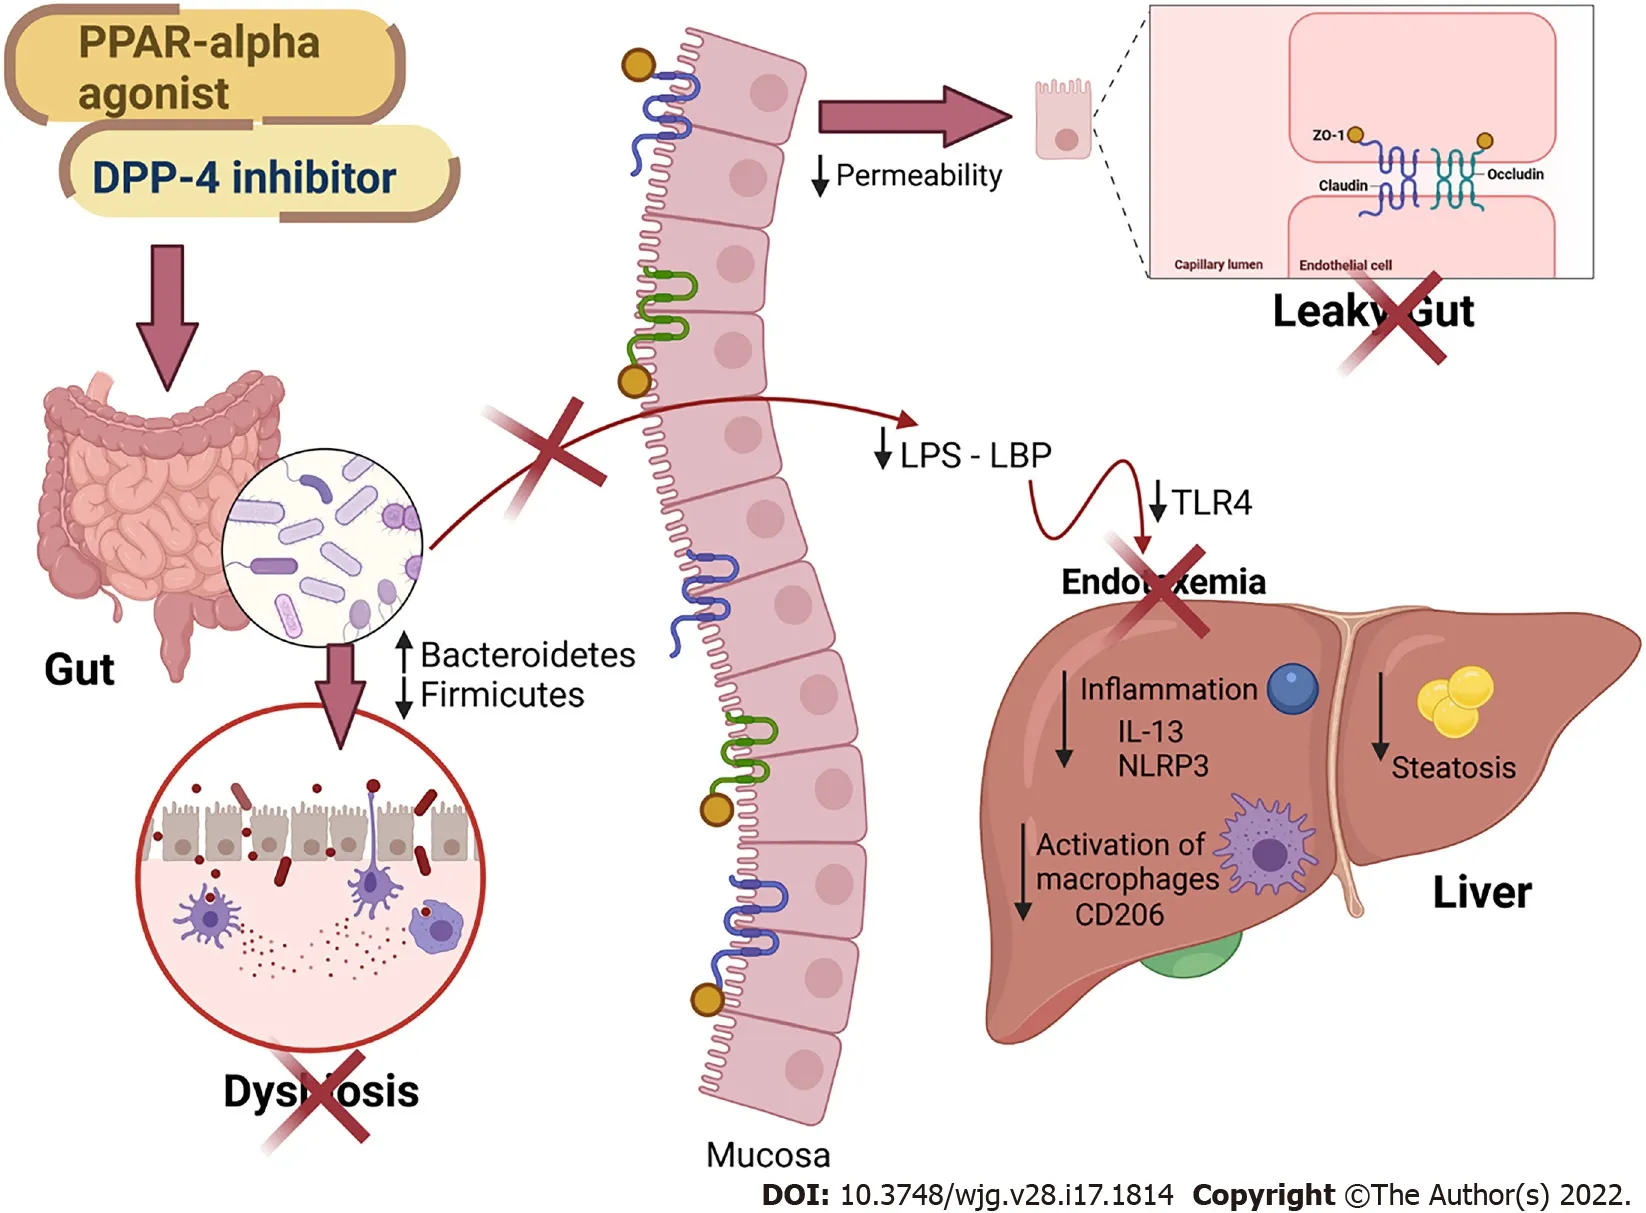
Figure 7 Main findings of the study. All treatments alleviated fatty liver by countering gut dysbiosis and rescuing the intestinal barrier integrity. The reduced lipopolysaccharide (LPS) influx to the liver caused reduced inflammasome and CD206 macrophage activation. Peroxisome proliferator-activated receptor-alpha activation and DPP-4 inhibition can be regarded as viable tools to treat leaky gut and prevent LPS-driven hepatic steatosis. PPAR: Peroxisome proliferator-activated receptor; DPP-4 : Dipeptidyl peptidase-4 ; LPS: Lipopolysaccharide; LBP: Lipopolysaccharide-binding protein; TLR4 : Toll-Like receptor 4 ; ZO-1 : Zonula occludens 1 ;NLRP3 : NLR family pyrin domain containing 3 ; CD206 : Cluster of differentiation 206 ; IL: Interleukin. Created with Biorender: www.biorender.com.
Some limitations of the present study comprise the absence of female mice evaluations to determine possible sexual dimorphism, the lack of plasma glucose concentration measurements, and the inability to determine LBP concentrations, although its gene expression was evaluated. Future research should also include the evaluation of genera and families in theProteobacteriaphylum, as it seems to be involved in the harmful evolution of NAFLD.
CONCLUSION
In conclusion, HF-fed mice showed impairment of the intestinal barrier and alteration in the phylogenetic diversity of the gut microbiota, leading to dysbiosis, and contributing to the influx of LPS into the liver. An impaired gut-liver axis favors liver damage, making the liver more susceptible to NAFLD through proinflammatory signals (Tlr4and Nlrp3 upregulation). Treatment with the PPARalpha agonist and the DPP-4 inhibitor modulated the gut microbiota and rescued intestinal barrier gene expression and goblet cell numerical density, reducing endotoxemia and liver steatosis through antiinflammatory signaling. Given the beneficial effects of the treatments found, these treatments have become possible therapeutic strategies for the NAFLD spectrum of diseases.
ARTICLE HIGHLIGHTS
Research motivation
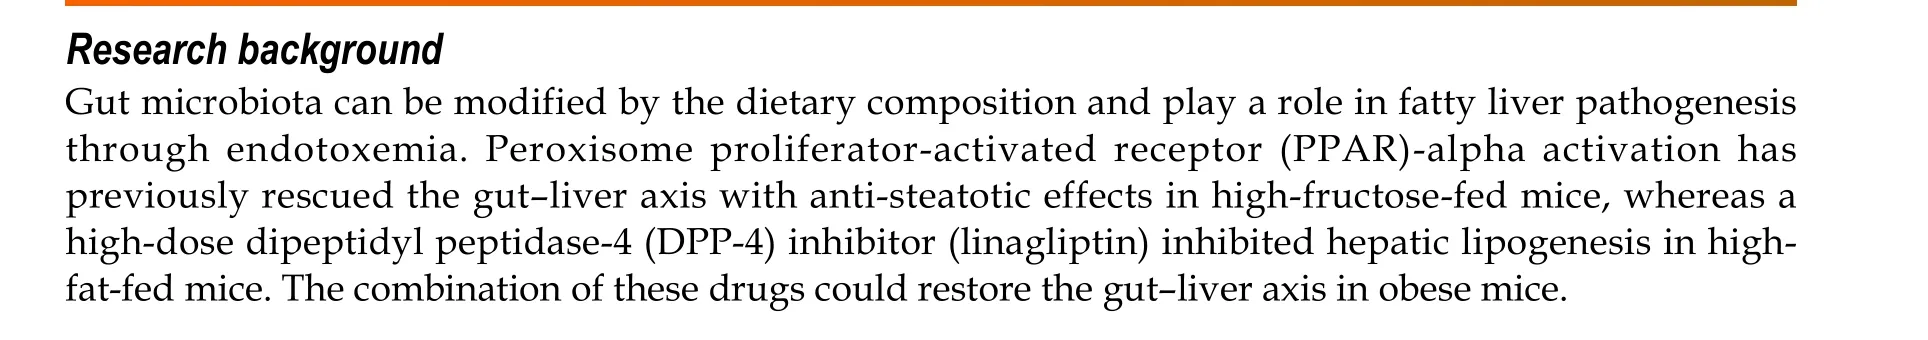
Nonalcoholic fatty liver disease (NAFLD) is highly prevalent among obese individuals and can evolve into harmful liver diseases. Currently, there is no treatment directly prescribed to counter NAFLD.Herein, we propose a drug combination (PPAR-alpha agonist plus DPP-4 inhibitor) that can alleviate fatty liver by modulating the gut-liver axis with anti-inflammatory properties.
Research objectives
To evaluate the effects of monotherapy with a PPAR-alpha agonist (WY14643 ) or a DPP-4 inhibitor(linagliptin) and their combined treatment on the gut-liver axis, highlighting the intestinal barrier,endotoxemia, and inflammatory pathways in the livers of high-fat-fed mice. These preclinical insights can help establish new strategies for the treatment of NAFLD.
Research methods
Mice were fed a control diet (C, 10 % of energy as lipids) or a high-fat diet (HF, 50 % of energy as lipids)for 12 wk. Then, the HF group was randomly divided into four groups: HF, HF-A (treated with the PPAR-alpha agonist), HFL (treated with the DPP-4 inhibitor), and HFC (treated with the combination of both drugs). The treatments lasted for five weeks. The gut-liver axis was assessed by histological,biochemical, stereological, and molecular techniques.
Research results
The HF diet yielded overweightness and oral glucose intolerance, altered gut microbiota composition,and decreased the numerical density of goblet cells and tight junction gene expression, with increased plasma lipopolysaccharide (LPS) concentrations and increased fatty liver. The combined treatment rescued all of these metabolic alterations by restoring the gut microbiota and intestinal barrier markers,resulting in decreased LPS concentrations and fatty liver through anti-inflammatory signals. Further studies may focus on theProteobacteriaphylum, whose alteration can trigger harmful signaling to the liver.
Research conclusions
The combination of PPAR-alpha activation with DPP-4 inhibition yielded marked anti-steatotic effects by modulating the gut-liver axis, with reduced endotoxemia and amelioration of the intestinal barrier histology and gene expression. In turn, the livers of obese mice treated with the drug combination benefited from downregulation of theTlr4and Nlrp3pathways and exhibited a hepatic parenchyma similar to that in the C group. Of note, we used stereology to estimate the numerical density of goblet cells in cecum slides stained with Alcian Blue and Periodic Acid-Schiff. This technique can be used to assess the effects of different interventions on the intestinal barrier and leaky gut in further studies.
Research perspectives
This study brings novelty to the treatment of NAFLD, which is a challenge to the scientific community.Our results confirm the importance of the gut-liver axis in the pathogenesis of fatty liver and propose a combined treatment that targets the gut microbiota composition, endotoxemia, and intestinal barrier alterations to alleviate fatty liver through local anti-inflammatory effects in HF-fed mice.
ACKNOWLEDGEMENTS
The authors would like to thank Aline Penna for her technical assistance.
FOOTNOTES
Author contributions:Silva-Veiga FM, Martins FF, Daleprane JB, and Souza-Mello V designed and coordinated the study; Silva-Veiga FM, Miranda CS, Vasques-Monteiro IML, Souza-Tavares H, Martins FF, Daleprane JB, and Souza-Mello V performed the experiments, acquired and analyzed data; Silva-Veiga FM, Miranda CS, Vasques-Monteiro IML, Martins FF, Daleprane JB, and Souza-Mello V interpreted the data; Silva-Veiga FM and Souza-Mello V wrote the manuscript; all authors approved the final version of the article.
Supported byCoordenação de Aperfeiçoamento de Pessoal de Nível Superior-Brasil, No. CAPES-Finance Code 001 ;Fundação Carlos Chagas Filho de Amparo à Pesquisa do Rio de Janeiro (FAPERJ) to Souza-Mello V, No. E-26 /202 .657 /2018 and No. E-26 /010 .002136 /2019 ; The corresponding author is supported by Conselho Nacional de Desenvolvimento Científico e Tecnológico (CNPq), No. 303785 /2020 -9 .
Institutional review board statement:The study was reviewed and approved by the CEUA of State University of Rio de Janeiro Institutional Review Board, No. 041 /2018 .
Conflict-of-interest statement:The authors have no conflict of interest to declare.
Data sharing statement:Technical appendix, statistical code, and dataset available from the corresponding author at souzamello.uerj@gmail.com.
ARRIVE guidelines statement:The authors have read the ARRIVE Guidelines, and the manuscript was prepared and revised according to the ARRIVE Guidelines.
Open-Access:This article is an open-access article that was selected by an in-house editor and fully peer-reviewed by external reviewers. It is distributed in accordance with the Creative Commons Attribution NonCommercial (CC BYNC 4 .0 ) license, which permits others to distribute, remix, adapt, build upon this work non-commercially, and license their derivative works on different terms, provided the original work is properly cited and the use is noncommercial. See: https://creativecommons.org/Licenses/by-nc/4 .0 /
Country/Territory of origin:Brazil
ORCID number:Flavia Maria Silva-Veiga 0000 -0002 -3320 -5825 ; Carolline Santos Miranda 0000 -0001 -5488 -0179 ; Isabela Macedo Lopes Vasques-Monteiro 0000 -0003 -1729 -3201 ; Henrique Souza-Tavares 0000 -0001 -79314384 ; Fabiane Ferreira Martins 0000 -0002 -3831 -6604 ; Julio Beltrame Daleprane 0000 -0002 -3493 -1386 ; Vanessa Souza-Mello 0000 -0002 -2510 -9569 .
S-Editor:Fan JR
L-Editor:A
P-Editor:Li X
 World Journal of Gastroenterology2022年17期
- World Journal of Gastroenterology的其它文章
- Current status and future of targeted peptide receptor radionuclide positron emission tomography imaging and therapy of gastroenteropancreatic-neuroendocrine tumors
- Biliary metal stents should be placed near the hilar duct in distal malignant biliary stricture patients
- Clinical outcomes of endoscopic papillectomy of ampullary adenoma: A multi-center study
- New insights in diagnosis and treatment of gastroenteropancreatic neuroendocrine neoplasms
- Gut homeostasis, injury, and healing: New therapeutic targets
- Sirtuin1 attenuates acute liver failure by reducing reactive oxygen species via hypoxia inducible factor 1 α