
Simulation of crowd dynamics in pedestrian evacuation concerning panic contagion: A cellular automaton approach
2022-06-29 09:16GuanNingWang王冠宁TaoChen陈涛JinWeiChen陈锦炜KaifengDeng邓凯丰andRuDongWang王汝栋
Chinese Physics B 2022年6期
Guan-Ning Wang(王冠宁) Tao Chen(陈涛) Jin-Wei Chen(陈锦炜)Kaifeng Deng(邓凯丰) and Ru-Dong Wang(王汝栋)
1Institute of Public Safety Research/Department of Engineering Physics,Tsinghua University,Beijing 100084,China
2Department of Electronic Engineering,Tsinghua University,Beijing 100084,China
3Hefei Institute for Public Safety Research,Tsinghua University,Hefei 230601,China
Keywords: hazard,panic contagion,evacuation,cellular automaton
1. Introduction
Nowadays,the process of urbanization in the world continues to accelerate,resulting in more high-rise buildings and urban complexes. With it the gathering frequency of highdensity people in public places has been increasing.Due to the turbulent nature of dense crowds,the disorderly flow of people is peculiarly prone to stampede accidents. A case in point is a stampede incident occurred in Chenyi Square in Shanghai on December 31,2014,during which 36 people died and 49 were injured. Another example is a fire in the “Kiss” nightclub in Santa Maria, Brazil on January 27, 2013, killing 233 people together with other 106 injuries. These incidents caused massive casualties and adverse social impact. Crowded stampede accidents of this kind mentioned above are more than often closely related to crowd panic caused by emergencies. With overwhelming panic, the individual’s ability to perceive the environment and to make decisions is greatly reduced. The individual reduces or even abandons some of the usual and crucial ways of evacuation,waywardly choosing to follow and push, which produces partial disorder and instability of the flow of people,leading to a stampede.[1–3]Therefore,it is crucial to probe into the dynamic process of panic contagion and understand the coupling mechanism of panic contagion and evacuation process of pedestrians to establish effective evaluation strategies and reduce casualties.
Recently, researchers mainly use experiments and simulation models to do their research in this field. They have used evacuation accidents data to analyze the stampede revolving around the pilgrims to Mecca,[4]the phenomenon of “people waves” in the World Cup auditorium,[5]the “9.11” incident.[6–9]Evacuation experiments in different scenarios such as classrooms,[10–12]corridors,[13–16]bottlenecks,[17–19]and invisible environments[20–22]were also carried out through experiments. Animals,including mice,[23]ants,[24]sheep[25]were also used successfully in some experiments to investigate the dynamic characteristics of crowd evacuation.However,different from traditional evacuation experiments, the panic evacuation study depends more on the type and development trend of the emergency,so it is difficult for experimental methods to quantitatively define the spread of panic. In order to analyze the crowd evacuation dynamics in the presence of a hazard,and to study the coupling mechanism of the panic propagation and evacuation, the simulation technology was chosen to conduct this research. In the development of evacuation simulation models, two main ideas dominate it. One is the force-based model, also known as the acceleration-based model. Social force model (SFM)[26]proposed by Helbing in 2000 is the major one of most forcebased models. The other is the rule-based model,which is to pre-set the interaction rules and logic between individuals and the environment,which prompts the crowd move according to these established rules. A cellular automaton model is a typical rule model firstly independently proposed by Blue[27]and Fukui,[28]and afterwards it has been greatly adopted due to its simple calculation, wide application range, and its convenience to change the rule.[29–31]
Compared with an ordinary pedestrian flow, the panic pedestrian evacuation presents the characteristics of the higher crowd density, the stronger interaction, and its obvious psychological impact.As a matter of fact,the simulation approach of the panic evacuation is mostly an improved one based on the general pedestrian flow research method. Helbinget al.[32]added a panic factor in the range[0,1]on the basis of the social force model,and systematically studied the crowd evacuation process. Fuet al.[33]combined the epidemiological SIR model with the cellular automaton model,divided the individual’s mind-set into’ infected, susceptible and recovered , and made a study of the the process of panic propagation and the corresponding evacuation characteristics. On the basis of the cellular automaton model, Liet al.[34]added the panic factor described by the linear function and the exponential function to simulate the jamming phase in a pedestrian counter flow.Zhenget al.[35,36]researched the herd behavior in the evacuation process, and compared the evacuation time under different conditions by setting up a game-theoretical model. Caoet al.[37]adopted discrete emotion values in the cellular automaton model to simulate and calculate the evacuation time in different scenarios. Chenet al.[38]used the cellular automaton model to study the panic evacuation behavior of pedestrians against the background of artificial attacks. In addition to typical models above, other models were also proposed to study the panic evacuation. Battyet al.[39]proposed a psychological model of crowd movement,which simulated the actual observation data of the people participating in the carnival during the Notting Hill Carnival in London,and offered some strategies to limit the overcrowding of the crowd. Based on the BUMMPEE simulation model, Kooet al.[40]added a panic factor to understand the changes in the mental state and the physical fatigue of evacuated individuals. Gabrielet al.[41]introduced some new parameters based on the BioCrowds model, researched the transition of the crowd from a comfortable state to a panic state, and simulated the Hill’s borough massacre in England in 1989. In addition,scholars have also suggested the magnetic field force model,[42]the centrifugal force model,[43]and the snowdrift game model[44]for the panic evacuation research.All these models focus on the evacuation process of pedestrians in panic,and tend to provide effective strategies and suggestions for the emergency management.
Currently several models are available to describe the way panic spreads, but they do not consider it quantitatively, and the coupling mechanism of panic dynamic propagation of the crowd and the regarding evacuation process are not considered as well. In fact,if there is a hazard in a room,pedestrians who are closer will quickly fall into a panic state, and transmit the panic mood to other people around during the evacuation process, making the panic spread among the crowd. In addition, panic also has its own growing and decaying process. In fact, pedestrians will spontaneously feel panic when facing hazards. And the degree of pedestrian panic is related to the location of the hazard, the exit location, and surrounding pedestrians. That is to say, pedestrian will show different panic evacuation behavior under the influence of varying degrees of panic, as well as its contagion process. Moreover,hazard positions could make a difference on evacuation,which will influence the pedestrians’mental states, having a further impact on evacuation performance. There is a fact that,when pedestrians are more familiar with the room layout, they are escaping more unhurriedly. So how this environmental familiarity works on the panic contagion and evacuation behaviors is deserved to study. Hence, the goal of this paper is to build a new approach to better understand pedestrian panic mechanism under the threat of a hazard and offer some protective guidance to ensure the safety of civilians.
In this paper,an extended field cellular automaton model is established to simulate the crowd panic propagation when a hazard occurs in a building. Moreover, the coupling mechanism of the panic spread and its evacuation behavior is also investigated in Sections 2 and 3. In Section 2, the panic contagion model is constructed based on the cellular automaton model inspired by SIR model,and its simulation rules are introduced. The simulation results for the coupling process of the panic contagion and its evacuation behavior with several key parameters are presented in Section 3. With Section 4,the final conclusion is drawn.
2. Model
The crowd panic evacuation is modeled by cellular automata. We consider the room with the size ofL×L,and there is a narrow exit at the bottom of the room with the size ofW,as seen in Fig.3(a). And,we also consider that there is a hazard located at somewhere in this room. Basically,pedestrians can escape from the room by moving toward the exit. Each cell is occupied by an evacuee with the size of 0.4 m×0.4 m,either can be empty or occupied by a hazard. At each discrete time step, pedestrians remain unmoved, or continue to move according to the transition probabilitiesPij. The initial crowd density is given byρ. Once a hazard appears,pedestrians tend to move away from the hazard quickly and go to the nearest evacuation exit to escape. It is assumed that pedestrians within a certain distance from the hazard will fall into a state of extreme panic,called panic transmission status(PTS).Then evacuees in PTS can transmit the panic to evacuees around them within a certain distanceRuntil their panic value exceeds a certain threshold which makes them into PTS.As the crowd gathers,panic will accelerate the dynamic spread. Furthermore,panic can significantly affect pedestrians’decisionmaking ability in the process of evacuation. Once a simulation starts,evacuees basically move away from the hazard and move to the exit. We useρ=0.1,W=2, andL=50 unless otherwise noted.In the following subsections,the original SIR model is introduced,a panic contagion model is proposed,and the behaviors of pedestrians are studied respectively.
2.1. Original SIR model
The SIR model proposed by Kermack and McKenErick[45]is the most classic epidemiological model. In the model,the population is divided into 3 categories,namely,susceptible (S), infected (I), and recovered (R) individuals.The establishment of the SIR model is mainly based on the following dynamic equations:
whereS,I, andRare the number of susceptible individuals,the number of infected individuals, and the number of individuals removed respectively. The transmission coefficientβrepresents the infection rate between infected and susceptible people.The recovery rate of the infected is defined asγ.Equation(1)indicates that the total number of infected,susceptible,and recovered individuals is a constant.The SIR model clearly shows the dynamics of the infectious diseases spread. The panic contagion shows great similarities with the infectious diseases. Therefore,a panic propagation model is constructed based on the original SIR model as follows.
2.2. Panic contagion model
The emergency evacuation inevitably produces the panic among pedestrians,which show strong propagation ability and affect the evacuation process directly. As it is all known that the degree of panic is affected by the types of emergencies,the architectural space, and the crowd density. Therefore, pedestrians are extremely sensitive to the hazards and the location of exits,which also directly affect the panic propagation. The closer to the hazard, the faster the pedestrian’s panic will increase and accumulate. It is also true that the closer pedestrians to exits, the faster they will become less panic. In addition,pedestrians within a certain distance from the hazard will fall into PTS,who can spread panic to others around. Subsequently,there will be more and more evacuees in PTS,leading to a significant contagion of the panic. However, the panic will also be attenuated in time series. Therefore, the distance among pedestrians,an exit and the hazard,the interaction between pedestrians, and the evacuation time are considered in this panic contagion model. In summary,the quantification of the pedestrian panic during an evacuation is shown as
whereDis the global panic control coefficient,which controls the overall panic fluctuation range of pedestrians and which is quoted from the research of Chen.[38]In order to reflect the danger level of the hazard,the range ofDis set from 0 to 10 in this model which determines the number of PTS pedestrians in initial evacuation scene before evacuation. That means,whenD=0, there are no PTS pedestrians in the room, and whenD=10,almost all the evacuees in the room are PTS pedestrians. So parameterDalso reflects the global panic degree of pedestrians in the room.αis the adjustment coefficient, adjusting the distance impact of an exit and the distance impact of a hazard source has the same level of magnitude, which is set as 0.05 in this model.[38]βis the sensitive coefficient of time, which controls the decaying process of the panic over time. According to some psychology researches, the panic symptoms duration can vary from seconds to hours.[46]So in this model,βis set as 0.001, which means that panic value needs approximately 11.5 minutes to decay from 1 to 0.5.leis the distance between the pedestrian(i,j)and the exit in the room,andlois the distance between the pedestrian(i,j)and a hazard.Aijrepresents the cumulative value of the panic emotion transmitted from surrounding pedestrians in PTS.In this model, if a pedestrian’ panicij >0.8, then he will be in PTS,and if a pedestrian’panicij >1,then panicij=1.
Equation(6)characterizes the dynamic propagation process of panic.Lkis the distance between the pedestrian in PTS and the pedestrian out of PTS.In this paper,it is assumed that the panic transmission range is a circular area with a radius ofR=2 m,that is,the maximum radius length is 5 cells,shown in Fig. 1(a).Npis the maximum transmission panic value in the panic transmission area.In this model,Np=4.4835,which is used to adjustAijso that it lies in the interval [0, 1]. As shown in Fig.1(b),pedestrians in PTS are represented by red cells,and their panic transmission area is a circular area with a radius ofR. When there are multiple PTS pedestrians, the panic of a pedestrian out of PTS transmitted by pedestrians in PTS accumulates until it reaches the PTS threshold.

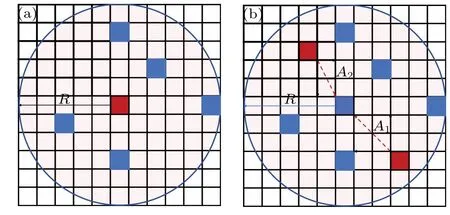
Fig.1. (a)The panic transmission range of pedestrians in PTS is a circular area with a radius of R. (b) Pedestrians in PTS transmitted panic motion to pedestrians out of PTS. For example, a pedestrian at the center receives panic value A1 and A2 from 2 PTS pedestrians.
2.3. Pedestrians movement
At each time step, the pedestrian evacuation process in the room is affected by the surrounding environment,hazards,safety exits and the movement of other pedestrians around.Same as the classic floor field model,the pedestrian decisionmaking process during the evacuation is determined by the socalled transition probabilities,expressed by Eq.(7). The transition probabilities are determined by the static floor field and the hazard threat floor field. The static floor field is mainly considered in terms of the influence of the building structure on the evacuees,while the hazard threat floor field focuses on the impact of the hazard on the evacuation of pedestrians. In this model, the Moore neighborhood is chosen to study the motion probability of pedestrian cells, which is composed of a central cell and 8 neighboring cells, as shown in Fig. 2(a).Therefore,the transition probability of cell(i,j)is determined by a 3×3 matrix ofPi j,as shown in Fig.2(b). Under the guidance of transition probabilities, pedestrians prefer to move in a cell that has a high floor field.

In Eq.(7),Nrepresents the normalization factor to ensure that the transition probability range of cell (i,j) falls in the [0, 1]interval.SijandHi jrepresent the static floor field and the hazard threat floor field of cell(i,j)respectively,representing two behaviors of pedestrians,namely,going to the safety exit and the avoiding the hazard. Theksandkhrespectively represent the sensitivity coefficient of the corresponding two fields.These two coefficients determine the weight of each field,and their value range is(0,1].ni jrepresents whether the cell(i,j)is occupied. When occupied,ni j=1 and when empty,nij=0.In the model established in this paper,because the above two floor fields jointly determine the operation process of pedestrian(i,j),the sensitivity coefficients of these two fields have the following constraint conditions,as shown in Eq.(7).

Because panic affects people’s decision-making process and thus their evacuation behavior,in this model the panicijof each evacuee directly affects his two coefficients,namelyksandkh.As shown in Eqs. (9)–(11),ksinandkhinrepresent the initial values of responding two floor fields sensitive coefficients respectively, and they are affected by the panicij. The model initially setsksin=0.6,khin=0.4 unless otherwise noted.
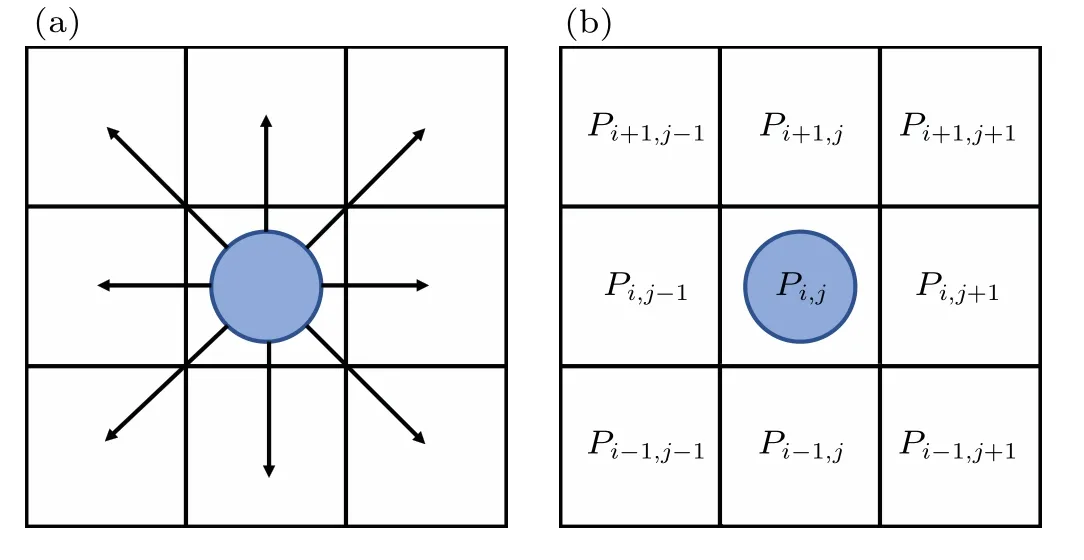
Fig.2. (a)Moore neighborhood. (b)Transition probabilities matrix of Pi j.
In Eq.(9),ksinrepresents the pedestrian familiarity of the environment andkhinreflects the degree of perception of hazard.ais the sensitive coefficient of panic emotion, which is set as 0.5 in this paper.Sdenotes the sum value of the static floor field and the hazard threat floor field. That is to say,ksandkhdynamically update with the change of panicijwhich is calculated by Eq.(5).

Through Eq. (9)–(11) above, it is clear thatkswill decrease if the pedestrian’s panicijincreases,resulting in a decrease in the weight of the static floor field,making it more difficult for pedestrians to find their way to the exit. At the same time,khwill become larger with panicijincreasing, meaning that there is an increase in the weight of the hazard floor field.In this case, pedestrians tend to give a priority to keep away from danger. To sum up,the panicijproduces a big difference on each sensitivity coefficient, and then indirectly affects the pedestrian evacuation behavior.
2.4. The static floor field
In a room, the static floor field does not change with the time step and also is not changed by pedestrians. Fact is it is closely related to the structure of the room and the position of the exit. In this model, equation (12) is used to calculate the static floor field of cell(i,j). It is clear that,theSijof the exit is the largest,which will prompt pedestrians to go to the exit.
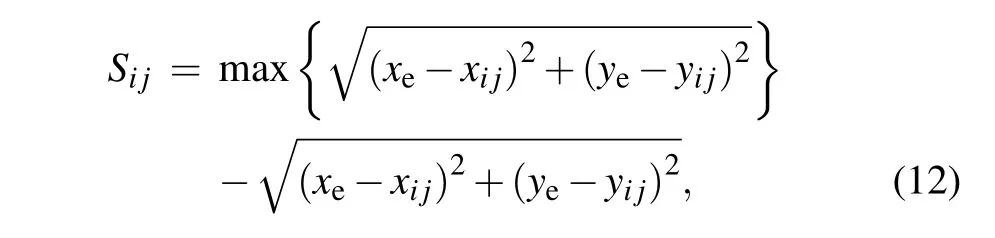
where subscript e represents exit.xeandyedenote coordinate the values of the exit,andxi jandyi jrepresent the coordinate values of cell(i,j)respectively.
2.5. The hazard threat floor field
The occurrence of emergencies in the building manifests obvious spatial characteristics, in other words, the position
where it occurs is relatively fixed. Therefore, same with the static floor field, the hazard threat floor field will not evolve with time steps and be modified by pedestrians. There is no doubt that pedestrians prefer to move away from the hazard and the regions of space where it is far away from the hazard are more attractive. Thus, the hazard threat floor field is set to be directly proportional to the distance from the hazard,as illustrated below:

where subscript h denotes the hazard in the room.xhandyhdenote coordinate values of hazard, andxijandyijrepresent the coordinate values of cell(i,j)respectively.
3. Results and discussion
As shown in Fig. 3(a), the extended cellular automaton model is tested in a cellular space of 50×50 cells and pedestrians are distributed randomly who try to escape from the exit in the bottom. A hazard is located in the center of the room at first. It is observed,that the pedestrians within 2 m from hazard immediately fall into PTS state due to the influence of the hazard as illustrated in Fig. 3(a). Figures 3(b) and 3(c) illustrate the static floor field and the hazard threat floor field of the room respectively. In addition, figure 3(d) is the panic field before this simulation starts. Once the simulation starts, the pedestrians are affected by the panic propagation according to Eqs. (9)–(11). At the same time, the panic contagion is also affected by the evacuee evacuation behavior. Here,pedestrian panic behaviors and the effects of several key parameters on pedestrian flow are investigated. Results for each scenario are averaged 20 independent simulations.

Fig.3. (a)Schematic illustration of the room. Hazard is located at the center,and pedestrians around the hazard within 2 m fall into PTS state.(b)The static floor field of the room. (c)The hazard threat floor field of the room. (d)The panic field at the t=0 s.
3.1. Effect of global panic control coefficient D
As mentioned above, the degree of pedestrian panic and its spreading speed in this model are controlled by coefficientD.Therefore,the influence of pedestrian panic is studied by adjustingD.
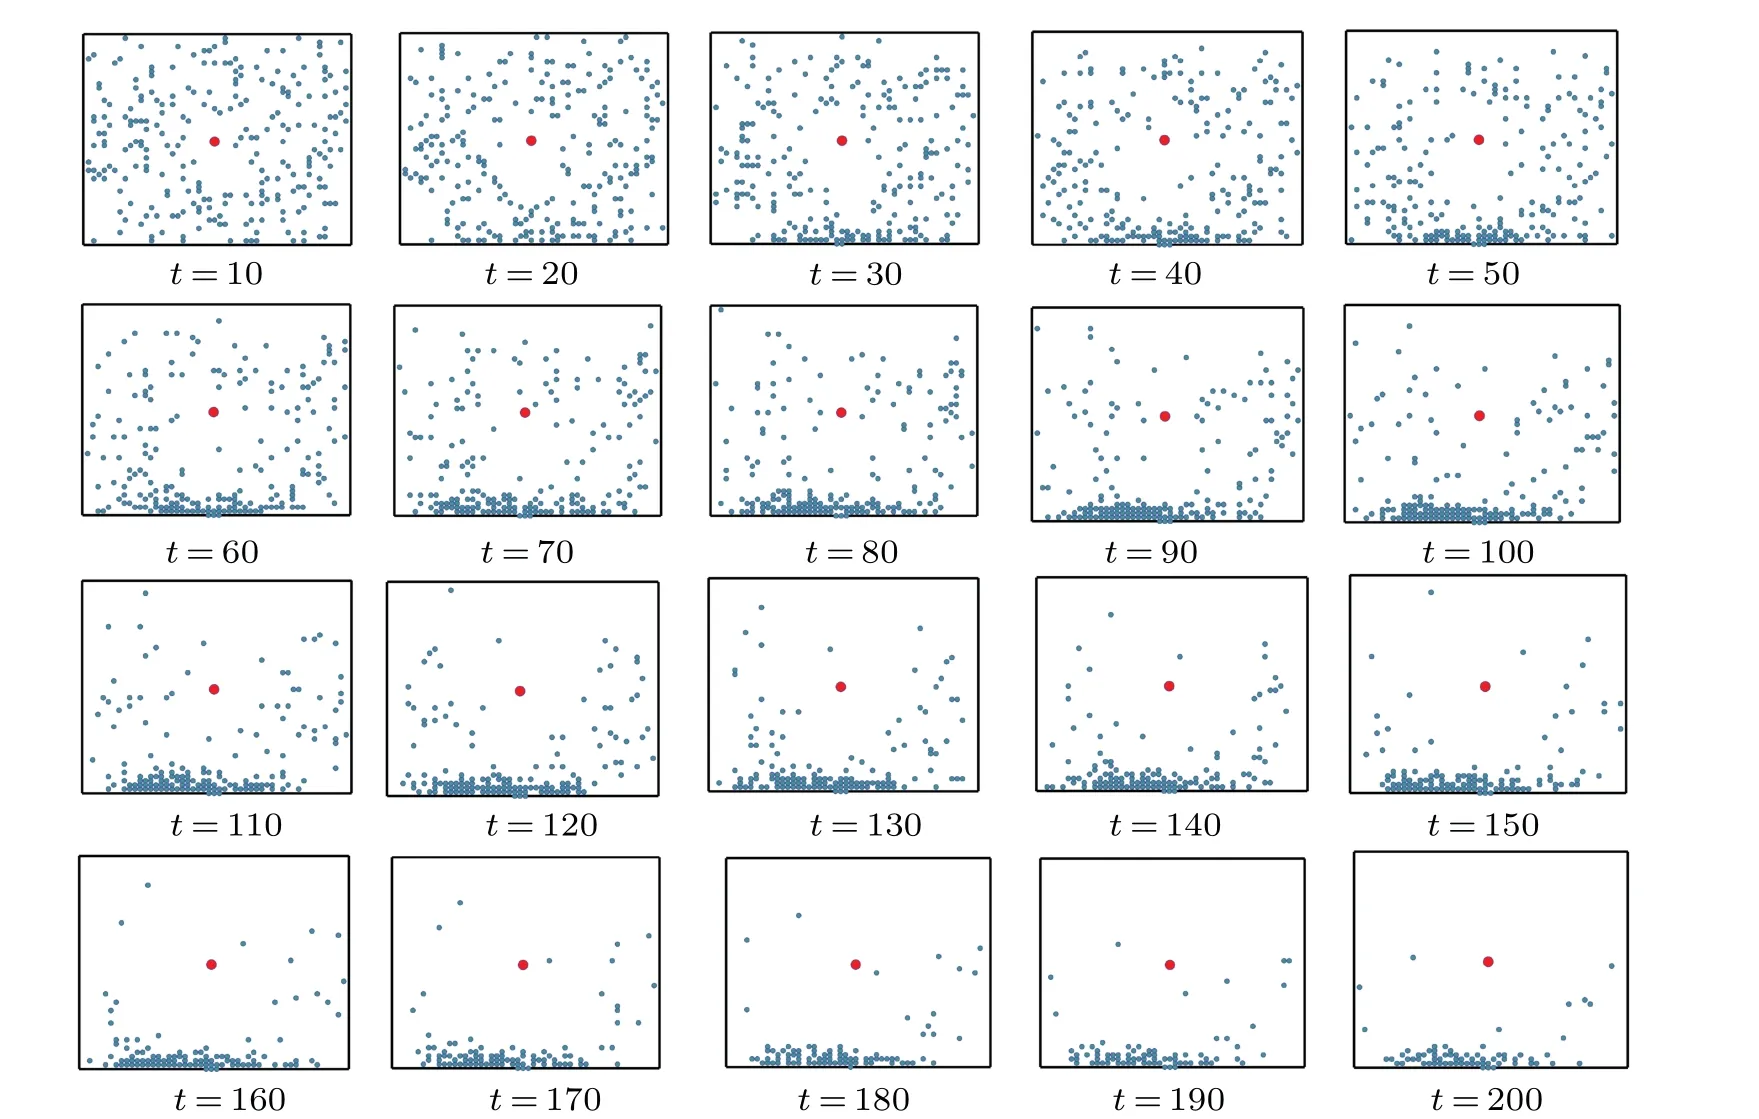
Fig.4. Snapshots at different time steps when D=0.
Figure 4 illustrates snapshots at different time steps whenD=0,namely,pedestrians in this room will not be affected by panic. It is seen that most evacuees tend to move away from the hazard. Afterward, the fled people form a congestion at the exit right away. Consequently, the pedestrians bypass the hazard and quickly evacuate toward the exit until simulation is finished.
Figure 5 shows the evacuation process whenD=1. In this case,the focus is on the dynamic panic contagion and its influence on the pedestrian evacuation behavior. At this time,the extent of the panic contagion is relatively weak, which means that panic has a relatively little influence on the pedestrian evacuation behavior.Seen from Fig.5 that when a hazard appears in the center of the room,pedestrians around the hazard will quickly fall into PTS state.PTS pedestrians’decisionmaking process are significantly affected by panic. At the beginning of the evacuation, they move away from the exit and gather at the corner of the room. On the contrary,pedestrians out of PTS state make decision-making behaviors relatively sensible,bypassing the hazard and looking for evacuation exits, and the arching and clogging can be observed at the exit.Meanwhile,whenD=1,the ability to propagate panic is limited in this case,so the panic has a less impact on the evacuation of pedestrians in the room.
WhenD=3,the extent of the impact from panic and its contagion is relatively great. As illustrated in Fig. 6, a hazard occurs in the center of the room,undoubtedly pedestrians around the hazard quickly fall into PTS state. Then PTS evacuees spread panic to others around,resulting in a big increasement of pedestrians in PTS.When the time step is 100,pedestrians in the room who have not been safely evacuated all fall into PTS.Compared to pedestrians out of PTS,PTS evacuees pay more attention to the hazard rather than move to the exit.The pedestrians who are close to the hazard have been possessed by a stronger panic,so they firstly choose to avoid the hazard as far as possible,instead of running to the exit. In addition,pedestrians are more willing to evacuate along the wall so as to keep a safe distance from the hazard. Also,gathering at the corners is also observed in Fig.6.
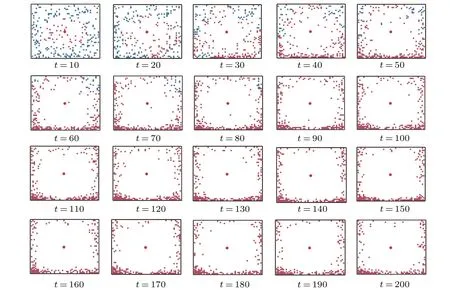
Fig.6. Snapshots at different time steps when D=3.
Figure 7 illustrates the snapshots at different time steps whenD=5. At this stage,the extent of the panic impact and its propagation is relatively larger. As shown in Fig. 7, once a hazard occurs at the center of a room, only the individuals who are very close to an exit and very far from the hazard are out of PTS, pedestrians almost completely fall into the PTS state,or the panic contagion affect the evacuation process significantly. The pedestrians who are close to the hazard have panicked more, so they choose to avoid the hazard as far as possible,instead of running to the exit first. Gathering in corners and evacuating along the wall is obviously observed in Fig.7.
Figure 8 indicates the effect of the global panic control coefficientDon the evacuation time. It is obvious that for different density crowds,as the value ofDincreases,the evacuation time lengthens as well. WhenDincreases,or when the panic and its contagion is more severe, pedestrians become less rational and are not able to find the exits quickly,instead they are more sensitive to the hazard. So,they give priority to escape from the hazard and stay in corners,and flee to the exit negatively. Hence,pedestrians take more time to escape from the exit.
However,it should be pointed out that the crowd density in the room is different,and the evacuation time responds differently toD. It is clearly seen in Fig. 8 that the impact ofDon the low-density crowds is more significant. As shown in Fig. 8, withDrising, theρ= 0.1 curve shows a significant increasement,whileρ=0.4 curve has a relatively small extent of increasement. WhenD >4, the degree of panic among the pedestrians in the room is high. For the situation ofρ=0.1, due to the relatively large space for pedestrians movement, there may be some pedestrians going deep in the room away from the exit and away from the source of hazard.With the panic value gradually go down,pedestrians gradually recovered sanity and re-searched for the safe exit to escape.Compared with the case ofρ=0.1,whenρ=0.2,the density of people is relatively increased, the space for pedestrian activities is relatively limited, and the proportion of pedestrians going to the deep corners of the room is relatively smaller that ofρ=0.1. So the overall evacuation time is longer than that ofρ=0.1.The reason for the above phenomenon is that when the crowd density in the room is lower,the space for pedestrians to move is larger. As a result,the panic propagation makes a big difference on a pedestrian evacuation,showing such obvious behaviors like avoiding the hazard,gathering in corners and escaping along the wall. Fact is at this point, pedestrians are more sensitive to panic, also leading to a big change of evacuation time.
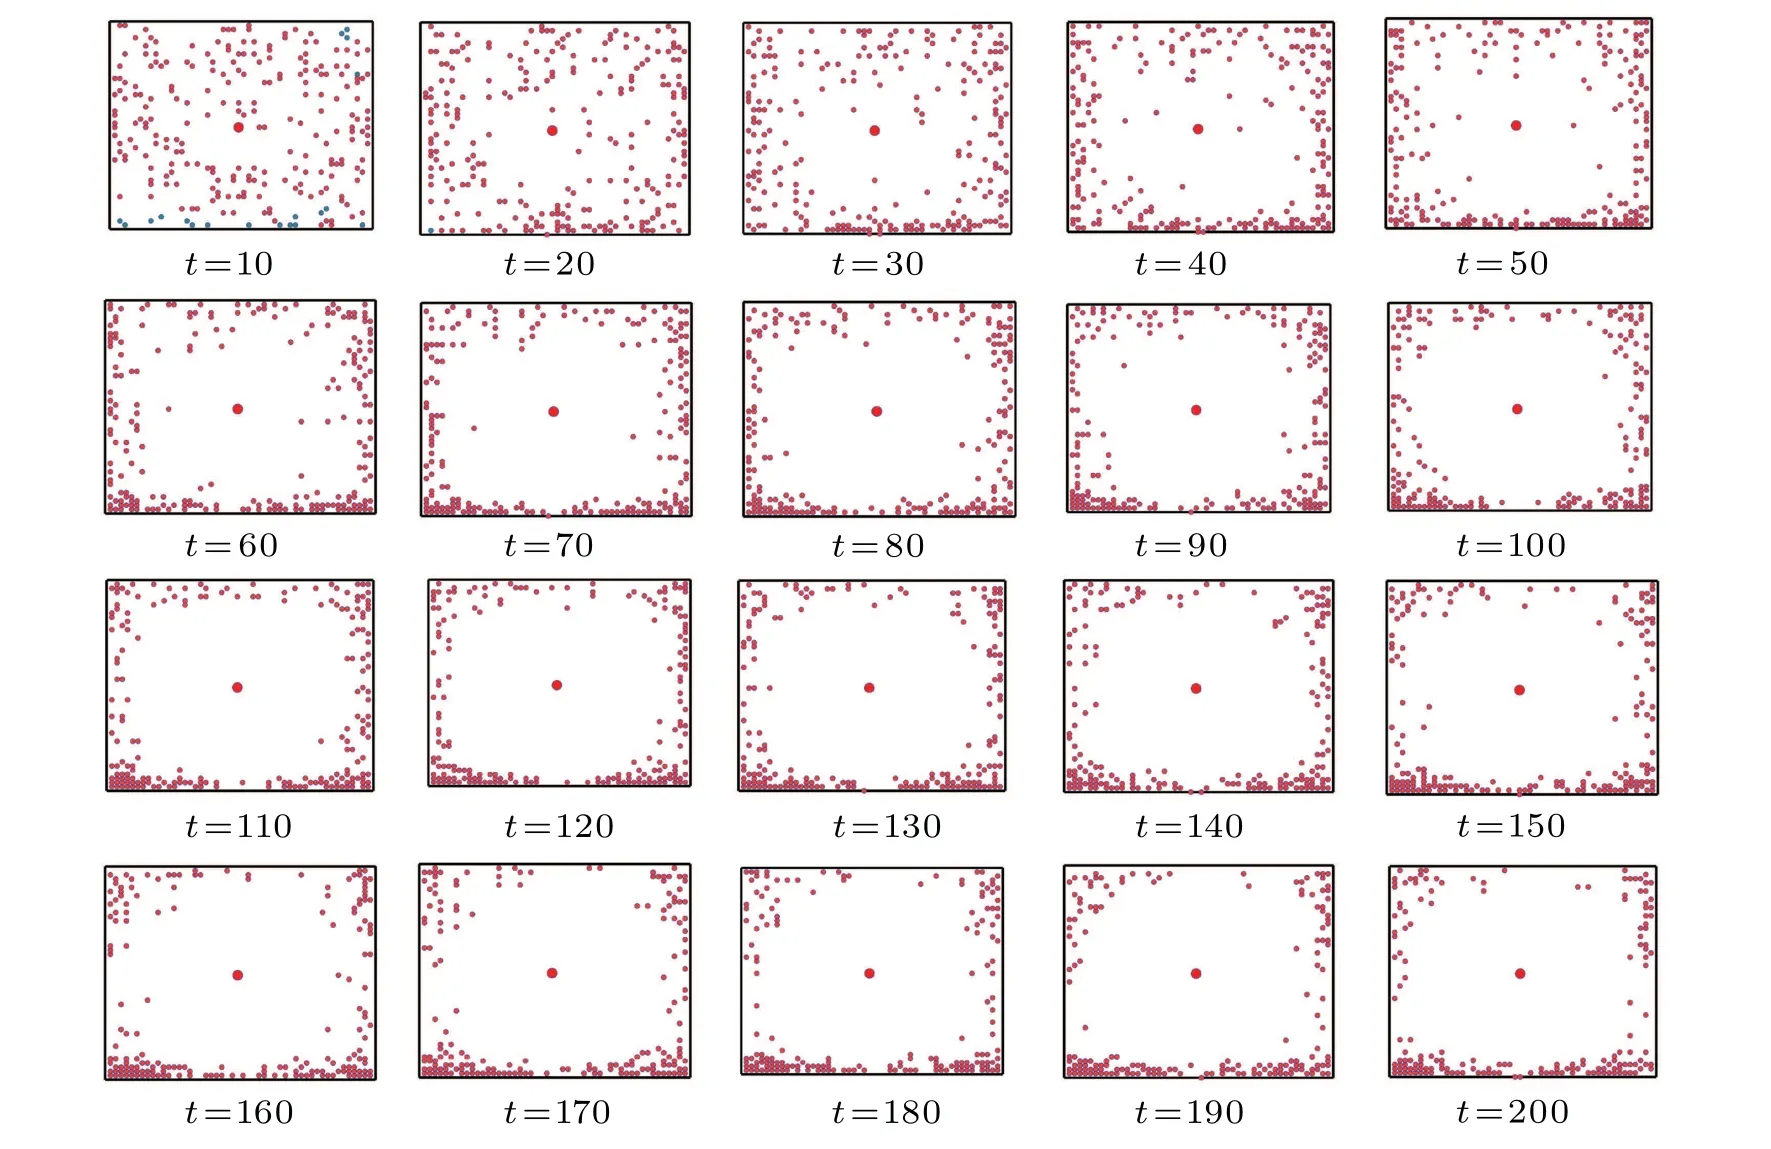
Fig.7. Snapshots at different time steps when D=5.

Fig.8. Evacuation time against global panic control coefficient D.
Figure 9 reflects the number of evacuated pedestrians against time under different crowd densityρand the global panic control coefficientD. As shown in Fig.9, crowds with different densities have a different sensitivity to panic. As the evacuation time lengthens,the number of escaped pedestrians goes up linearly and tends to be a stable value. Figure 9(a)shows that when the crowd densityρ=0.1, the number of evacuated pedestrians increases with the evacuation time under different values ofD. In the case ofD=1, or when the degree of panic contagion is relatively low, and time step is less than 300,the evacuation efficiency is relatively high,and the speed of pedestrian flow at the exit is about 1 person/time step. When time step is over 300,the evacuation speed gradually slows down to.As seen in Fig.9(a),when the global panic control coefficientDgrows up from 3 to 9,the trends of curves of the number of escaped pedestrians are similar. Moreover,it is also clearly seen that the evacuation efficiency of pedestrians in the room gradually decreases, and the evacuation time rises up,from 766 timesteps to 1092 timesteps.
In Figs. 9(b)–9(d), the changes of number of evacuated pedestrians at different crowd densities have the same tendency similar to that of Fig. 9(a). It can be seen that as the value ofDincreases, the evacuation efficiency of pedestrians in the room decreases, and the evacuation time increases accordingly. What needs to be pointed out is that as the crowd densityρincreases from 0.2 to 0.4, the impact of the panic contagion on evacuation gradually weakens, and the specific manifestation is that the degree of the overlap of these curves with differentDvalues deepens.As clearly shown in Fig.9(d),the curves with differentDvalues whenρ=0.4 basically coincide. In this case, the evacuation process with different degrees of panic is similar,and the final evacuation time does not vary much.

Fig.9. (a)The number of evacuated pedestrians against time with ρ=0.1. (b)The number of evacuated pedestrians against time with ρ=0.2.(c)The number of evacuated pedestrians against time with ρ =0.3. (d)The number of evacuated pedestrians against time with ρ =0.4.
According to simulation results above,if the crowd density is constant, once a hazard occurs, the higher the panic control coefficientDvalue is, the longer the evacuation time is. This is because the higher degree of the crowd panic is,the more sensitive the pedestrians are to the hazard. At the same time,the exit cannot be found rationally due to the influence of panic,resulting in lower crowd evacuation efficiency.What is to be noted is that,when the crowd density in the room is high, the panic has a less influence on the evacuation process. The reason is, when the crowd density in the room is high,although the panic between pedestrians spreads quickly,the space for pedestrians to move is relatively narrow,so that pedestrians only follow the others slowly and the evacuation efficiency remains relatively constant. According to Eq. (5),after a certain period of time,the panic of the crowd gradually decays,and the crowd resumes their rational thinking step by step,and starts to evacuate sensibly.
3.2. Effect of hazard position
The emergent occurrence has the characteristics of suddenness and unpredictability, and its occurrence is random in time and space. In order to study the influence of a hazard position on the dynamic process of the panic propagation and the crowd evacuation,this paper analyzes five hazard position schemes,namely,defining hazards at different positions in the room. As shown in Fig. 10, five position schemes are set up and they are A,B,C,D,and E respectively. And five positions are distributed equally on the diagonal. Position A denotes that the hazard is placed in the back corner of the room,B denotes that the hazard is placed in the back of the room,Position C is in the center of the room, D is in the front of the room,E lies in the front corner of the room. Figure 10 also shows the corresponding hazard threat floor field and the panic field at the beginning of the simulation in different hazard position schemes. Obviously, the location of the hazard significantly affects the distribution of the hazard threat floor field and the initial panic field. Evidently the pedestrian panic is positively correlated with the distance to the exit and is negatively correlated with the distance to the hazard. Besides,the distribution of panic updates simultaneously with the movements of pedestrians and the panic contagion.
To study the impact of different hazard position schemes on the efficiency of evacuation, the crowd densityρin the room was set as 0.2, the evacuation process was simulated by changing the hazard location,and the evacuation time was recorded. The results are shown in Fig. 11, when the hazard is located in different locations,the evacuation time is significantly different. The evacuation time ranges in length from position E,D,C,B,and A respectively. It is worth noting that when the hazard is located at the positions A,B,and C in the room,the evacuation time gradually increases with a relatively small amount,and remains below 1000 time steps. When the hazard is located at positions D and E,the evacuation time increases significantly,which is close to 2000 time steps.

Fig.10. (a)Position A scheme and corresponding hazard threat floor field and panic field. (b)Position B scheme and corresponding hazard threat floor field and panic field. (c)Position C scheme and corresponding hazard threat floor field and panic field. (d)Position D scheme and corresponding hazard threat floor field and panic field. (e)Position E scheme and corresponding hazard threat floor field and panic field.
The dynamics of the number of pedestrians who escape from the exit are investigated as shown in Fig.12. It signifies that when the hazard is located at positions A or B,the evacuation speed is the fastest, and their curves basically overlap.When the hazard is located at position C,the evacuation speed is slower than that at positions A and B. And when the hazard is located at positions D and E respectively,the evacuation time significantly prolongs,which is quite different from that at positions A,B,and C.
Figure 13 reveals the dynamics of the number of pedestrians who fall into the panic transmission status. When the hazard is located at positions A,B,and C respectively,the number of PTS pedestrians in the room increases rapidly to the corresponding peaks, and then declines the same way. While the hazards are located at positions D and E, the number of PTS pedestrians increases relatively slowly, and eventually stabilizes at a relatively large number. The explanation is that for positions A, B, and C, the moment is relatively earlier than for positions D and E when the number of PTS pedestrian decreases.
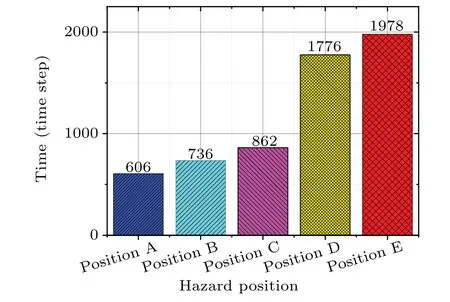
Fig.11. Evacuation time for different hazard position schemes.
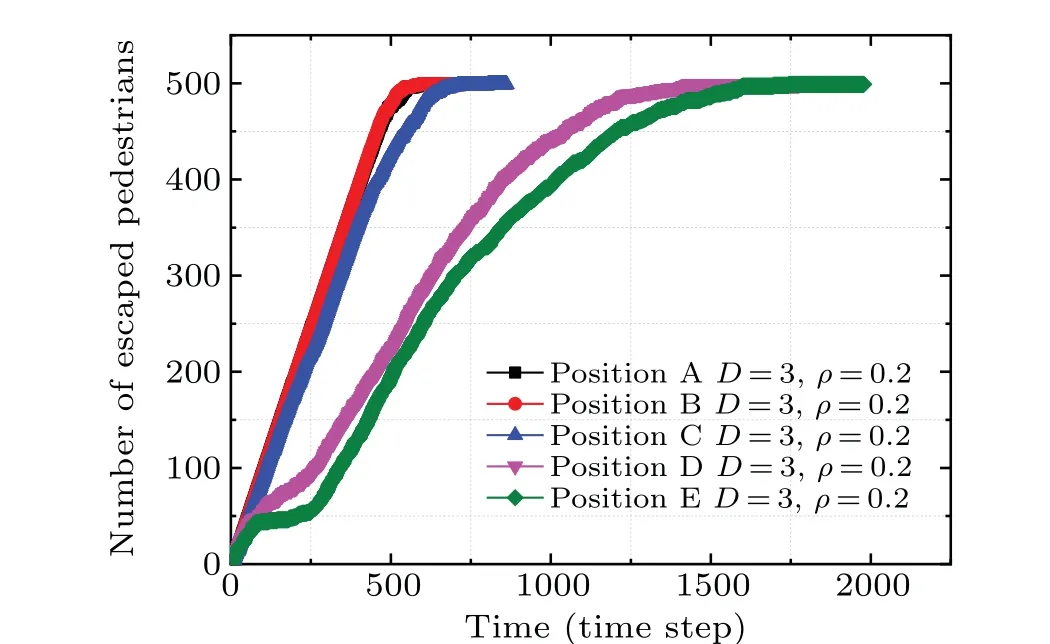
Fig.12. The number of escaped pedestrians against time in different position schemes.
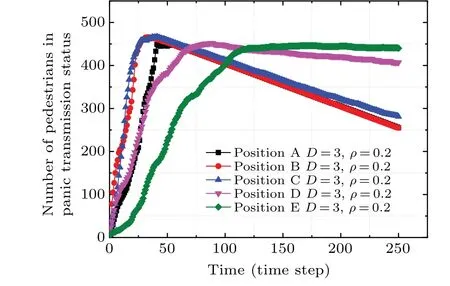
Fig. 13. The number of PTS pedestrians against time in different position schemes.
This is because pedestrians,under the influence of panic,show blind evacuation behaviors,and they will gather on walls and corners. When the hazard is located at positions B and C,the PTS crowd will blindly avoid hazard and flee away from positions B and C. The spread rate of panic is higher, which makes the panic spread in all directions around the hazard,leading to the number of PTS pedestrians increasing rapidly.The blind gathering in the corner of the room also exacerbates the spread of panic. When the hazard is located at position A,the initial PTS crowd is only concentrated near position A.Because all pedestrians are moving away from A under the influence of theHijand theSij, the spread of panic is unidirectional,the spread rate of panic is lower than cases in positions B and C. Hence the growth rate of the number of PTS pedestrians is slightly lower than that of the positions B and C.When the hazard is located at positions D and E,the hazard is closer to the exit, and evacuees who have not yet been in the PTS state move quickly away from the hazard under the action of theHijand theSij, and gather on the other side of the exit. However, the initial PTS crowds are more panicked and more sensitive to hazard,so they will gather in the corners of the room away from positions D,E and also far away from the exit. There is a movement direction deviation between the PTS crowd and the crowd that has not been in PTS,so the rate of panic transmission is lower than that of positions A,B,and C. In addition, when the hazard is located at positions D and E, pedestrians near the exit in the room have a higher degree of panic,which leads to a slower decline in the number of PTS groups in this situation.
The above results points to the fact that the position of the hazard significantly affects the dynamics of the panic propagation and the crowd evacuation. When the hazard is close to the safety exit, the panic propagates for a longer time and brings about a greater impact. On the other hand,the exit that is close to the hazard makes most pedestrians dare not go forward from this exit to evacuate firstly,which results in a serious congestion at the corner.
3.3. Effect of environmental familiarity
This paper,too,analyzes the impact of the pedestrian environment familiarity on the evacuation efficiency. In Eq.(9),ksinrepresents the pedestrian familiarity of the environment.It implies that, when theksinis larger, the familiarity of the pedestrian in the room is higher, in other words, pedestrians are more capable to find exits. In this model, the crowd density wasρ=0.2,and the initial position of the hazard was located at position B,then different values ofksinwere adjusted to change the weight of the static floor field. Five cases were considered,namely case 1ksin=0.1,case 2ksin=0.2,case 3ksin=0.3,case 4ksin=0.4,and case 5ksin=0.5. Moreover,according to each case ofksin,different values ofDwere also taken into account, namely (a)D=0.1, (b)D=0.2, and (c)D=0.3.
Figure 14 suggests the dynamics of the number of escaped pedestrians when time step is below 2000 at the beginning of the simulation. The above cases all indicate that pedestrians experienced the process of evacuation speed from being fast to slow, and approaching in the end. Apparently,the evacuation speed of pedestrians is fastest in case 5, second is case 4, third in case 3, fourth in case 2, and the last is in case 1. Moreover, within 2000 time steps, only the pedestrians in the three sub-cases (a), (b), and (c) of case 5 safely evacuate from the room. Regarding the number of evacuated pedestrians, it is largest incase (5), then followed by case 4,3, 2, and 1 respectively. Therefore, it is clear that the number of evacuated pedestrians keeps rising asksingets greater,although the panic propagation has different levels of influence. Also shown in Fig.14,for eachksin,the sub-case curves of threeDvalues overlap pretty much,pointing out that compared with the impact of panic,the pedestrian’s familiarity has a more significant influence on the evacuation process.

Fig.14. The number of evacuated pedestrians against time.
4. Conclusions
This study intends to clarify the pedestrian evacuation process as regards to the panic dynamic contagion in the context of a hazard in a room, and to provide constructive suggestions for panic evacuation management. Prompted by the SIR epidemiological model, an extended cellular automaton model was established for the study of the dynamic propagation process of panic and the crowd evacuation behavior, as well as the coupling mechanism of the panic contagion and evacuation. In this model, the dynamic propagation process of panic was defined,and the panic pedestrian movement was considered under the threat of a hazard in the room. Besides,the global panic control coefficientD,hazard positions and the pedestrian environmental familiarity were studied. The major conclusions obtained are summarized as follows:
(i)The model proposed reproduces the generation,spread and attenuation process of pedestrians’panic in the context of hazard in a room, and further simulates the coupling process of the panic contagion and evacuation.
(ii) The global panic control coefficientDsignifies the overall panic level of pedestrians, and also determines the panic effective spreading rate. With the increase of valueD,the number of PTS pedestrians rises with it, the impact of panic on the evacuation process becomes greater, and consequently pedestrians’sensitivity to hazards increases. Pedestrians give priority to escape from the hazard and stay in corners,and flee to the exit negatively. Hence,pedestrians spend more time to escape from the exit. It is worth noting that when the crowd density in the room is low,the panic propagation has a greater impact on the evacuation process.
(iii) The position of the hazard in the room significantly affects the panic propagation and the evacuation process of the crowd. When the hazard position is closer to the exit,the number of PTS pedestrians increases and eventually stabilizes at a relatively large number,the panic propagates for a longer time and makes a bigger difference, and the evacuation time lengthens.
(iv)The crowd environment familiarity has a greater impact on the evacuation process. The higher the environment familiarity, the faster the evacuation speed of the crowd. In addition, compared with the impact of the panic contagion,the environmental familiarity has a more significant impact on the evacuation time.
The model established in this study simulates the dynamic propagation process of panic and the pedestrian panic evacuation behavior in the context of a hazard appearing in a room.To a certain extent, the model reflects the generation, spread and attenuation process of pedestrians’panic,and reproduces pedestrians’blindly following and corner gathering behaviors.However,the evacuation process of pedestrians is not only affected by the structure of the building, many human factors such as the gender, age, person’s physical and physiological conditions jointly determine the evacuation behaviors. Therefore,in the future,we will continue to improve evacuation experiments combined with simulation methods and study the influence of the above human factors on evacuation in order to understand the pedestrian panic evacuation more thoroughly.
Acknowledgements
Project supported by the National Key Technology Research and Development Program of China (Grant No. 2019YFC0810804) and the National Natural Science Foundation of China(Grant No.7197010332).
Appendix A:Calculation of Np
The calculation process ofNpis as follows. In the panic transmission area, when all pedestrians except the one at the center are in PTS,PTS pedestrians could transmit panic to the pedestrian at the center. Equation (1) reflects all the panic mood that is transmitted to the center pedestrian,Lkis the distance between the pedestrian in PTS and the pedestrian at the center of panic transmission area,as shown in Fig.A1(a).Figure A1(b)shows the panic value that the pedestrians could transmit to the center pedestrian. And it is clear that, when theLkis shorter, the panic transmitted is larger. According to Eq. (A1), the pedestrian at the center could achieve panic value as 4.4835 at most.
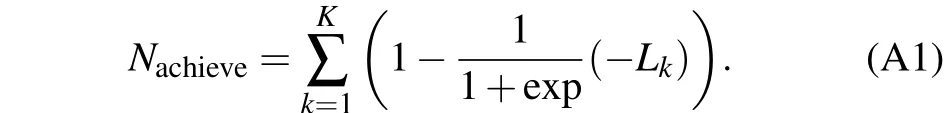
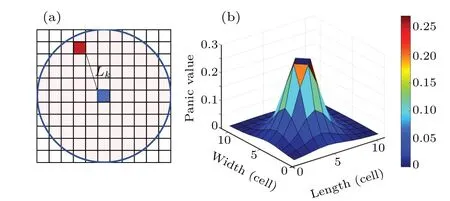
Fig.A1. (a)A PTS pedestrian transmit panic mood to pedestrian out of PTS at center. (b) Panic value that the pedestrian could achieve from surroundings in the PTS zone.
猜你喜欢
红蜻蜓·低年级(2021年6期)2021-08-23
红蜻蜓·低年级(2021年6期)2021-08-23
湖北理工学院学报(人文社会科学版)(2021年4期)2021-07-14
辽河(2020年4期)2020-04-23
作文周刊·小学一年级版(2019年16期)2019-06-12
作文周刊·小学一年级版(2019年8期)2019-04-25
作文周刊·小学二年级版(2018年32期)2018-11-26
作文周刊·小学一年级版(2018年21期)2018-09-10
作文周刊·小学一年级版(2016年9期)2016-05-10
小天使·一年级语数英综合(2014年7期)2014-06-26

- Chinese Physics B的其它文章
- Ergodic stationary distribution of a stochastic rumor propagation model with general incidence function
- Most probable transition paths in eutrophicated lake ecosystem under Gaussian white noise and periodic force
- Local sum uncertainty relations for angular momentum operators of bipartite permutation symmetric systems
- Quantum algorithm for neighborhood preserving embedding
- Vortex chains induced by anisotropic spin–orbit coupling and magnetic field in spin-2 Bose–Einstein condensates
- Short-wave infrared continuous-variable quantum key distribution over satellite-to-submarine channels