基于网络药理学研究杜仲叶提取物改善非酒精性脂肪肝的作用及机制
2022-08-19 02:01蔡丹红周长威张肇锋赵烨卞瑶瑶薛梅李玉刘笑利张良
南京中医药大学学报 2022年8期
关键词:江苏
蔡丹红,周长威,张肇锋,赵烨,卞瑶瑶,薛梅,李玉,刘笑利,张良
(1.南京中医药大学药学院,江苏 南京 210023;2.中国药科大学中药学院,江苏 南京 210009)
Recently, the morbidity of NAFLD has been rapidly increasing worldwide with growing population of obesity, type 2 diabetes and the metabolic syndrome[1]. NAFLD is characterized by the accumulation of excessive lipid within liver but without a alcoholism history[2]. Besides, it comprises a spectrum of pathological disorders ranging from hepatic steatosis to steatohepatitis, which may even proceed to hepatic fibrosis, hepatic cirrhosis and finally hepatocellular carcinoma[3]. The current methodologies for treating NAFLD primarily include healthy balanced diet, physical training and some synthetic agents containing metformin, orlistat and vitamin E[4]. However, the above schemes with some side effects can't satisfy the clinical patients[5]. Therefore, it is an urgent need to develop novel drugs to prevent and treat NAFLD[6]. NAFLD encompasses obvious pathological features of excessive accumulation of TG within liver[7]. Stefanovic-Racic reported the moderate expression of CPT-1A could not only improve the oxidation rate of fatty acids and thereby reduce intracellular TG content in primary hepatocytes but also enhance the oxidative capacity of fatty acids and then degrade the TG content in mouse liver[8]. In addition, Duval claimed that activating PPARα could also reduce TG level from plasma[9]. Besides, the knockout of the hepatocellular specific PPARα gene triggered hepatic steatosis and hypercholesterolemia in mice[10]. Hence, these results remind us PPARα and CPT-1A play a vital role in the treatment of NAFLD.
EucommiaulmoidesOliv. is one of the TCM, also named as Dù-zhòng (in Chinese), Tuchong (in Japanese) and Chinese rubber tree. In recent years, studies on other parts ofEucommiaulmoidesOliv, such asEucommiafoliumandEucommiaulmoidesflowers, are becoming more and more popular. Ark claimed water extracts fromEucommiafoliumcould alleviate hyperglycemia and hyperlipidemia of HFD fed mice by increasing glycolysis, inhibiting gluconeogenesis and synthesis of fatty acids with cholesterol in liver[11]. Some studies reportedEucommiafoliumextracts (ELE) could also attenuate hepatic steatosis in HFD fed mice[12]. What's more, Lee reported thatEucommiaulmoidesandRhusverniciflfluacould alleviate HFD induced hepatic steatosis by elevating anti-oxidation and AMPKα activation[13]. From what have been introduced above, we hypothesize that ELE may relieve hepatic steatosis through AMPK signaling pathway.
In recent years, network pharmacology has been used to assess pharmacological effects and explore the mechanisms of TCM[14]. Accordingly, the study was designed to investigate the effects and mechanism of ELE against NAFLD in HFD induced mice model, as well as PA-induced L02 cells and HepG2 cells models based on the network pharmacology study.
1 Materials and Methods
1.1 Materials
High fat diet was purchased from Qinglongshan company (Nanjing, China). GAPDH, PPARα and CPT-1A antibodies as well as rabbit and mouse HRP-IgG (H+L) were provided by Proteintech (Chicago, IL, USA).
1.2 Preparation of Eucommia folium extracts
Eucommiafoliumwere purchased from Tongrentang Chinese Medicine and produced in Zhangjiajie, Hunan, China, and authenticated by professor Shengjin Liu of Nanjing University of Chinese Medicine. A voucher specimen (No. L20200044) was deposited in the herbarium of Nanjing University of Chinese Medicine.
Water extracts were performed as the following: 500 g of powdered leaves were extracted with water (5 L×2, 3 h each time). The water extracts were then filtered through Whatman No. 1 filter paper, evaporated under vacuum at 50 ℃, and further dried to powder using a freeze-dryer at -80 ℃, which ultimately produced 100 g of dried extracts. The final extracts were acquired and then placed at the dryer under -20 ℃.
1.3 The collection and screen of active constituents in ELE
The active ingredients from ELE were procured from the Traditional Chinese Medicine Systems Pharmacology Database (TCMSP database) (https://tcmspw.com/tcmsp.php)[15]and Pubchem (https://pubchem.ncbi.nlm.nih.gov/)[16]. The active constituents with OB>30% and DL>0.18 are screened for further investigation.
1.4 Identification of NAFLD relevant targets
Relevant targets of NAFLD are identified from Gene cards (https://www.genecards.org/)[17]and Drug bank database (http://www.drugbank.ca).
1.5 Construction of PPI network
String (http://string-db.org/cgi/input.pl)[18]is an online database used to construct PPI network.
1.6 Construction of component-target-pathway network
To explicate the corresponding relationships among the active components, underlying targets and pathways, the above were input into Cytoscape 3.7.1 to establish component-target-pathway network.
1.7 Analysis for gene ontology as well as kyoto encyclopedia of genes and genomes
To investigate the functions of the above targets in different biological signaling pathways, we input the underlying targets into the database (DAVID, https://david.ncifcrf.gov)[19]for GO and KEGG analysis.
1.8 Cell culture
HepG2 cells and L02 cells were purchased from Cell Bank of Chinese Academy of Sciences (Shanghai, China). The cells were cultured in DMEM medium (Gibco, Grand Island, NY, USA) including 10% fetal calf serum (Gibco), and incubated at 37 ℃ with 5% CO2.
1.9 Animals and Treatments
Thirty-two male C57BL/6J mice (8-9 weeks, ethical approval number:012009026408) were housed under controlled circumstances: 12 h light-dark cycle, temperature (24~26 ℃) and relative humidity (40%~60%). All mice were adapted to laboratory conditions for 7 days before experiments and randomly divided to four groups (n=8): NCD group (fed with standard diet), HFD group (fed with HFD), low dosage ELE group (fed with ELE, 1 g·kg-1) and high dosage ELE group (fed with ELE, 2 g·kg-1). Mice could access to food and water freely and body weights were observed and recorded every week. All mice were executed after fasting for 12 hours and blood samples were taken from the orbital vein. Livers were removed with surgical clamps and immediately placed in the refrigerator at -80 ℃. The blood glucose concentration from the tail vein was monitored with a glucometer (Sinocare, GA-3). All the above animal work was conducted under the approval of the Experimental Animal Ethical Committee of Nanjing University of Chinese Medicine.
1.10 MTT assay
After cells were cultured for 24 h, 20 μL MTT solution was added to each well and then the cells were incubated at 37 ℃ for 4 h. Next, 150 μL DMSO solution was added to each well, and the 96-well plates were kept in the drying oven (37 ℃) for 10 min and then were placed on the horizontal shaking table and shaken for 10 min. The absorbance was measured at 490 nm with a microplate reader.
1.11 Oil red O staining
To detect endocellular lipid, L02 and HepG2 cells were disposed in different concentration drugs or not for 24 h. Then the cells were rinsed with PBS twice, and fixed with 4% polyformaldehyde for 30 min (23±2 ℃). After being washed with distilled water three times, Oil red O working solution was put into well and then kept for 1 h. Stained cells were rinsed with PBS twice. Microscopic images were captured to observe oil red droplets staining in different cells with the microscope (Nikon, Tokyo, Japan).
1.12 Biochemical analysis
Serum levels of TG, TC, LDL-C, AST and ALT were observed with commercially available kits (Nanjing Jiancheng Bioengineering Institute). To quantify hepatic TG and TC levels, liver tissues were homogenized and then extracted with solvent mixtures containing chloroform, methanol, and distilled water (2∶1∶1,v/v/v). The levels of TG and TC were observed as the same as above mentioned.
1.13 Oral glucose tolerance test of mice
Glucose solution could be prepared as following: D-anhydrous glucose was dissolved in physiological saline solution. The mice were fasted for 12 h but had free access to water. Blood sample was obtained from the tail of the mice, and the fasting blood glucose of the mice was observed. After being weighed the fasting body weight, the mice were given a gavage of glucose at a dose of 2 g·kg-1every minute, and the time was recorded. Blood glucose of each mouse was measured at 15, 30, 60, 90 and 120 min after intragastric administration and the curve was drawn (abscissa: time point, ordinate: blood glucose value).
1.14 Oil red O staining of mouse liver tissue
Frozen sections of mouse liver were cut for 8-12 μm; fixed with 10% formaldehyde for 10 min, and immersed in distilled water for 3 times; immersed in 60% isopropanol for 2 min; dyed with oil red O for 2-5 min; soaked in 60% isopropanol for 2 times; immersed in distilled water for 3 times; dyed with hematoxylin for no more than 1 min; soaked within distilled water and rinsed for 3 times, dried and then sealed with glycerin gelatin. Hepatic lipid accumulation was monitored under light microscope.
1.15 Western blot
Hepatic homogenates and hepatocytes were lysed in ice-cold RIPA buffer, and the protein concentration was detected with the BCA method. The protein samples were separated and transferred to a nitrocellulose membrane (Millipore, Billerica, MA, USA) using 8% SDS-PAGE separation gel, and then blocked with 5% skim milk powder dissolved in TBST. The primary antibody was incubated overnight at 4 ℃, then removed and washed with TBST. Then the secondary antibody was incubated for 1 h and washed with TBST. Finally, the bands were scanned with a gel imager (Bio-Rad, Hercules, CA, USA).
1.16 Real-Time PCR
Total RNA was extracted with TRIzol reagent (Invitrogen, Carlsbad, CA, USA) as per the manufacturer's instructions. The RNA was reversely transcribed into cDNA with the Reverse Transcription Kit (Abm, New York City, NY, USA). Primers were supplied by Abm Bio. The 2-ΔΔCTmethodology was utilized to calculate relative expression level of the target genes with GAPDH as the endogenous control. The following are the RT PCR primers for the target genes:
CPT-1A(NM-002044)
Primer F:5'-TCCAGTTGGCTTATCGTGGTG-3'
Primer R:5'-TCCAGAGTCCGATTGATTTTTGC-3'
PPARα(NM-002045)
Primer F:5'-CGGTGACTTATCCTGTGGTCC-3'
Primer R:5'-CCGCAGATTCTACATTCGATGTT-3'
GAPDH(NM-002046)
Primer F: 5'-CACCATCTTCCAGGAGCGAG-3'
Primer R: 5'-AAA TGA GCC CCA GCC TTC TC-3'
1.17 Statistical analysis
Statistical analysis was performed with Graph Pad Prism 5 software (Graph Pad Software Inc, CA, USA), and all results were expressed in the form of the mean±SD. A t test was utilized for comparisons between two groups, and one-way analysis of variance was performed for comparisons among multiple groups. Differences withP<0.05 were considered to be statistically significant.
2 Results
2.1 Chemical constituents and targets of ELE
Taken together, 85 compounds[20]were identified and collected from ELE, from which 7 candidate compounds were obtained with OB≥30% and DL≥0.18. Disappointedly, the OB value of geniposidic acid and chlorogenic acid were both lower than 30%. Nevertheless, they are oftentimes applied for regulating lipid metabolisminvivoandinvitro[21]. Accordingly, the above mentioned two compositions were still regarded as candidate ingredients, totally making up 9 active molecules. The details about active molecules from ELE were demonstrated in Table 1. Finally, 9 chemical compounds yielded 346 putative targets.
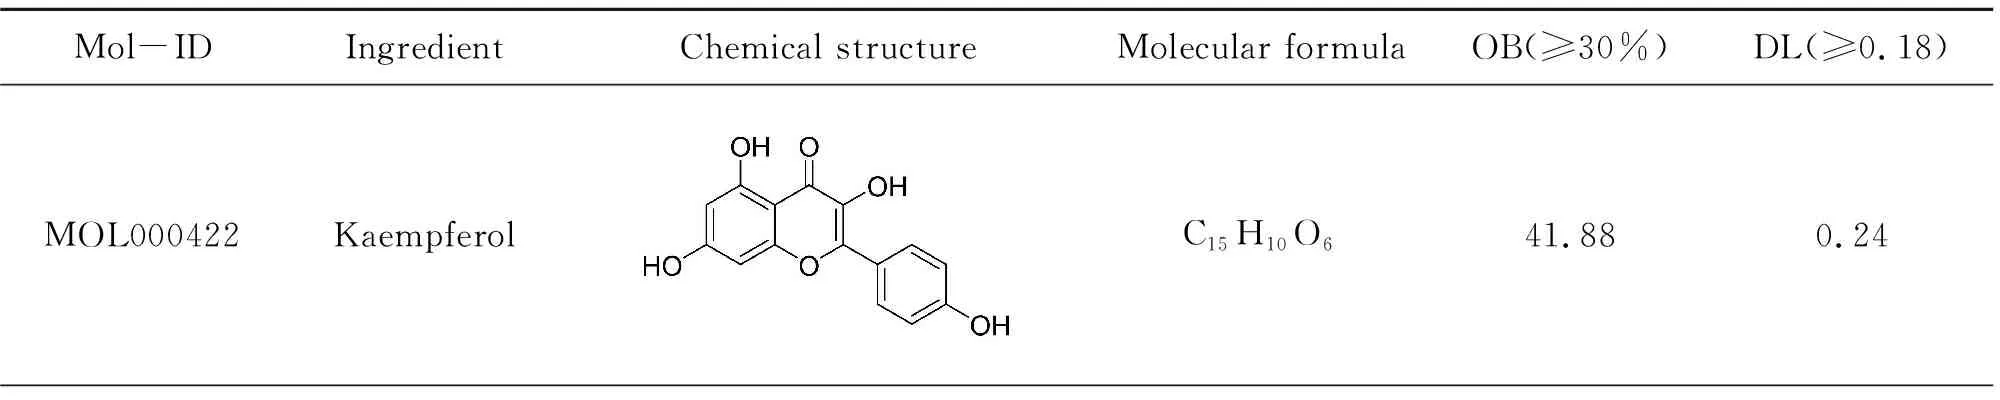
Table 1 Screening of active componets of Eucommia folium

(Continued Table)
2.2 Identification of candidate protein targets associated with NAFLD
Relevant targets for NAFLD were generated from the gene-cards database and drug-bank database. In all, 180 NAFLD concerned protein targets were recognized following the remove of repeated targets. To illustrate the pharmacological mechanism of ELE for treating NAFLD of human, a PPI network was constructed as well as GO and pathway enrichment analysis were also carried out on the common targets between ELE and NAFLD. Finally, 35 common targets were acquired (Fig.1A). There is the detailed information in Table 2.
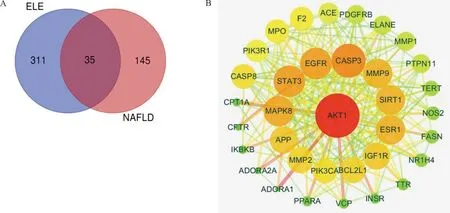
Note: (A) Intersection gene of ELE targets and NAFLD related targets. ELE consists 346 targets generated from 9 active compounds. NAFLD consists 180 targets and there are 35 common targets of ELE and NAFLD. (B) Core network (PPI) diagram of ELE and NAFLD. The nodes get larger with increasing degree. Edges: PPIs between putative targets of ELE and their interactive partners.
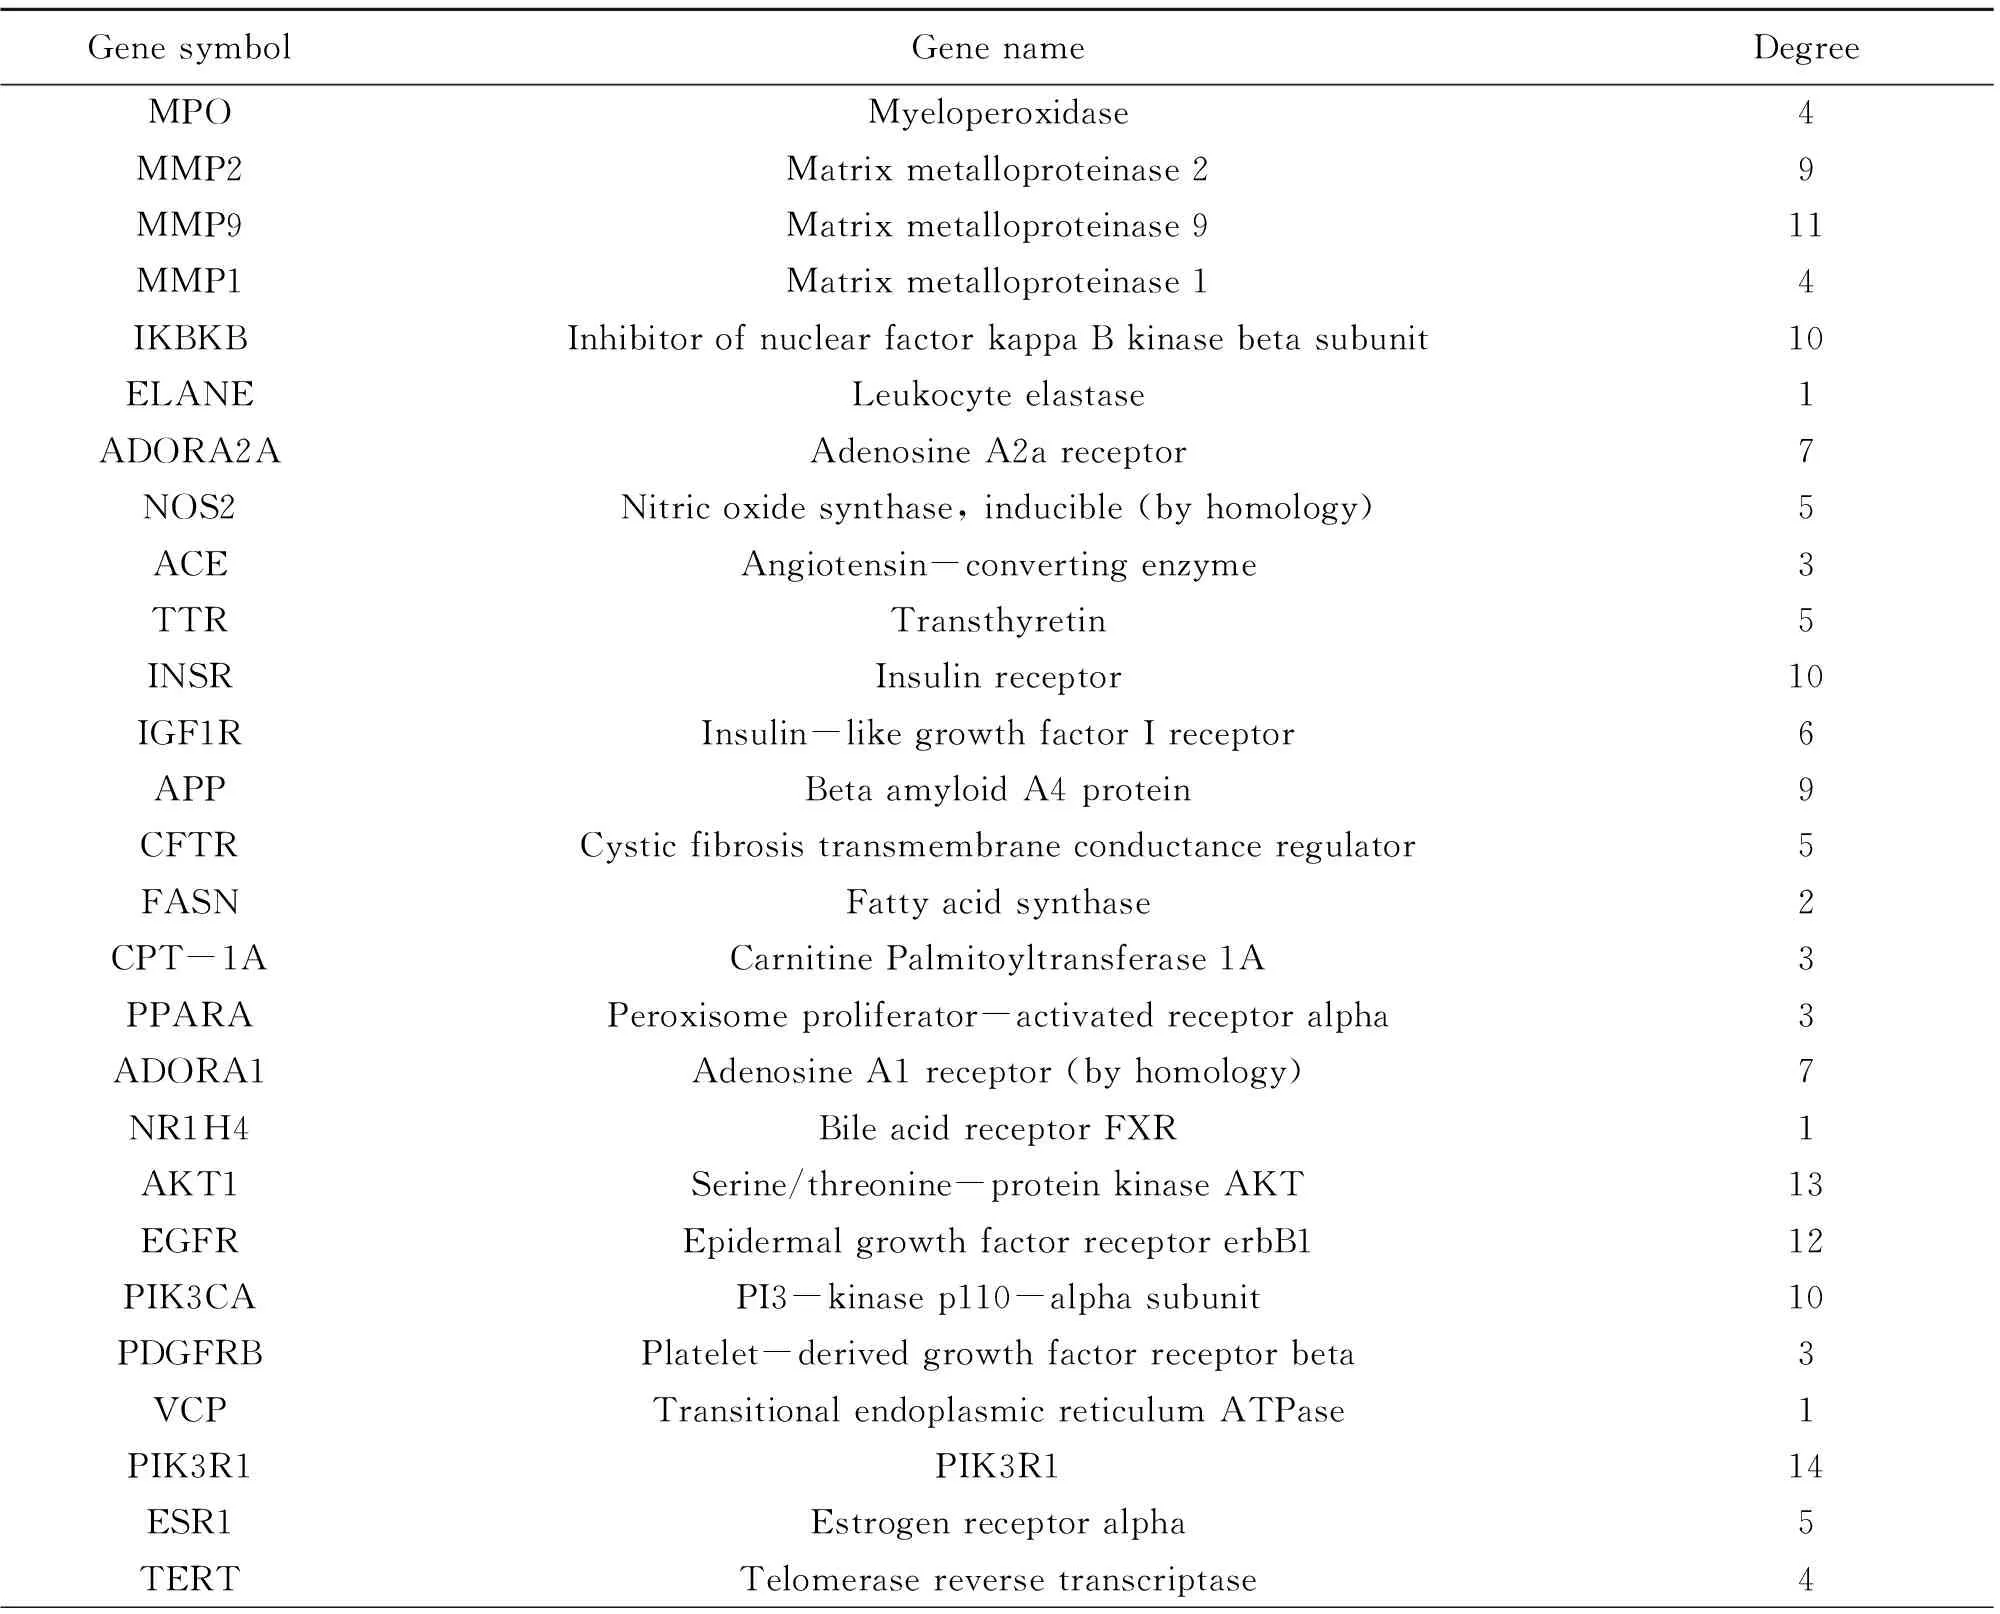
Fig.1 Protein-protein interaction (PPI) network
(Continued Table)
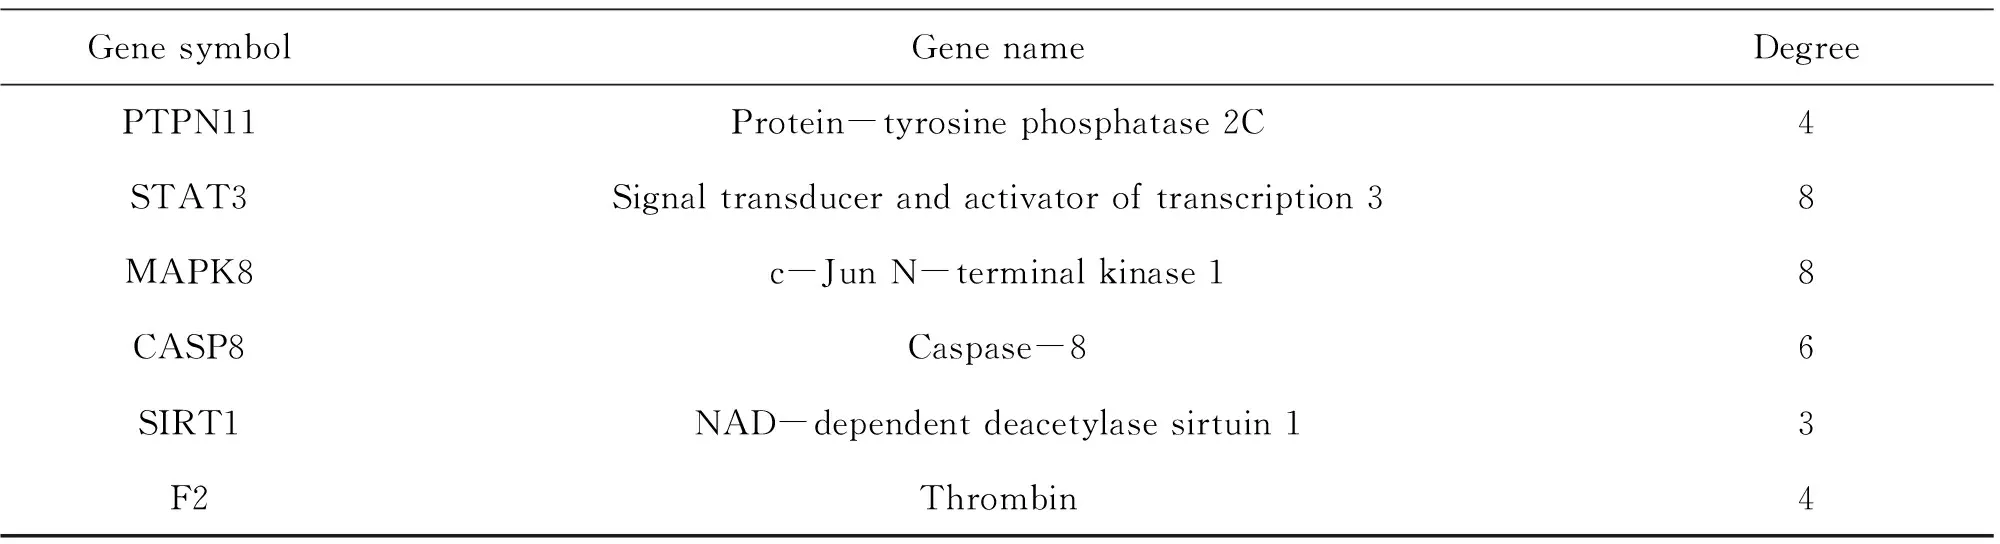
2.3 PPI network
String database and Cytoscape software were utilized to assemble PPI network to further investigate the potential pathways and target genes to cure NAFLD. A total of 35 nodes and 223 edges in the network are shown in Fig.1B. The average node degree and local clustering coefficient were 11 and 0.65, respectively. The outcomes manifested that the target protein levels of AKT1, CASP3, EGFR, STAT3, MAPK8, ESR1, MMP9, SIRT1, IGF1R, PPARA and CPT-1A were excessively vital in ELE for treating NAFLD. Most of these, PPARA and CPT-1A which play crucial roles for alleviating NAFLD are associated with lipid oxidation.
2.4 Compound-compound targets-pathway network analysis
ELE unfolds a broad range of biological and pharmacological functions via a plenty of molecular targets and pathways. To clarify the complicated reciprocities of ELE constituents and their relevant targets as well as related pathways, we established a network on the basis of potential constituents, candidate targets and pathways in ELE for NAFLD. As demonstrated in Fig.2, the network displays 54 nodes and 211 edges with 9 ingredients, 35 targets and 10 pathways. The nodes possessing higher degree value and more edges are much more crucial for function regulation. After analysis with the network analyzer plug-in Cytoscape software, the compounds with the highest degree was exhibited in Table 1: kaempferol, quercetin, baicalein, chlorogenic acid and so on. In terms of targets, Table 2 demonstrated some important ligands with interaction, like PIK3R1, AKT1, MMP9, EGFR, SIRT1, STAT3, CASP3, IGF1R, ESR, MAPK8 and so on. Among the above targets, PPARA, CPT-1A and FASN are all related to lipid metabolism. As for signaling pathways, Table 3 manifested the most momentous signaling pathways concerned with NAFLD: Ras signaling pathway, insulin resistance, AMPK signaling pathway and so on. Consequently, we speculate ELE can resist NAFLD mainly via the key targets and pathways introduced formerly.
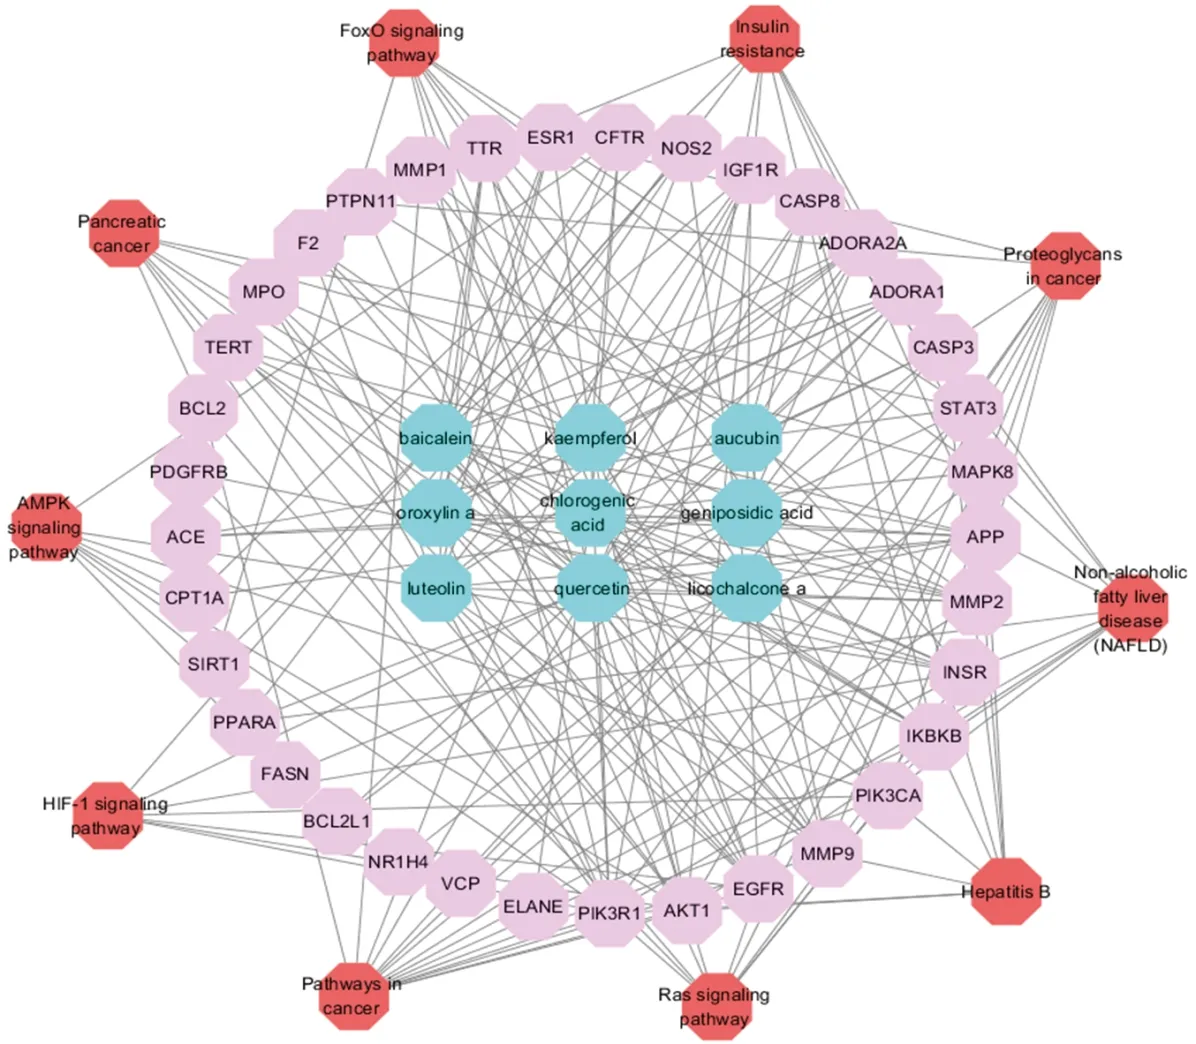
Note: active compounds in blue, target in pink, pathway in redFig.2 The compound-compound targets-pathway network of ELE

Table 3 Information of signaling pathways (10 of 77)
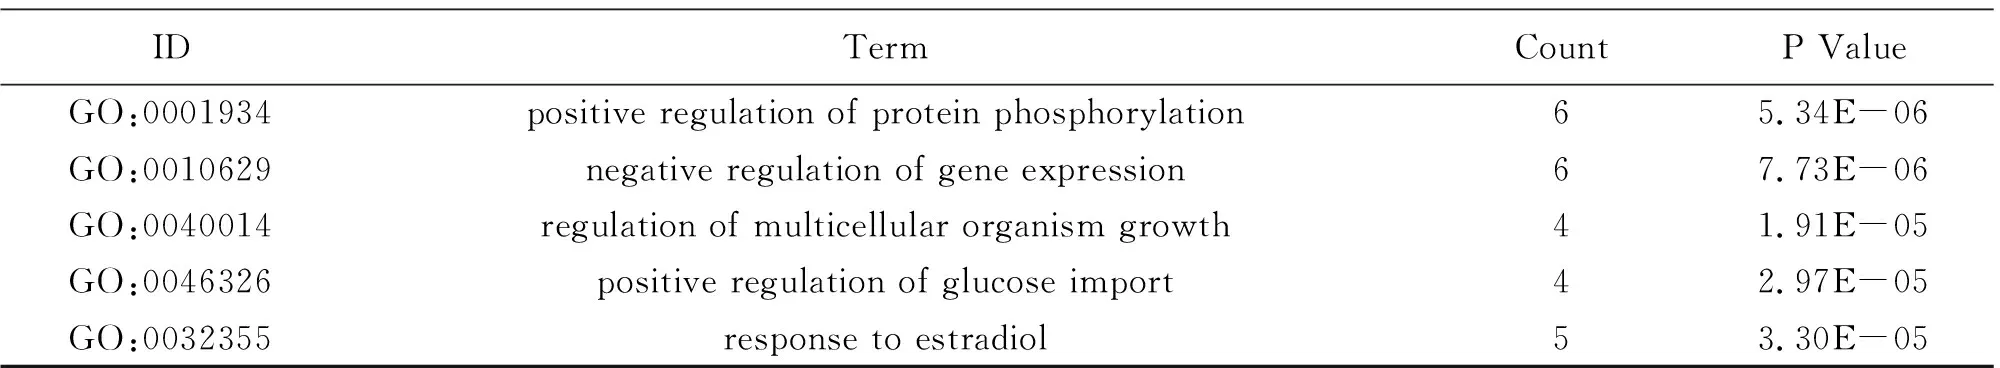
2.5 Gene ontology and pathway enrichment analysis for targets
To illuminate the biological effects of presumed targets, functional enrichment analysis was carried out for the target genes. 197 GO entries altogether were obtained on account ofPvalue (P<0.05). And the entries contained 132 biological progress, 42 molecular functions and 23 cellular ingredients, from which the 10 most markedly abundant terms are demonstrated in Table 4-6. For biological progress, potential targets were primarily concerned with the response to negative regulation of apoptotic process, phosphatidylinositol-mediated signaling, regulation of phosphatidylinositol 3-kinase signaling and so on (Fig.3A). As far as molecular function, underlying targets markedly existed in identical protein binding, insulin receptor substrate binding, enzyme binding and the like (Fig.3B). As for cellular components, plasma membrane, membrane raft and mitochondrion are the possible action sites (Fig.3C). 82 pathways altogether were acquired. The first 10 pathways from KEGG enrichment analysis were displayed in Fig.3D according to P value (P<0.05), from which pancreatic cancer, insulin resistance, foxo signaling pathway and AMPK signaling pathway were the representatives.

Note: (A) biological process. (B) molecular function. (C) cellular component. (D) pathway analysis.Fig.3 Gene ontology and pathway enrichment analysis of identified related targets

Table 4 Information of biological process (10 of 132)
(Continued Table)
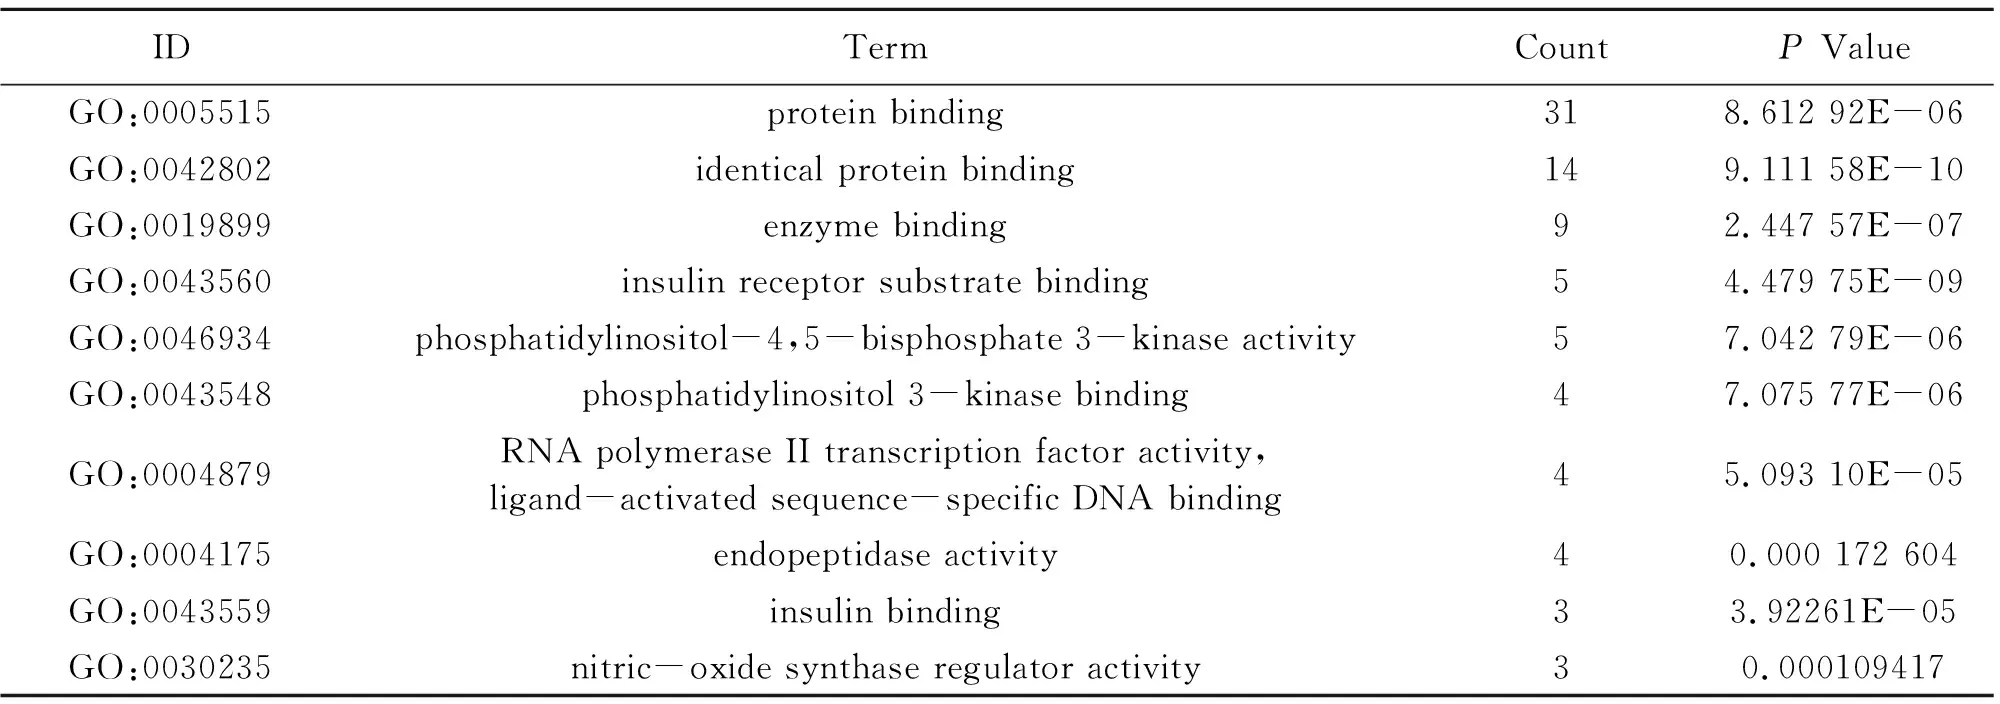
Table 5 Information of molecular function (10 of 42)
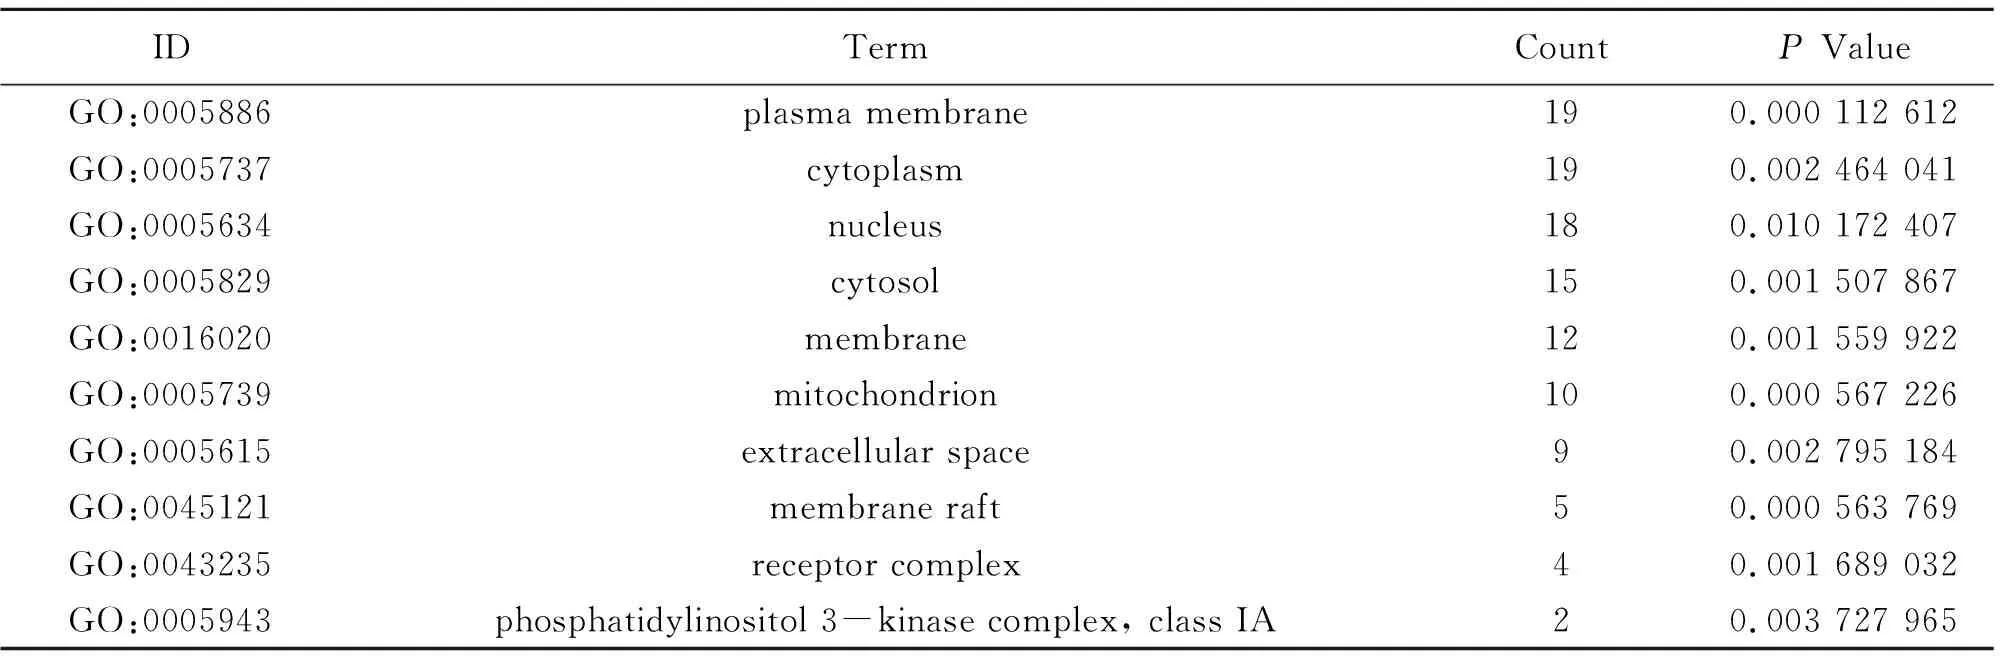
Table 6 Information of cellular component (10 of 23)
2.6 The effect of palmitic acid on cell viability of L02 cells and HepG2 cells
L02 cells and HepG2 cells were disposed in PA (200 μmol·L-1, 250 μmol·L-1and 300 μmol·L-1, respectively.) for 24 h, and cell activity was observed by MTT assay. The outcomes demonstrated that palmitic acid with concentrations of 250 μmol·L-1and 300 μmol·L-1could considerably decrease the cell activity of L02 cells and HepG2 cells (Fig.4A-B). Therefore, 200 μmol·L-1of palmitic acid was finally choosed to treat L02 cells and HepG2 cells for 24 h to induce steatosis.
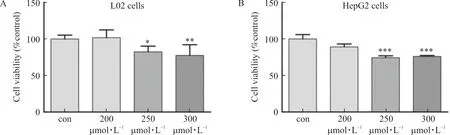
Note: L02 and HepG2 cells were treated with palmitic acid (200 μmol·L-1, 250 μmol·L-1 and 300 μmol·L-1, respectively.) for 24 h. (A) L02 cell viability was detected by MTT assay (n=6). (B) HepG2 cell viability was detected by MTT assay (n=6).
2.7 The effect of ELE on cell viability of L02 cells and HepG2 cells
L02 cells and HepG2 cells were treated with ELE (0.25, 0.5 mg·mL and 1 mg·mL, respectively.) for 24 h, and cell activity was detected by MTT assay. The outcomes manifested that the cell viability of L02 and HepG2 cells was not affected by ELE with the above concentrations (Fig.5A-B). Therefore, L02 cells and HepG2 cells could be treated with ELE with concentrations above mentioned.
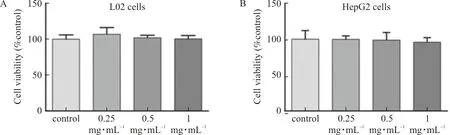
Note: L02 and HepG2 cells were treated with ELE (0.25 mg·mL-1, 0.5 mg·mL-1 and 1 mg·mL-1, respectively.) for 24 h.
2.8 ELE ameliorates lipid accumulation in PA-treated L02 cells and HepG2 Cells
ToexploretheeffectofELEonlipidaccumulation,L02cellsandHepG2cellswereimmersedin0.2mmol·L-1PAtoinducehepaticsteatosis.IntracellularlipidaccumulationwasdetectedbyOilredOstaining(Fig.6AandFig.6E).Thequantityoflipidcontentswasdetectedat510nm(Fig.6BandFig.6F).Comparedwiththecontrolgroup,PA-treatedL02cellsandHepG2cellsdisplayeddramaticalenhancementinlipiddropletsbuthepaticlipidaccumulationwasobviouslyinhibitedbyELE.WealsodetectedtheTGandTClevelsinlysatesfromL02cellsandHepG2cells.Asillustrated(Fig.6C-D,Fig.6G-H),TGandTClevelsofL02cellsandHepG2cellstreatedwith0.2mmol·L-1palmiticacidfor24hwereraised,whichwerethennotablyreversedbyELEtreatment.
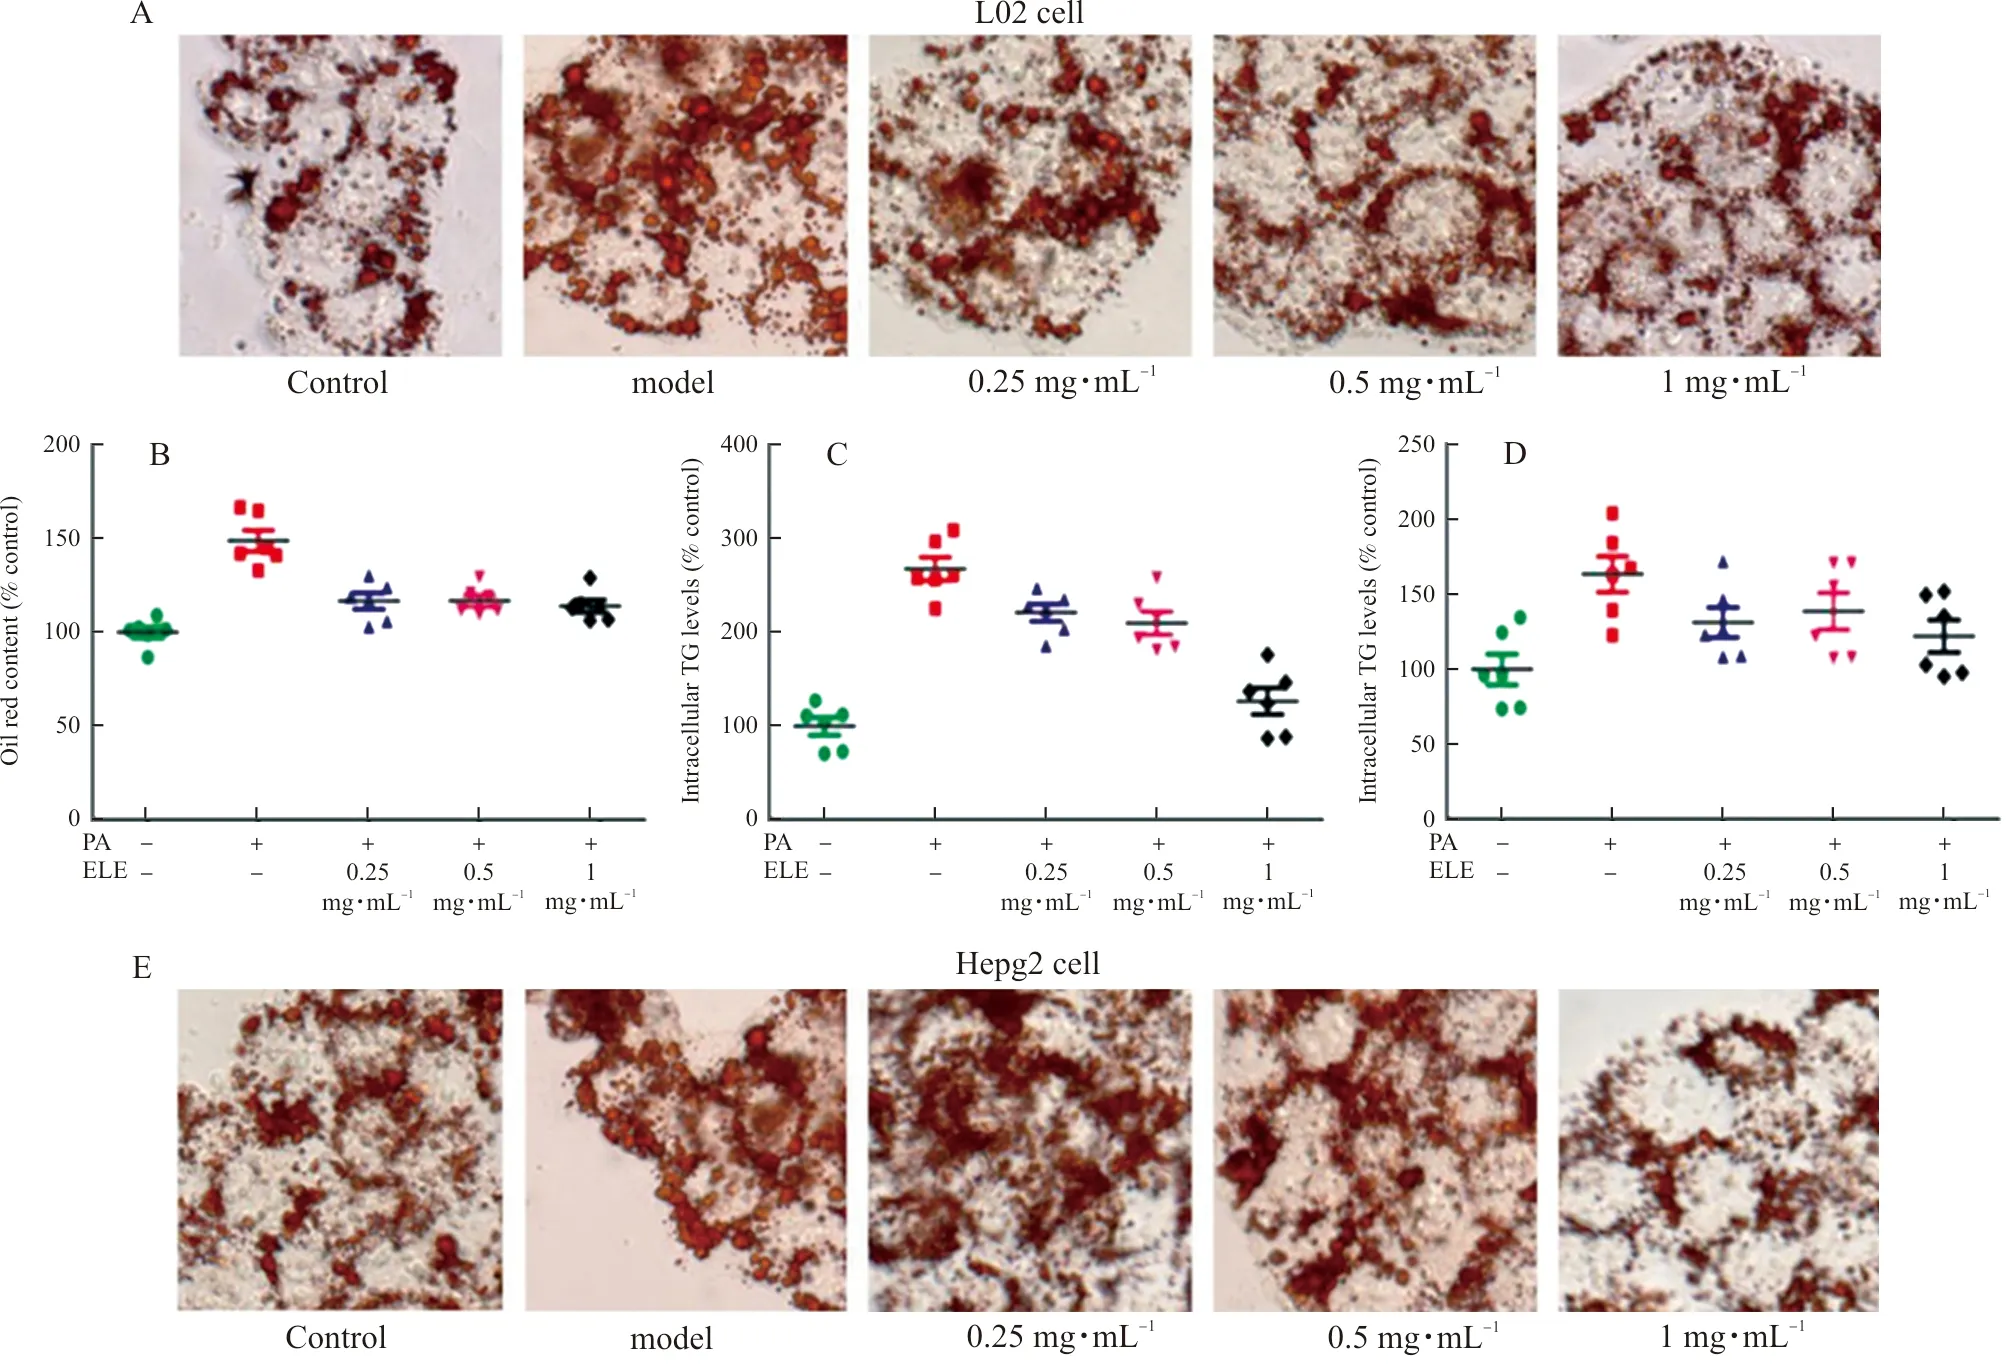
Note: L02 and HepG2 cells were pretreated with 200 μmol·L-1 PA for 24 h and treated with 0.25 mg·mL-1, 0.5 mg·mL-1, and 1 mg·mL-1 ELE for an additional 24 h. (A) Oil red O staining images of L02 cells (magnification 200×). Photographs are representative images of three independent experiments. (B) Quantitative oil red O contents measured at 510 nm. (C~D) Intracellular TG, TC levels measured using commercial kit. (n=6). (E) Oil red O staining images of HepG2 cells (magnification 200×). Photographs are representative images of three independent experiments. (F) Quantitative Oil red O contents measured at 510 nm. G-H. Intracellular TG, TC levels measured using acommercial kit.
2.9 ELE improves lipid metabolism by activating AMPKα in PA-treated L02 cells and HepG2 Cells
TodiscoverthemechanismconcerningtheinhibitionofPA-treatedlipidaccumulationbyELEinL02cellsandHepG2cells,wedetectedtheproteinandmRNAexpressionofPPARαandCPT-1A.Comparedwiththecontrolgroup,palmiticacid-treatedgroupindicateddownregulatedlipolyticgenes,includingPPARαandCPT1-A.Conversely,ELEimprovedtheproteinexpression(Fig.7A-B,Fig.7E-F)andmRNAexpression(Fig.7C-D,Fig.7G-H)ofPPARαandCPT-1AcomparedwithPA-treatedL02cellsandHepG2cells.Besides,wealsoexaminedtheeffectofELEonp-AMPKαandAMPKαbyWB.PAtreatmentcausedapparentlyreducedlevelsofp-AMPKα,whileELEtreatmentimmenselyincreasedp-AMPKα/AMPKαlevelsinadose-dependentmanner.

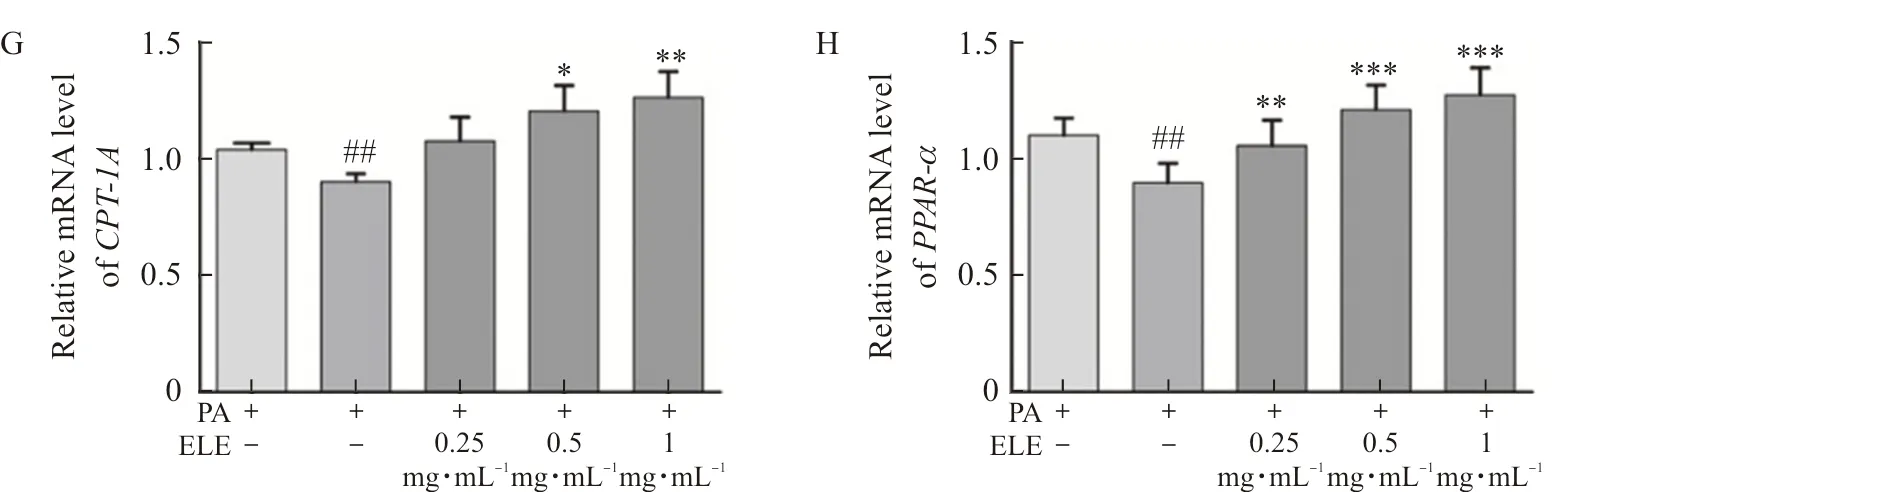
Note: L02 and HepG2 cells were pretreated with 200 μmol·L-1 PA for 24 h and treated with 0.25 mg·mL-1, 0.5 mg·mL-1, and 1 mg·mL-1 ELE for an additional 24 h. (A) The protein expression of P-AMPKα, AMPKα, PPARα, CPT-1A in PA-treated L02 cells (n=3). (B) Densitometric analysis of western blot. (C-D) The gene expression of CPT-1A, PPARα in PA-treated L02 cells (n=3). (E) The protein expression of P-AMPKα, AMPKα, PPARα, CPT-1A in PA-treated HepG2 cells (n=3). (F) Densitometric analysis of western blot in (E). (G-H) Gene expression of CPT-1A, PPARα in PA-treated HepG2 cells (n=3).
2.10 ELE attenuates liver injury and obesity in HFD-fed mice
WefirstlyinvestigatedwhetherELEwasabletoresistHFD-inducedNAFLDinmice.TheliverinjuryandtheprotectivepotencyofELEwereverifiedbyhepaticmorphologicexamination.Asdemonstrated(Fig.8A),thecontrolgroupdisplayednoapparentabnormalities,whereaslong-termHFDfeedingconsiderablyimprovedtheliversizeandalteredthelivercolor.Moreover,thebodyweight,liver/bodyweightratioandbellyweightinHFD-fedmiceweremarkedlygreaterthanthoseinthecontrolgroup,whileELEtreatmentreversedthistendency(Fig.8B-E).Furthermore,asdisplayed(8F-G),HFD-fedmicefor8weeksdevelopedhepaticinjurywithhigherserumlevelsofALTandASTcomparedwiththecontrolgroup.However,thesevariationswereevidentlyreversedbyELEtreatment,suggestingtheprotectiveinfluenceofELEonHFD-inducedhepaticinjury.Accordingly,ELEtreatmentmarkedlyrelievedliverinjury.
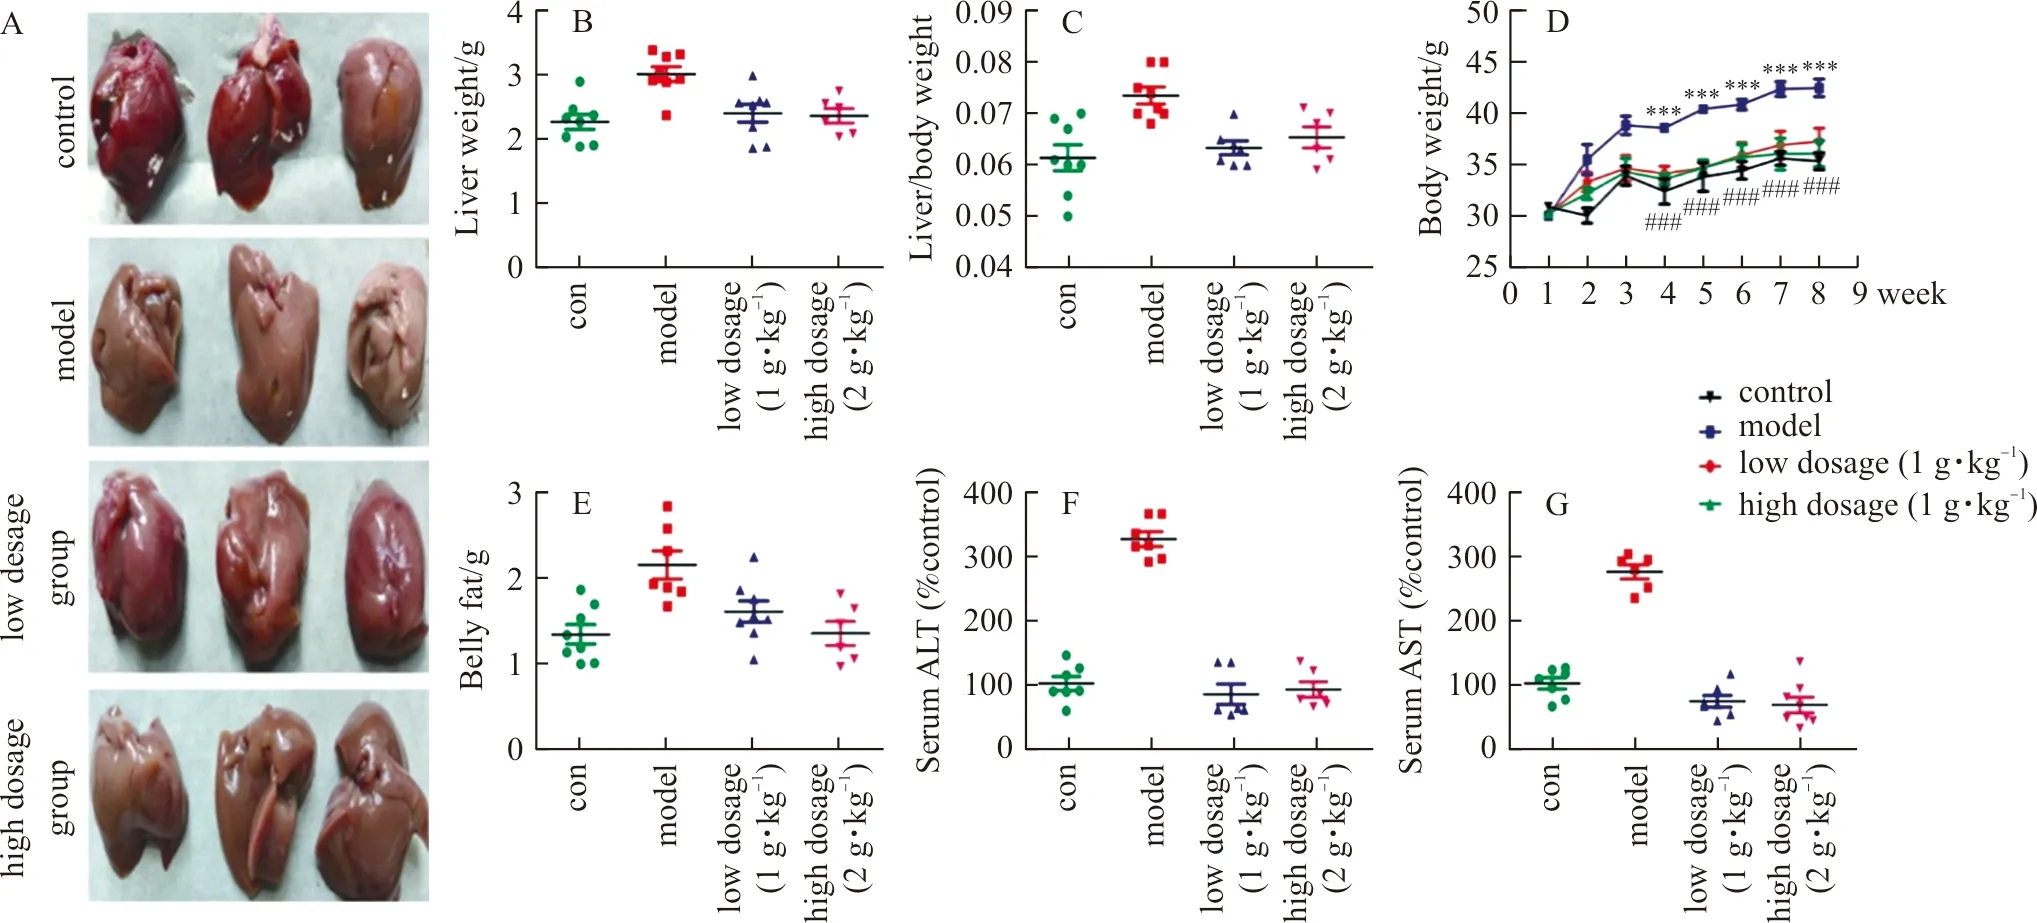
Note: With the HFD, mice were treated daily with ELE (low dosage group:1 g·kg-1, high dosage group:2 g·kg-1) or PBS (control group, model group). (A) Macroscopic view of mice liver in different groups (n=3). (B) Effect of ELE on mice liver weight (n=7-8). (C) Effect of ELE on the ratios of liver weight to body weight (n=7-8). (D) The changes of mice body weight (n=7-8). (E) Effect of ELE on belly weight (n=7-8). (F) Effect of ELE on serum ALT (n=7-8). (G) Effect of ELE on serum AST (n=7-8).
2.11 ELE ameliorates hepatic steatosis in HFD-fed mice
HepaticsteatosisisprimarilycriticalalongthedevelopmentofNAFLD.Therefore,wethenevaluatedthepotencyofELEonthepathogenesisofHFD-inducedNAFLD.Asshown(Fig.9A),oilredOstainingofhepatictissueshowedthatthedailytreatmentwithELEfor8weeksenormouslyattenuatedlipidaccumulationinmice.Inaddition,weanalyzedtypicalbiochemicalmarkerstofurtherexpoundtheprotectivepotentialofELEagainstNAFLD.Asindicated(Fig.9B-H),afterHFDfeedingfor8weeks,theTG,TC,LDL-C,fastbloodglucoseandoralglucosetolerancelevelsfromserumaswellasTGandTClevelsfromtheliverweredramaticallyhigherthanthoseinthecontrolgroup.However,ELEtreatmentabrogatedtheseincrease.TheseresultssuggestedtheprotectivepotencyofELEonlipidaccumulation.

Note: With the HFD, mice were treated daily with ELE (low dosage group:1 g·kg-1, high dosage group:2 g·kg-1) or PBS (control group, model group). (A) Oil red O staining of liver tissue (magnification 400×) (n=3). (B-C) Liver TG, TC levels measured using a commercial kit (n=7-8). (D) The level of fast blood glucose (n=7-8). (E) The level of oral glucose tolerance (n=7-8). (F-H) Serum TG, TC, LDL-C levels measured using a commercial kit (n=7-8).
2.12 ELE alleviates liver lipid metabolism by activating AMPKα in HFD-fed mice
Toexplicatethemolecularmechanisms,weassessedtheproteinandmRNAexpressionofPPARαandCPT-1Ainhepatictissue.Asdemonstrated,proteinandmRNAlevelsofCPT-1AandPPARαdecreasedevidentlyintheHFDgroupcomparedwiththecontrolgroup.Nevertheless,ELEtreatmentcauseddose-dependentincreasebothinproteinlevels(Fig.10A-B)andmRNAlevels(Fig.10C-D)ofPPARαandCPT-1A.Furthermore,long-termHFDfeedingledtoenormouslyreducedlevelsofp-AMPKα,whereasELEenhancedp-AMPKαlevel.TheseresultsindicatedthatELEcouldrelieveNAFLDbyactivatingAMPKα.

Note: With the HFD, mice were treated daily with ELE (low dosage group:1 g·kg-1, high dosage group:2 g·kg-1) or PBS (control group, model group). (A) Protein expression of P-AMPKα, AMPKα, PPARα, CPT-1A in HFD-fed mice liver tissue. (B) Densitometric analysis of western blot (n=3). (C-D) The gene expression of CPT-1A, PPARα in HFD-fed mice liver tissue (n=3).
3 Discussion
NAFLDcanbetriggeredbytheenhancementofperipherallipolysis,TCsynthesis,andhepaticfatover-accumulation[22].Accordingly,anymedicationswhichcanhindertheincreasementoftheabovemayhavethepotentialfortreatingNAFLD.Disappointedly,therearestillnoeffectivetherapiesforNAFLDapprovedbyFDA[23],whichindicatesefficaciousremediesareurgentlyneededtobedeveloped.Inthepresentstudy,wefoundELEcouldobviouslyattenuatehepaticsteatosisandlipidaccumulationbyactivatingAMPKαinHFDinducedmice,aswellasinPA-inducedL02cellsandHepG2cells.
Networkpharmacologycanaffordaninnovativeaccessforprognosticatingthelatentmechanismsamongthecomplicatedingredients,targets,andpathwaysofTCM[24],whichmethodologyalsodisclosesthemultifariousnetworkconnectionsbetween"drugtargetanddisease"byemployingacombinationofapproachesofassemblage,high-throughputscreening,andnetworkanalysis[25].Inourresearch,9chemicalmoleculesfromELEtotallyyielded346presumedtargetsand35commontargetswereidentifiedaccordingtothecommontargetsbetweenELEandNAFLD.What'smore,thePPInetworkrevealedPPARAandCPT-1AplayanimportantroleinalleviatingNAFLD,whichtwotargetswereassociatedwithlipidoxidation.Inaddition,ourpathwayenrichmentanalysismanifestedAMPKsignalingpathwaywasconsiderablyrelatedtotheemergenceanddevelopmentofNAFLD.Consequently,wehypothesizeELEmayalleviateNAFLDbyactivatingAMPKαandtherebyfurtheractivatingPPARαandCPT-1A.
Thehigh-fatdiet,namelymodernwesterndiets,isderivedfromtheassociationbetweenNAFLDandobesity[26].InHFD-inducedmice,theconsiderableincreasementofbodyweight,bellyweight,liverweightindex,ALT,ASTandfastbloodglucosefromserum,andevenliverinjurywerenoticed,inaccordancewiththeearlierresearch[27].What'smore,TG,TC,LDL-ClevelsfromliverandserumwerealsoimprovedbyHFDsupply[28].Inthecurrentresearch,ELEcouldremarkablydecreaseserumAST,ALT,TG,TC,LDL-CandhepaticTG,TCinHFD-fedmice.TheseresultsmanifestthatELEcanefficientlydecreasehepaticfataccumulationandprotectagainstliverinjury.
AMPKisavitalcellularenergysensorandadjustshepaticandadiposelipidmetabolismbymodulatinglipogenesisandlipolysis[29].ActivationofAMPKαinducesphosphorylationofacetyl-CoAcarboxylasewhichisapivotalenzymetocatalyzethegenerationofmalonyl-CoA,consequentlyimprovingtheactivityofCPT-1A[30].Asarate-limitingenzyme,CPT-1Amanifestsvitalpotencyintheβ-oxidationoffattyacidsinthemitochondria[31].PPARα,whichisaligandactivatednuclearreceptorthatpositivelyadjustsfattyacidusageandmetabolism,ishighlyexpressedintheliverandadiposetissue;nevertheless,PPARαexpressionisdownregulatedinNAFLDhumanliver.PPARαalsoillustratesprotectivefunctionforlivertissuebyactivatingfattyacidβ-oxidationrelatedpathwayinHFD-fedmice;furthermore,PPARαcaninducethehighexpressionofCPT-1Ainlivertissueandimproveglucosehomeostasis[32].Inthepresentresearch,theproteinexpressionsofP-AMPKα,PPARαandCPT-1AwerereducedinHFD-inducedmice.However,ELEtreatmentnoticeablyreversedtheexpressionoftheabove,whichwereconsistentwiththedataofTG、TCandLDL-Clevelsfromserum,andTG、TClevelsfromtheliver.TheresultsdemonstratethatELEmaycontroltheexpressionofPPARαandCPT-1Arelatedtolipidmetabolism,whichmaybecausedbytheactivationofAMPKα.
Tofurthercertifythefindingsinvivo,theexperimentinvitrowasdesignedandconductedinpalmiticacid-inducedL02cellsandHepG2cells.ThefindingsdisplayedthatELEobservablyreducedintracellularlipiddroplets,andpromotedtheproteinexpressionsofp-AMPKα,PPARAandCPT-1A,inaccordwiththeinternalexperimentalresults.ItisinferredthatELEcanrelieveNAFLDbyactivatingAMPKαandenhancetheexpressionsofPPARAandCPT-1A.
Therefore,ELEmaybeusedasapotentialtherapeuticagenttoholdbackNAFLDprogressiononaccountofitsfunctiontoincreaselipidoxidationbyactivatingAMPKα.
Takentogether,ourstudiesillustratethatELEcanalleviateNAFLDinvivoandinvitroonaccountofthenetworkpharmacologystudyandtheunderlyingmechanismmaybeconcernedwithAMPKsignalingpathway.Furthermore,activationofAMPKαbyELEcanenhancelipidoxidationbyupregulatingtheexpressionsofPPARαandCPT-1A.However,furtherstudiesareindispensabletobeperformedtoexpoundtheotherpossiblemolecularmechanismsofELEonNAFLD.
猜你喜欢
华人时刊(2022年15期)2022-10-27
疯狂英语·新读写(2022年5期)2022-04-29
华人时刊(2021年15期)2021-11-27
华人时刊(2020年19期)2021-01-14
华人时刊(2020年17期)2020-12-14
华人时刊(2020年15期)2020-12-14
华人时刊(2020年13期)2020-09-25
文苑(2020年8期)2020-09-09
华人时刊(2020年23期)2020-04-13
华人时刊(2019年21期)2019-05-21