
The feasibility study of the indium oxide supported silver catalyst for selective hydrogenation of CO2 to methanol
2022-08-30 12:07KaihangSunZhitaoZhangChenyangShenNingRuiChangjunLiu
Green Energy & Environment 2022年4期
Kaihang Sun,Zhitao Zhang,Chenyang Shen,Ning Rui,Chang-jun Liu
School of Chemical Engineering and Technology,Tianjin University,Tianjin,300072,China
Abstract Silver catalyst has been extensively investigated for photocatalytic and electrochemical CO2 reduction.However,its high activity for selective hydrogenation of CO2 to methanol has not been confirmed.Here,the feasibility of the indium oxide supported silver catalyst was investigated for CO2 hydrogenation to methanol by the density functional theoretical (DFT) study and then by the experimental investigation.The DFT study shows there exists an intense Ag-In2O3 interaction,which causes silver to be positively charged.The positively charged Ag species changes the electronic structure of the metal,facilitates the formation of the Ag-In2O3 interfacial site for activation and dissociation of carbon dioxide.The promoted CO2 dissociation leads to the enhanced methanol synthesis via the CO hydrogenation route as CO2*→CO*→HCO*→H2CO*→H3CO*→H3COH*.The Ag/In2O3 catalyst was then prepared using the deposition-precipitation method.The experimental study confirms the theoretical prediction.The methanol selectivity of CO2 hydrogenation on Ag/In2O3 reaches 100.0% at reaction temperature of 200°C.It remains more than 70.0%between 200 and 275°C.At 300°C and 5 MPa,the methanol selectivity still keeps 58.2%with a CO2 conversion of 13.6%and a space-time yield(STY)of methanol of 0.453,which is the highest methanol STY ever reported for silver catalyst.The catalyst characterization confirms the intense Ag-In2O3 interaction as well,which causes high Ag dispersion,increases and stabilizes the oxygen vacancies and creates the active Ag-In2O3 interfacial site for the enhanced CO2 hydrogenation to methanol.
Keywords: Carbon dioxide;Hydrogenation;Methanol;Indium oxide;Silver
1.Introduction
With the increasing concern on the emission control of carbon dioxide,the catalytic CO2conversion has attracted worldwide attentions.Among various options for CO2conversion,the hydrogenation of CO2to methanol is very promising with the rapid development of renewable energy.It can convert carbon dioxide in a large scale.The product,methanol,has broad applications as chemical intermediate and fuel.The catalyst with high activity and selectivity for CO2hydrogenation becomes the key for the further applications.From the reported works,the copper-based catalysts are the mostly investigated ones for CO2hydrogenation to methanol[1-4].Noble metals like palladium,platinum,gold,rhodium,and iridium have been frequently used either as the catalyst(including the bimetallic catalyst) or as the promoter.However,a few works can be found in the literature with silver as the principal catalyst or as the promoter for CO2hydrogenation to methanol.Silver has a relatively low price.Silver based catalysts have indeed attracted significant attentions.However,most of the reported silver catalysts are for oxidation reactions.According to the Web of Science,16,986 papers was found with topics of Ag and catalyst since 2000 (by January 25,2021).Among them,6254 were for oxidation and 1255 for hydrogenation.A well-known example is the epoxyethane production from oxidation of ethylene over Ag catalyst.33 papers were found with topics of ‘Ag’,‘catalyst’,‘hydrogenation’,‘CO2’and‘methanol’.However,only a few papers are directly related with the supported Ag catalysts for hydrogenation of carbon dioxide to methanol [5-12] with some other papers using silver as the promoter [13,14].Ag/ZrO2presents a higher methanol selectivity from CO2hydrogenation than Cu/ZrO2[6-8],although its activity is lower than Cu/ZrO2.An increase of the t-ZrO2phase and Ag+content causes an increase in the rate of methanol formation [11].A high dispersion or a small size of the silver catalyst is also favored for the selective hydrogenation of CO2to methanol [10].In general,the activity of the reported silver catalysts is not high for CO2hydrogenation to methanol.Different from palladium and platinum,silver is lack of affinity toward hydrogen because of the filled d-band[15].The further improvement in the catalyst preparation is needed in order to improve the activity of silver catalysts for CO2hydrogenation to methanol [15].
Very recently,we found the In2O3has an intense interaction with palladium [16-19],nickel [20],rhodium [21],platinum[22,23] gold [24,25] and iridium [26,27].This intense interaction leads a high metal dispersion and high activity towards selective hydrogenation of carbon dioxide to methanol,which has been confirmed as well by other groups [16,19,23,28].This is especially unusual for Ni,Rh,Pt,Au and Ir catalysts,which have normally poor activity for CO2hydrogenation to methanol.In this work,we attempt to load the silver catalyst onto In2O3.We confirm the In2O3supported Ag catalyst is active towards the selective hydrogenation of CO2to methanol.
2.Methodology
2.1.Computational methods
All the theoretical calculations were carried out using the Vienna ab initio simulation package (VASP) using a planewave basis set[29,30].The projector augmented wave(PAW)method is used to describe the interaction between the valence electrons and the atomic cores [31].The exchange and correlation energies were calculated using the Perdew-Burke-Ernzerhof (PBE) functionals [32].Based on the results of XRD,the (111) facet was chosen because it is the most thermodynamically stable facet of this phase [33].The In2O3(111) surface was modeled as a periodically repeated slab consisting of 72 O atoms and 48 In atoms distributed in three atomic layers and is separated by a vacuum layer of 12 Å.The oxygen vacancy is created by removing one oxygen atom from the perfect In2O3(111)surface.The supercell has a dimension of 14.56 Å × 12.61 Å × 20.04 Å.A plane-wave basis set with a cutoff energy of 400 eV and a (3 × 3 × 1) kpoint grid generated with the Gamma-Centered scheme was found to give the converged results.The geometry optimization and self-consistent field convergence criterion were set to 0.03 eV Å-1and 10-5eV,respectively.The top two tri-layers were allowed to fully relax while the bottom tri-layer was fixed at the equilibrium position.The Ag4cluster in the gas phase was calculated and optimized in an a=b=c=20 Å lattice.The Ag/In2O3model is established by placing the optimized Ag4cluster on the defective In2O3(111) surface.
The adsorption energies of intermediates M were calculated as:

2.2.Experimental methods
The In2O3support was prepared via the precipitation method.The desired amount of In(NO3)3·4H2O (2.41 g,HWRK Chem,99.99%) was dissolved into the deionized water as the precursor solution (0.15 mol L-1).3.50 g of sodium carbonate hydrate (Tianjin Kermel Chemical Reagent,99%) was also dissolved into the deionized water as the precipitant solution(0.2 mol L-1).Firstly,the precipitant solution was dropped into the precursor solution with vigorous stirring under 80°C until the pH value reached 7.The mixture was aged for another 3 h under the same condition.The precipitate was then washed with deionized water several times.After dried at 80°C overnight,the as-prepared solid was calcined in static air at 450°C for 3 h.
The Ag/In2O3catalyst was prepared via the depositionprecipitation method.Silver nitrate (Aladdin Industrial Corporation,Shanghai,99.99%,metal basis) was dissolved into 50 mL deionized water.Then the as-prepared In2O3support was added into the solution,followed by vigorous stirring for 1 h at room temperature.An excessive amount of sodium carbonate solution(1.0 g in 10 mL of the deionized water)was then added into the mixture and the formed precipitate was continuously stirred at 80°C for 3 h.After washed and filtered with 1 L deionized water,the mixture was dried in a vacuum at 60°C overnight.The actual loading weight of Ag species was determined by Inductively Coupled Plasma Optical Emission Spectrometer (ICP-OES) measurements.
77 K N2adsorption/desorption isotherms of the samples were measured on an Autosorb-1-C instrument(Quantachrome).The specific surface area(SBET)was calculated using the Brunauer-Emmett-Teller (BET) model.The bulk analytical composition of the samples was determined by inductively coupled plasma optical emission spectrometer (ICP-OES) measurements,using a Perkin Elmer Optima 5300DV system.Powder X-ray diffraction (PXRD) was conducted to characterize the textural structures of the samples,using a Rigaku D/max 2500v/pc diffractometer with Cu Kα radiation (40 kV,200 mA).The scanning rate was set to 8°min-1within the 2θ range of 10°-80°.The phase identification was made by comparison with the Joint Committee on Powder Diffraction Standards (JCPDSs).Transmission electron microscopy (TEM) measurements were performed on a JEOL JEM-2100F system equipped with an energy-dispersive X-ray spectrometer (EDX) operated at 200 kV.The sample powder was firstly suspended into ethanol and then dispersed ultrasonically for 5 min.A drop of the suspension was deposited on a copper grid coated with carbon.Temperature programmed desorption of carbon dioxide (CO2-TPD) experiments were conducted on a Micromeritics Autochem II 2920 chemisorption analyzer equipped with a Hiden HPR-20 EGA mass spectrometer (MS).100 mg of the sample was loaded into a U-shaped quartz tube and reduced with a gaseous mixture of 10%H2in Ar for 1 h at 200°C and then cool down to 50°C under flowing helium,followed by the CO2adsorption at the same temperature for 1 h.After purged by flowing helium for 1 h to remove the physically absorbed CO2,the sample was then heated to 700°C at a rate of 10°C min-1.The signals of m/z=44 and 28 were collected by the mass spectrometer.Electron paramagnetic resonance(EPR) spectra of the samples were collected at room temperature using a Bruker A300 EPR spectrometer operated at the X-band frequency.Raman spectra of the samples were collected using an inVia Reflex Renishaw Raman Spectroscopy System.The scan range is 200-800 nm with 532 nm laser as the excitation source.The laser power was set at 5 mW and the integration time is 5 s.The UV-vis absorption spectra of the samples were recorded at room temperature,using a UV-2600 UV-vis spectrophotometer(Shimadzu Corporation).
2.3.Activity tests
The catalytic tests for methanol synthesis from CO2hydrogenation over In2O3and the Ag/In2O3catalysts were performed in a vertical bed reactor.0.2 g of the sample was diluted with 1.0 g SiC before being loaded into the reactor.Firstly,the reactor with the sample was purged by flowing nitrogen for 0.5 h at room temperature.The Ag/In2O3catalyst was then pre-reduced by a gaseous mixture of 10% H2in N2at 200°C for 1 h.The reactant mixture was introduced into the reactor until the pressure reached 5 MPa at the same temperature.The reaction was performed with a gas hourly space velocity (GHSV) of 21,000 cm3h-1and a temperature range from 200°C to 300°C.The products were analyzed using an online gas chromatograph(Agilent 7890A),equipped with a thermal conductivity detector (TCD) and a flame ionized detector (FID).To prevent the condensation of methanol,all the valves and lines between the reactor outlet and the GC inlet were maintained at 140°C.
The CO2conversionmethanol selectivity(Smethanol),and space-time yield (STY) of methanol were calculated according to the following equations:
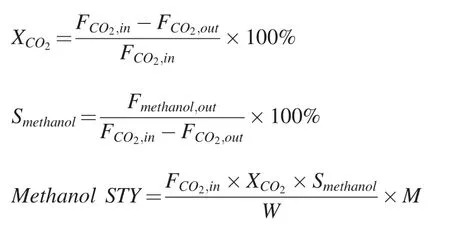
where F is the molar flow rate,M is the molar mass of methanol and W is the weight of the catalyst.
3.Results and discussions
3.1.Theoretical calculations
3.1.1.The adsorption of the Ag4cluster on the defective In2O3(111) surface
To investigate the electronic interaction between the Ag species and the In2O3support,DFT calculations were performed with a model catalyst of the Ag4cluster on the In2O3(111)with an oxygen vacancy.The loading of Ag species on the In2O3support was firstly investigated.As shown in Fig.1a,the Ag4cluster is a typical structure of the Ag cluster.The average length of the Ag-Ag bonds is 2.71 Å,which is well consistent with the literature [34,35].Fig.1b and c show the optimized structures of the perfect and the defective In2O3(111),respectively.The optimized structure of the Ag4cluster supported on the defective In2O3(111) model is named “Ag4/In2O3_D”as shown in Fig.1d.The adsorption energy of the Ag4cluster on the Ag4/In2O3_D is-1.42 eV,which is closed to that of the Ag4cluster on the m-ZrO2(111)surface(-1.49 eV)[35].The average length of Ag-Ag bonds is increased to 2.75 Å due to the interaction between the Ag4cluster and the defective In2O3surface.To gain the insight into the electronic structure of the supported Ag4cluster,Bader charge analysis was conducted.As shown in Table 1,the total charge of the free Ag4cluster is zero,indicating electrical neutrality.Due to the presence of the strong metal-support interaction (SMSI) between the Ag4cluster and the defective In2O3(111)surface,the total charge of the Ag4cluster is increased to+0.34 |e|[25,36,37].This result confirms the presence of the strong electron transfer from the Ag4cluster to the In2O3support.

Fig.1.Optimized structures of (a) Ag4 cluster,(b) perfect In2O3(111) model,(c) defective In2O3(111) model and (d) the Ag4 cluster supported on the defective In2O3(111) model.Blue: Ag atoms,red: O atoms,brown: In atoms.

Table 1 Bader charge analysis (in |e|) for the Ag4 cluster and the Ag4/In2O3 model.
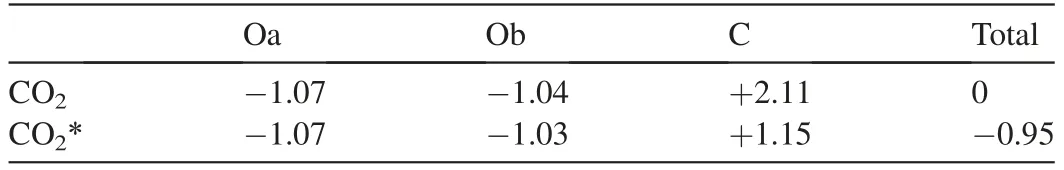
Table 2 Bader charge analysis(in |e|)for the free CO2 molecule and the adsorbed CO2 molecule (CO2*) on the Ag4/In2O3_D model.
3.1.2.The activation of CO2and H2on the Ag4/In2O3_D model
The oxygen vacancies over In2O3play a very important role in CO2adsorption as well as CO2activation [25].Therefore,the CO2adsorption on the interfacial site between the positively charged Ag4cluster and the surface oxygen vacancy of the Ag4/In2O3_D model is studied.As shown in Fig.2a,the CO2molecule can be activated on such interfacial site of the Ag4/In2O3_D model through R1 (CO2(g)+*→CO2*),with the adsorption energy of -0.50 eV.The bond length of C-Oa and C-Ob are increased to 1.34 Å and 1.24 Å,respectively.It is 1.17 Å in the free CO2molecule.In addition,the O-C-O angle becomes 123.1°.The Bader charge analysis shows that the CO2molecule is negatively charged due to the interaction with the interfacial site of the Ag4/In2O3_D model as shown in Table 2.The total charge of the adsorbed CO2is -0.95 |e|.This is also confirmed by deformation charge density,shown in Fig.2c,where the yellow iso-surface around the adsorbed CO2is clearly seen and is assigned to the accumulation of electrons.As shown in Fig.2b,hydrogen can be activated by the positive charged Ag species through R2 (H2(g)+*+*→2H*),with the adsorption energy of -0.71 eV.The average H-Ag bond length is 1.76 Å.The active H adatoms can spill over and react with the activated CO2intermediates on the interfacial site of the Ag4/In2O3model.All the results indicate that the electron transfer induced by the interaction between the Ag species and the In2O3support promotes the formation of the positively charged Ag species,which can facilitate the activation of CO2and hydrogen.
3.1.3.The dissociation of CO2on the interfacial site of the Ag4/In2O3_D model
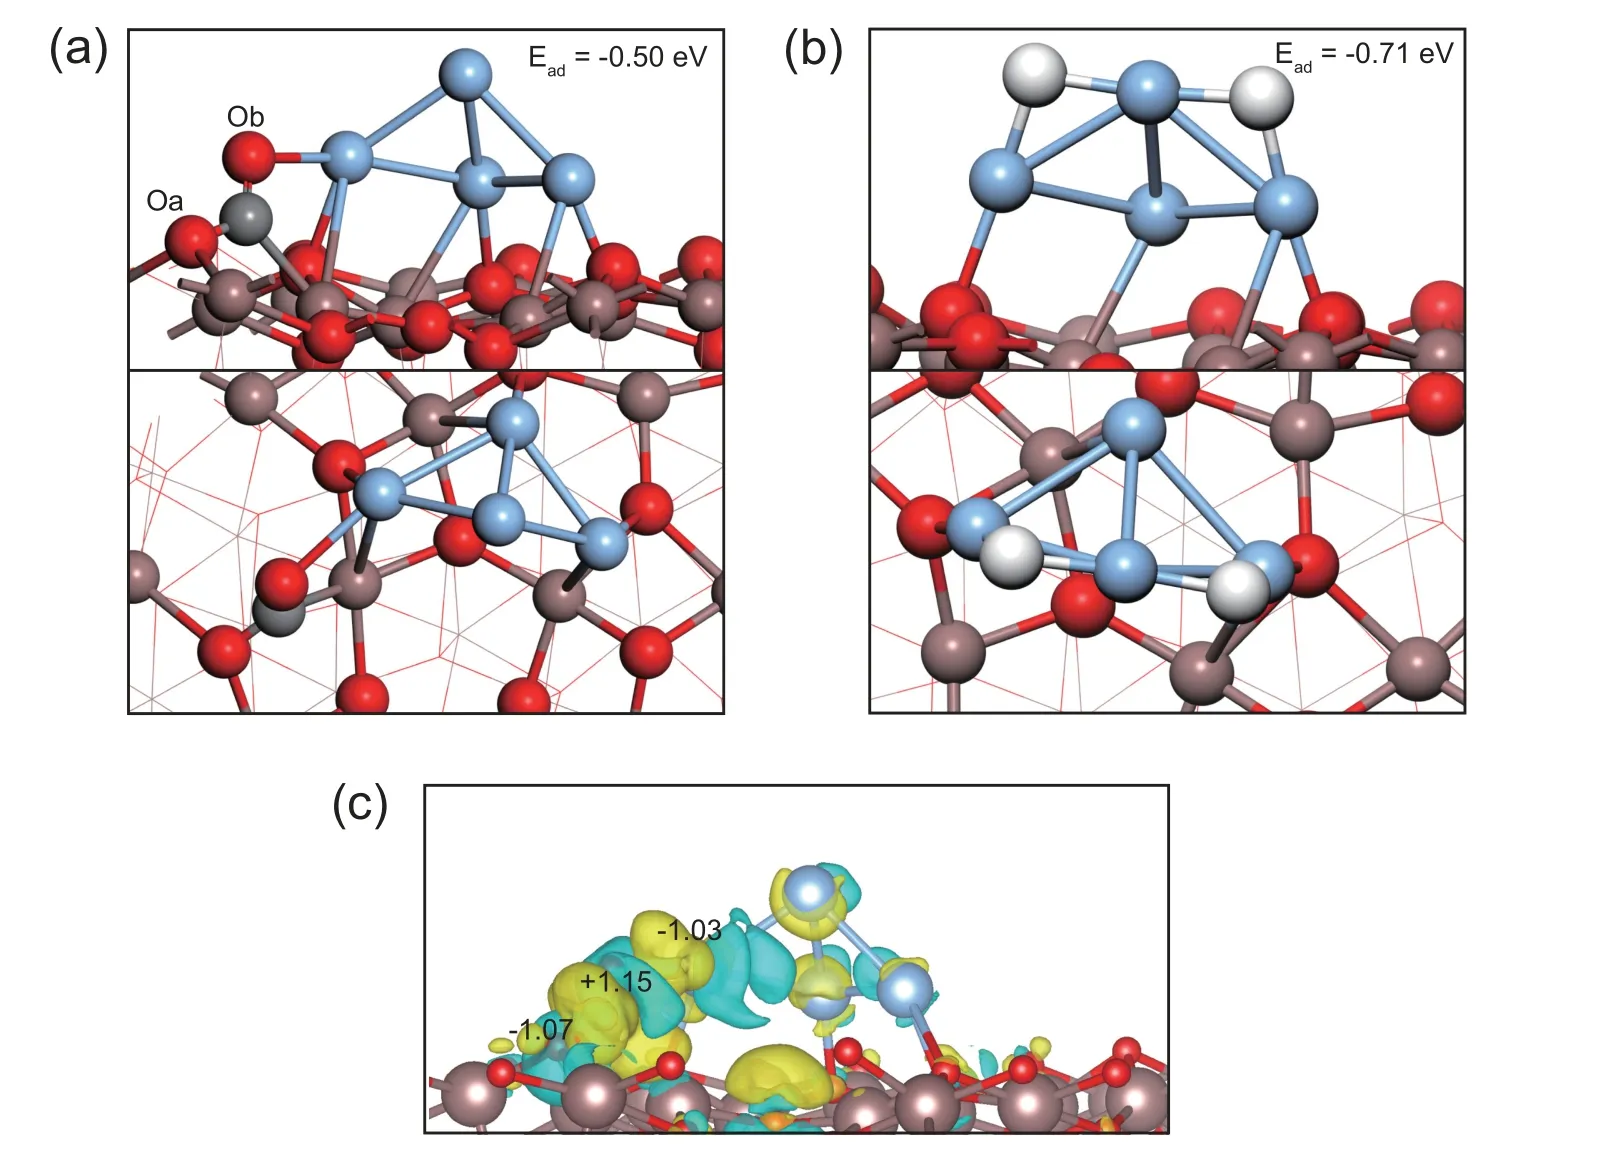
Fig.2.The optimized structure of(a)CO2 and(b)H2 adsorbed on the Ag4/In2O3_D model and(c)deformation charge density for the adsorbed CO2 on the Ag4/In2O3_D model,yellow and blue iso-surface represent electron accumulation and depletion,respectively.The iso-surface value is 0.006 |e|/bohr3.
Wang et al.[38]and Ye et al.[27]reported that the oxygen vacancies over In2O3can facilitate the CO2dissociation via the experimental and the theoretical studies,respectively.Herein,the dissociation of CO2over the interfacial site of the Ag4/In2O3_D model through R3(CO2*+*→CO*+O*)was also calculated.The potential energy surface is shown in Fig.3.The distance of C atom and Ag atom is 3.08 Å in the structure of CO2*,while it is shortened to 2.55 Å due to the formation of C-Ag bond in the transition state (TS1).Meanwhile,the C-Oa bond is slightly increased to 1.38 Å whereas the length of the C-Ob bond is decreased to 1.21 Å.The reaction is slightly endothermic by+0.10 eV with an activation barrier of 0.41 eV.The low barrier indicates that the CO2dissociation on the interfacial site of the Ag/In2O3catalyst is kinetically favorable,which also implies that the methanol synthesis on the Ag/In2O3catalyst can undergo the CO hydrogenation route.Therefore,the methanol synthesis via the CO hydrogenation route on the interfacial site of the Ag4/In2O3_D model is investigated.
3.1.4.Methanol synthesis from CO2hydrogenation via the CO hydrogenation route on the interfacial site of the Ag4/In2O3_D model
Fig.4 shows the potential energy surface of methanol synthesis from CO2hydrogenation through the CO hydrogenation route on the interfacial site of the Ag4/In2O3_D model,with comparison of the RWGS reaction.All the structural parameters and adsorption energies of the reaction intermediates involved are summarized in Table S1.The details of these structures are shown in Fig.S1.The structural details of initial states(IS),transition states(TS)and finial states(FS)are also shown in Fig.S2.The reaction energies and the activation barriers of all elementary steps involved methanol synthesis on the Ag4/In2O3_D model are listed in Table 3.
After the CO2dissociation through R3,the produced O*can react with the H adatom activated on the Ag4cluster and form the surface OH*through R4 (CO*+O*+H*→CO*+OH*+*).The transition state is TS2.This reaction is exothermic by -0.23 eV with an activation barrier of 0.99 eV,indicating that this process is both thermodynamically and kinetically favorable.In particular,the direct hydrogenation of CO2to HCOO*and COOH*are also examined to investigated the feasibility of the formate route and the RWGS route,respectively.As shown in Fig.S3,the hydrogenation of CO2to HCOO*(R14: CO2*+H*→HCOO*+*) is exothermic by-0.19 eV with a huge barrier of 1.65 eV.The hydrogenation of CO2to COOH*(R15: CO2*+H*→COOH*+*) is endothermic by+0.85 eV with an activation barrier of 1.35 eV.These results indicate that the direct hydrogenation of CO2on the interfacial site of the Ag4/In2O3_D model is not feasible,compared to R4 of the CO hydrogenation route.
The H adatom activated on the Ag4cluster can react with the C atom of CO*through R5 (CO*+OH*+H*→HCO*+OH*+*).The transition state is TS3.This reaction is endothermic by +0.32 eV with an activation barrier of 0.81 eV.Moreover,the activated H adatom can also react with OH*and produce H2O*through R6 (CO*+OH*+H*→CO*+H2O*+*).The transition state is TS4.This reaction is endothermic by +0.72 eV with an activation barrier of 1.27 eV.The CO*and H2O*proceed to desorb from the interfacial site with an overall energy cost of 1.66 eV to complete the RWGS reaction.These confirm that the activated H adatom prefers to react with the C atom of CO*due to the lower activation barrier.
Subsequently,the production of H2O*from the hydrogenation of OH*undergoes R7(HCO*+OH*+H*→HCO*+H2O*+*).The transition state is TS5.The reaction is endothermic by +0.39 eV with the activation barrier of 0.98 eV.Based on the adsorption energies of HCO*(-2.26 eV)and H2O*(-0.97 eV),H2O*can desorb from the interfacial site more easily than HCO*.
H2CO*is one of the important intermediates in methanol synthesis from CO2hydrogenation.H2CO*can be produced from the hydrogenation of HCO*through R8 (HCO*+H2O(g)+H*→H2CO*+H2O(g)+*).The transition state is TS6.The reaction is exothermic by -0.71 eV with an activation barrier of 0.98 eV,which indicates that this process is both thermodynamically and kinetically favorable.
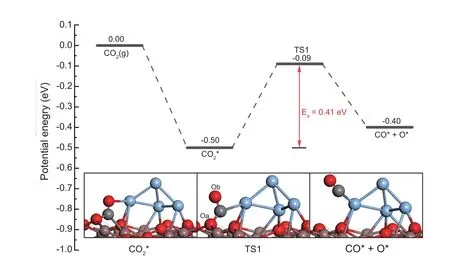
Fig.3.CO2 dissociation over the interfacial site of the Ag4/In2O3_D model.TS: transition state.

Fig.4.Potential energy surface of methanol synthesis from CO2 hydrogenation through the CO hydrogenation route and the RWGS reaction over the interfacial site of the Ag4/In2O3_D model.
The hydrogenation of H2CO*produces either H3CO*or H2COH*.The production of H3CO*(R9:H2CO*+H2O(g)+H*→H3CO*+H2O(g)+*,ΔE=-0.66 eV,Ea=1.07 eV)is much more kinetically and thermodynamically favorable than the production of H2COH*(R10: H2CO*+H2O(g) +H*→H2COH*+H2O(g)+*,ΔE=+1.18 eV,Ea=2.52 eV)due to the lower activation barrier and exothermic nature.The transition states of R9 and R10 are TS7 and TS8,respectively.
Finally,H3COH*can be produced via H3CO*protonation(R11:H3CO*+H2O(g)+H*→H3COH*+H2O(g)+*,ΔE=+0.45 eV,Ea=1.01 eV) or the hydrogenation of H2COH*(R12: H2COH*+H2O(g)+H*→H3COH*+H2O(g)+*,ΔE=-0.48 eV,Ea=1.30 eV).The hydrogenation of H2COH*is more thermodynamically but less kinetically favorable than the protonation of H3CO*.The transition states of R11 and R12 are TS9 and TS10,respectively.CH3OH*proceeds to desorb from the interfacial site with an energy cost of 0.79 eVand 0.67 eV for the CH3O pathway and the H2COH pathways,respectively.Furthermore,the potential energy surface of the CH3O pathway is always below the H2COH pathway.Therefore,methanol will mainly be produced through the CH3O pathway in the CO hydrogenation route.
3.2.Experimental results
3.2.1.Catalytic activity
Fig.5 shows the changes of CO2conversion and methanol selectivity on Ag/In2O3with the reaction temperature.The catalytic activity of In2O3is shown as well for the comparative purpose.The activity data in Fig.5a-c were collected when the reaction was carried out for 30 min.The carbon balances over both In2O3and Ag/In2O3catalyst are better than 98%.Only trace methane can be detected when the reaction temperature is beyond 275°C.As shown in Fig.5a and b,enhanced activity is achieved for CO2hydrogenation to methanol by the loading of Ag.The CO2conversion and the space-time yield (STY) of methanol on Ag/In2O3are higher than those on In2O3.The STY reaches the highest value of 0.453 gmethanolh-1on Ag/In2O3at 300°C and 5 MPa,whereas it is 0.335 gmethanolh-1on In2O3at the same condition.The STY of Ag/In2O3is around 4 times higher than the reported STY on Ag/ZrO2at 300°C [11].The product distribution of CO2hydrogenation to methanol over the Ag/In2O3catalyst at 300°C and 5 MPa is shown in Table S2.Apparent activation energies for In2O3and Ag/In2O3were calculated based on the Arrhenius equation.As shown in Fig.5c,the apparent activation energy of CO2conversion of In2O3is 101.98 kJ mol-1,which is in line with the literature[16,22,39].The Ag loading significantly reduces the apparent activation energy of CO2conversion to 86.44 kJ mol-1.This confirms that the Ag loading is favorable for the CO2hydrogenation.Fig.5d presents the stability test results of In2O3and Ag/In2O3.The methanol STY on Ag/In2O3maintains over 90% of its initial value after the 10-h reaction at 300°C and 5 MPa whereas the pure In2O3catalyst loses near 20% of its initial methanol STY after 10-h in the reaction stream.This result indicates that the addition of Ag species significantly improves the stability of In2O3.Table S3 summarizes the comparison of the catalytic activities of Ag/In2O3with some typical catalysts.
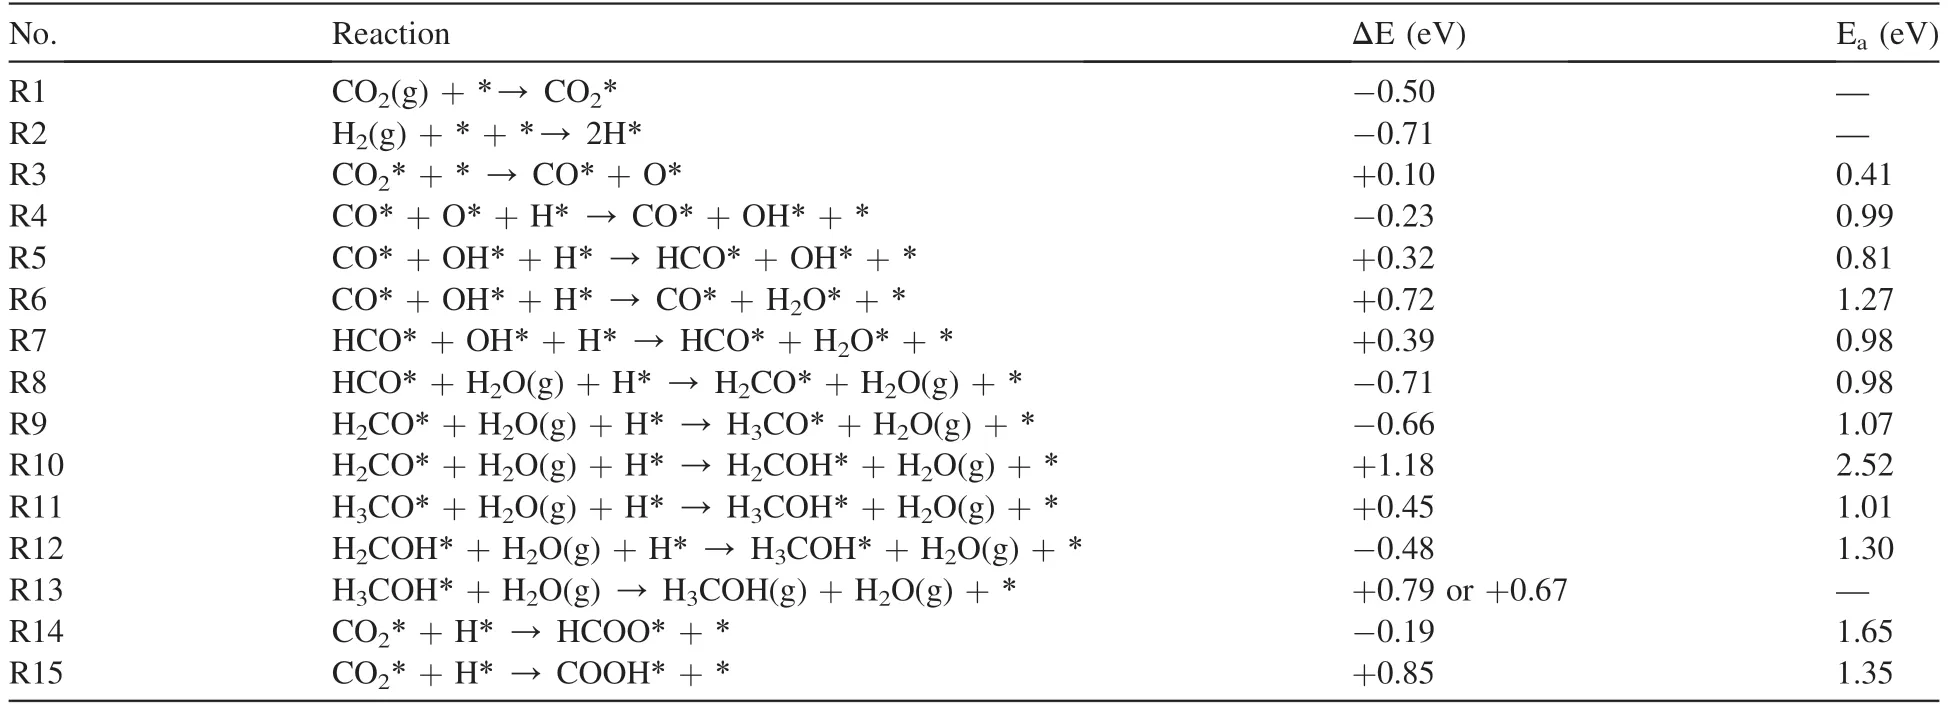
Table 3 Reaction energies ΔE (eV) and activation barriers Ea (eV) of each elementary step involved in methanol synthesis on the Ag4/In2O3_D model.
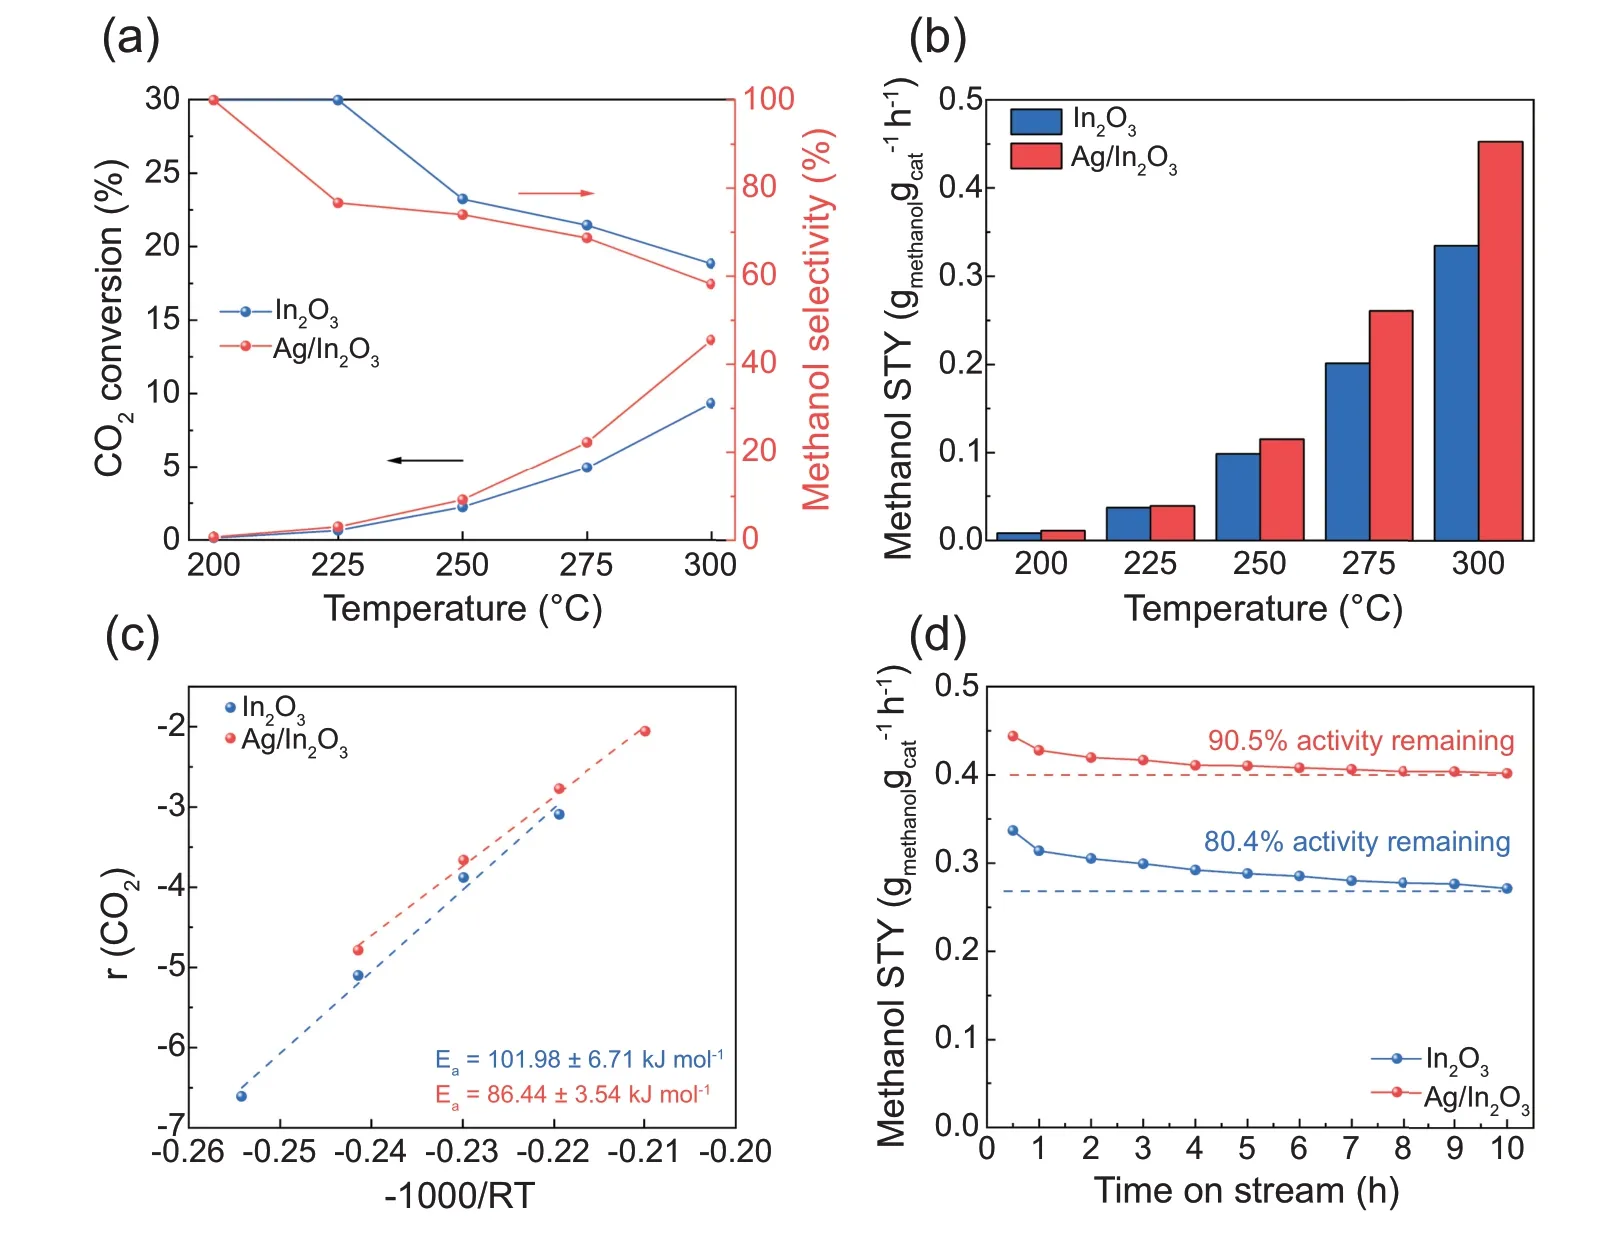
Fig.5.(a)CO2 conversion and methanol selectivity versus temperature over In2O3 and Ag/In2O3;(b)space time yield of methanol versus temperature over In2O3 and Ag/In2O3;(c)apparent activation energy of CO2 conversion over In2O3 and Ag/In2O3;(d)stability tests of In2O3 and Ag/In2O3.Reaction condition:5 MPa,H2/CO2/N2=76/19/5,GHSV=21,000 cm3 h-1.
3.2.2.Catalyst characterizations
Based on the results of N2adsorption,the specific surface area of In2O3and Ag/In2O3was 82.81 m2g-1and 89.34 m2g-1,respectively.The Ag loading has not a significant effect on the specific surface area.Fig.6 shows the X-ray diffraction (XRD)patterns of In2O3and Ag/In2O3.In the following discussions,the pristine Ag/In2O3catalyst is named as ‘Ag/In2O3-P’.The samples after hydrogen reduction are named as ‘Ag/In2O3’ and‘In2O3-R’.The samples after the reaction at 300°C and 5 MPa are assigned to ‘Ag/In2O3-AR’ and ‘In2O3-AR’.According to PDF#06-0416,the diffraction peaks centered at 21.5°,30.7°,35.5°,45.7°,51.0°and 60.7°are assigned to the diffractions from(211),(222),(400),(431),(440)and(622)facets of In2O3.This is in accordance with the results of Pd/In2O3[16,17],Pt/In2O3[22,23],Rh/In2O3[21],Ni/In2O3[20],Au/In2O3[24]and Ir/In2O3[26] catalysts.No diffraction peaks of metallic Ag or Ag2O can be observed due to the low loading weight of Ag species (0.33 wt% according to the analysis of ICP-OES) with the high dispersion over the In2O3support.To further clarify the dispersion of Ag species,TEM analyses with the cor111responding EDX elemental mapping were conducted.As shown in Fig.7,the EDX elemental maps show the extremely high dispersion of Ag species on the In2O3support.The Ag/In2O3catalyst after H2reduction(H2/N2=1/9,molar ratio,at 200°C for 1 h)and after reaction (300°C,5 MPa) remains the high dispersion of Ag species as shown in Fig.7b and c,respectively.This result confirms that the interaction between the Ag species and the In2O3support facilitates the dispersion of Ag species,which further provides much more active sites for the reaction.
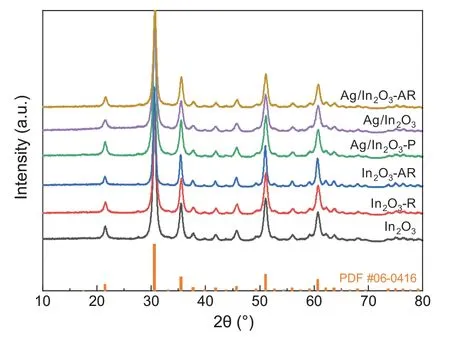
Fig.6.XRD patterns of In2O3 and Ag/In2O3.Hydrogen reduction condition:H2/N2=1/9,molar ratio,at 200°C for 1 h.
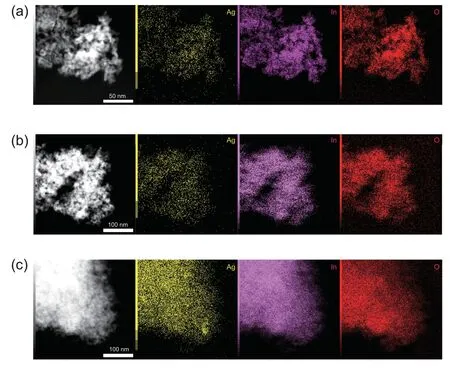
Fig.7.TEM images and the cor111responding EDX elemental maps of(a)the fresh Ag/In2O3,(b)the Ag/In2O3 after H2 reduction and(c)the Ag/In2O3 after reaction.Silver (yellow),indium (carmine) and oxygen (red).
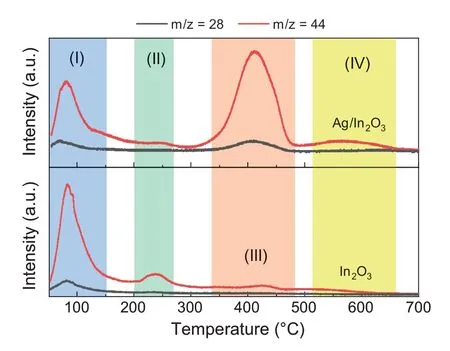
Fig.8.CO2-TPD-MS profiles of In2O3 and Ag/In2O3.
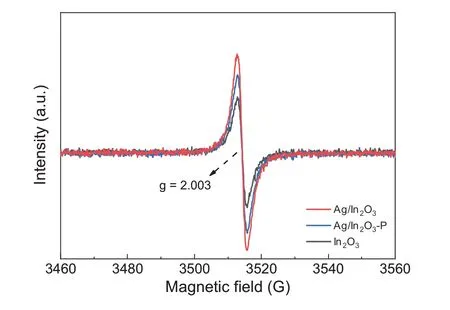
Fig.9.EPR spectra recorded at room temperature for In2O3 and Ag/In2O3.

Fig.10.Raman spectra with the ratios of I2/I1 for In2O3 (black lines)and Ag/In2O3 (red lines)under different conditions.Hydrogen reduction condition: 200°C and 1 h;Reaction condition: 300°C and 5 MPa.
The previous studies have confirmed that CO2adsorption occurs on the oxygen vacancies of In2O3.The CO2molecule can be considered as a probe to characterize the oxygen vacancies of In2O3-based catalysts as well [22,40].However,CO2can be dissociated to CO on oxygen vacancies as reported recently by Wang et al.[38].Therefore,we use a mass spectrometer (MS) to analyze the signals of temperature programmed desorption of carbon dioxide (CO2-TPD).The signals of m/z=44 were recorded as the intensities of CO2desorption whereas the signals of m/z=28 were recorded as the intensities of CO desorption.As shown in Fig.8,the CO2-TPD-MS profiles can be distinguished into four regions.In the region(I),the CO2desorption peaks located at the temperature below 100°C can be assigned to the desorption of physically absorbed CO2and CO [17,20,22,38,41].The CO signals can be attributed to the CO2dissociation under the process of CO2adsorption.The CO2desorption peaks at ca.240°C in the region(II)can be assigned to the surface oxygen vacancies of In2O3induced by hydrogen reduction.Also,the intensity of the CO2desorption of In2O3is stronger than that of Ag/In2O3.Furthermore,the CO2desorption peak of In2O3at ca.430°C in the region(III)is attributed to the thermally induced oxygen vacancies[41],whereas the peak of Ag/In2O3can be attributed to the CO2desorption on the interfacial oxygen vacancy site created by the Ag-In2O3interaction under hydrogen reduction.The CO2desorption peak of Ag/In2O3at ca.410°C exhibits a much stronger intensity.This indicates a much stronger CO2adsorption on the interfacial site of Ag/In2O3than In2O3,which is well consistent with the DFT calculations above.A broad CO2desorption peak of the Ag/In2O3sample centered at ca.560°C can be attributed to the thermally induced oxygen vacancies in the region (IV),which confirms the presence of the interaction between Ag species and the In2O3support.The total amount of oxygen vacancies of Ag/In2O3is higher than that of In2O3according to the much stronger CO2desorption on the interfacial oxygen vacancy site created by the addition of Ag species.More importantly,the CO desorption peak of the Ag/In2O3sample at ca.410°C can be observed in the region (III).The onset temperature of CO desorption is ca.350°C.This result indicates that the new oxygen vacancy site created by the addition of Ag species facilitates the activation of CO2.This is also consistent with the result of DFT calculation discussed above.
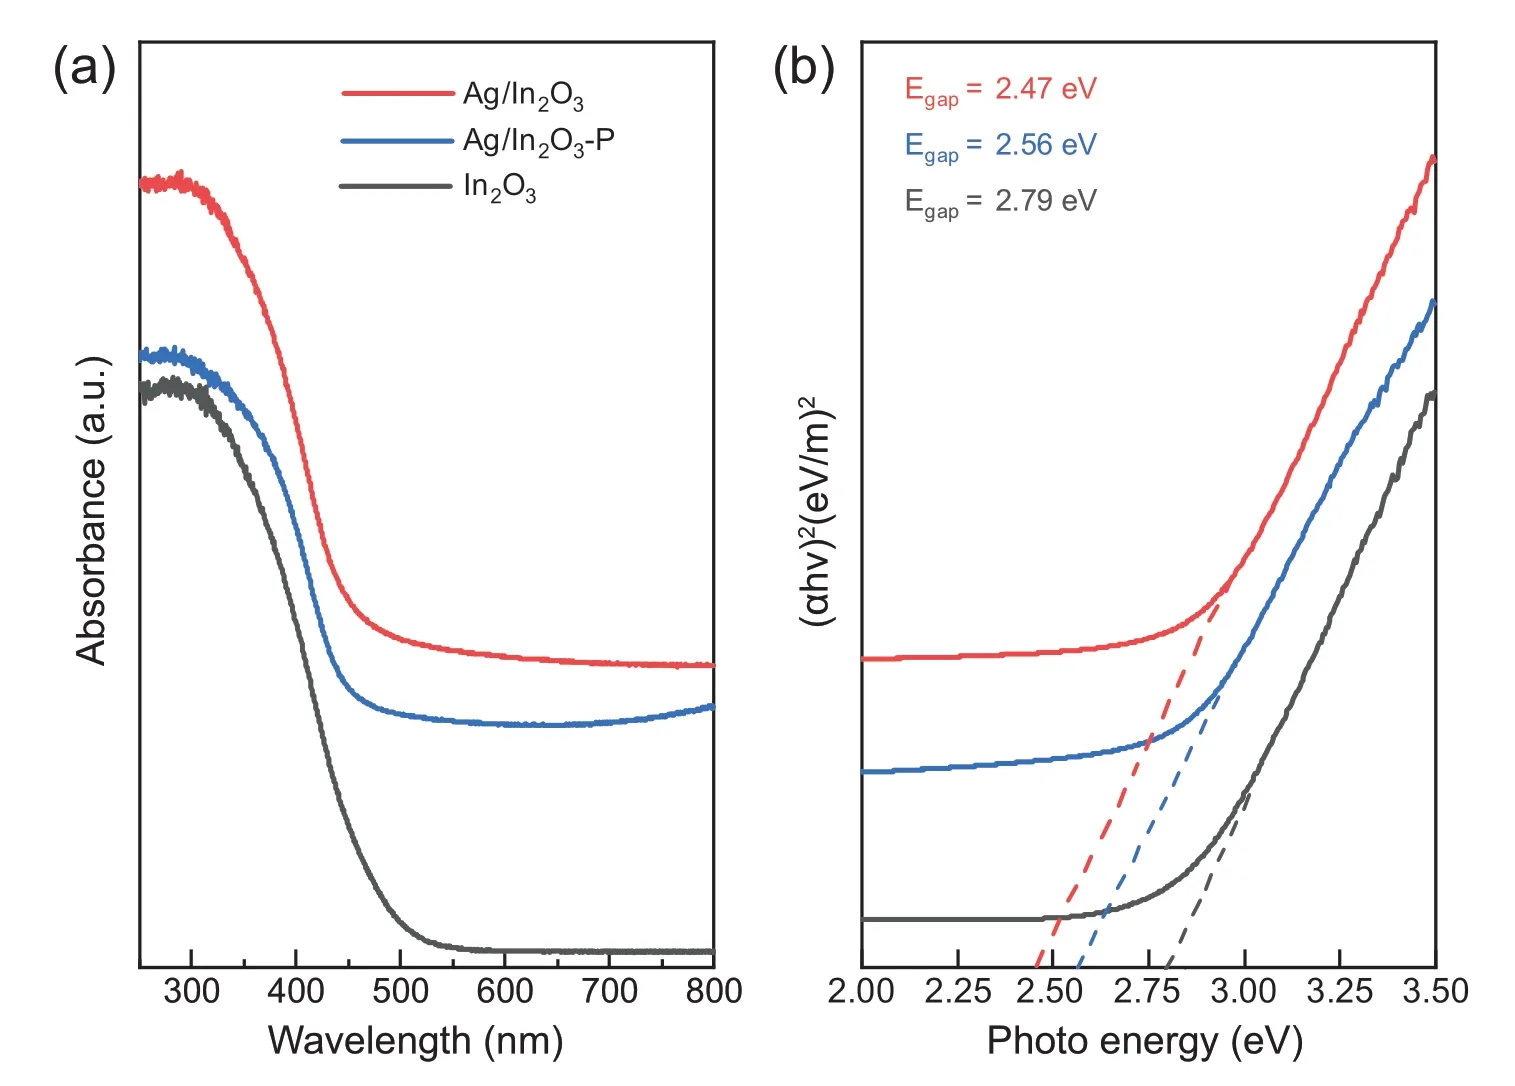
Fig.11.(a) UV-vis absorption spectra and (b) Tauc plot of the Ag/In2O3 catalyst.
To gain the insight into the oxygen vacancies influenced by the addition of Ag species,the electron paramagnetic resonance (EPR) analysis was performed.As shown in Fig.9,all samples exhibit a signal near 3510 G with a g factor of 2.003.According to the literature,singly ionized oxygen vacancies(F-centers)are paramagnetic and are expected to yield a single EPR signal centered near the free electron g-value (2.0023)[42-44].The trapped electron on or near an oxygen vacancy(F-center) can determine the visible light activity because the F-center provides a unique energy level[42,43],which can be characterized by the UV-vis absorption spectra below.Therefore,the stronger intensity of Ag/In2O3affirms that the increasing oxygen vacancy sites are created by the addition of Ag species,which is consistent with the results of CO2-TPDMS.
Typically,the oxygen vacancies of In2O3can be characterized by Raman spectra [45,46].As shown in Fig.10,all the scattering features are attributed to the vibrations of the InO6structural unit [46-48].The peaks at around 306 cm-1(I1) and 367 cm-1(I2) are assigned to the bending vibration and the stretching vibration of In-O-In in InO6octahedra,respectively.To quantify the oxygen vacancies,the integrated areas of the I1peak and the I2peak were calculated.The ratio of I2/I1can be used to characterize the amount of oxygen vacancies on In2O3[22,49,50].For the pristine samples,Ag/In2O3shows a higher ratio of I2/I1.This implies that the addition of Ag species can promote the formation of the oxygen vacancies of In2O3.Furthermore,the increasing I2/I1ratios of both In2O3and Ag/In2O3after hydrogen reduction indicates that the oxygen vacancies can be created via hydrogen reduction.It can be seen that the difference of the I2/I1ratio between In2O3and Ag/In2O3decreases after hydrogen reduction.This result indicates that Ag/In2O3exhibits the higher stability under hydrogen reduction.Combined with the results of CO2-TPD-MS,the increasing oxygen vacancies of Ag/In2O3can be attributed to the interfacial oxygen vacancy site created by the Ag-In2O3interaction under hydrogen reduction.Furthermore,the amount of oxygen vacancies on In2O3exceeds that on Ag/In2O3after reaction at 300°C and 5 MPa.As reported by Tsoukalou et al.[51],In2O3itself is not very stable under the reaction conditions of CO2hydrogenation to methanol.They claimed that the formation of metallic indium as a result of the partial reduction of In2O3results in the deactivation,which typically occurs at elevated temperatures.Therefore,the addition of the Ag species stabilizes the structure of the catalyst under the reaction conditions.
To further understand the oxygen vacancies of Ag/In2O3induced by the addition of Ag species and hydrogen reduction,UV-vis absorption spectra was analyzed.As shown in Fig.11a,a strong UV absorption is observed in all samples due to the semiconductor nature of In2O3[22].The band gap can be determined by the absorption using the Tauc relationship.As the results shown in Fig.11b,the band gap is 2.79 eV,2.56 eV and 2.47 eV for In2O3,Ag/In2O3-P and Ag/In2O3,respectively.The narrowed band gap for the Ag/In2O3-P can be attributed to the oxygen vacancies created by the addition of Ag species [45,46],which is consistent with the results of EPR above.In addition,the band gap of Ag/In2O3is further narrowed,cor111responding to the formation of interfacial oxygen vacancy site created by the Ag-In2O3interaction under hydrogen reduction [45,46].This confirms the results of CO2-TPD-MS discussed above.
4.Conclusions
In conclusion,the DFT and experimental studies confirmed the methanol synthesis from CO2hydrogenation over the Ag/In2O3catalyst is feasible.The intense interaction between the Ag4cluster and the defective In2O3(111)surface makes the Ag4cluster positively charged.The interfacial site between the positively charged Ag4cluster and surface oxygen vacancy of the Ag4/In2O3_D model facilitates the activation and the dissociation of CO2,resulting in methanol synthesis via the CO hydrogenation route.The methanol selectivity of Ag/In2O3reaches 100.0%at reaction temperature of 200°C.It remains more than 70.0% between 200 and 275°C.The CO2conversion reaches 13.6%with the methanol selectivity of 58.2% at 300°C and 5 MPa.The methanol STY is 0.453 gmethanolh-1under the same condition.This is the highest methanol STY ever reported on Ag catalysts for CO2hydrogenation to methanol.The catalyst characterization indicates a high Ag dispersion on In2O3.The intense Ag-In2O3interaction promotes the formation of interfacial oxygen vacancy site with increasing amount of oxygen vacancies.The enhanced activity is thereby achieved.
Conflict of interest
The authors declare that they have no known competing financial interests or personal relationships that could have appeared to influence the work reported in this paper.
Acknowledgments
This work was supported by the National Key Research and Development Program of China (2016YFB0600902).
Appendix A.Supplementary data
Supplementary data to this article can be found online at https://doi.org/10.1016/j.gee.2021.05.004.
 Green Energy & Environment2022年4期
- Green Energy & Environment的其它文章
- Multivariate MOF for optimizing atmospheric water harvesting
- Lignin-based carbon fibers: Formation,modification and potential applications
- Charactering and optimizing cathode electrolytes interface for advanced rechargeable batteries: Promises and challenges
- Metal-organic frameworks-derived metal phosphides forelectrochemistry application
- Surface-mediated iron on porous cobalt oxide with high energy state for efficient water oxidation electrocatalysis
- Oxygen-deficient SnO2 nanoparticles with ultrathin carbon shell for efficient electrocatalytic N2 reduction