
Ru thickness-dependent interlayer coupling and ultrahigh FMR frequency in FeCoB/Ru/FeCoB sandwich trilayers
2022-08-31 09:55LeWang王乐ZhaoXuanJing荆照轩AoRanZhou周傲然andShanDongLi李山东
Chinese Physics B 2022年8期
关键词:山东
Le Wang(王乐) Zhao-Xuan Jing(荆照轩) Ao-Ran Zhou(周傲然) and Shan-Dong Li(李山东)
1College of Physics,Qingdao University,Qingdao 266071,China
2College of Electronics and Information,Qingdao University,Qingdao 266071,China
Keywords: interlayer exchange coupling,optical mode resonance,acoustic mode resonance,component gradient sputtering
1. Introduction
In 1988, Heinrichet al. observed optical mode ferromagnetic resonance (FMR) caused by interlayer exchange coupling (IEC) in an ultrathin epitaxial single crystal Ni/Fe bilayer.[1]The IEC was widely used in magnetic devices,[2,3]such as magnetic recording devices, giant magnetoresistance effect, tunneling magnetoresistance effect,[4–8]etc. The materials currently used to study IEC are mainly composed of Fe,[9–11]Co,[12]FeCo,[13]NiFe,[14–17]and FeCo alloys,[18–34]separated by non-ferromagnetic materials, such as Cu,[14,35]Cr,[9,36]and Ru.[3,15–18,24–26,37]For the FM/NM/FM structure,the coupling strength and type of IEC are mainly related to the material compositions and the thickness value of FM layer and NM layer. However,the mechanism of IEC has not been completely understood so far, which still requires further studying. Very recently,an ultrahigh OM FMR was observed in the AFM coupled FM/NM/FM sandwich trilayers, where the antiferromagnetic IEC field,as a driving force,is responsible for the ultrahigh OM FMR frequency. Therefore, controlling the coupling type to obtain a strong AFM coupling is particularly important.Theoretically,McKinnonet al.[8]and Neel[38]systematically investigated the effect of the exchange coupling coefficientsJ1andJ2on the FMR frequency and intensity of thin films. In this study,FeCoB/Ru/FeCoB trilayers were prepared by a compositional gradient sputtering method. It was revealed that an ultrahigh FMR frequency over 20 GHz and an oscillation of IEC with Ru thickness were observed. The experimental results were simulated by the Layadi’s rigid model.The experimental and theoretical results were well consistent with each other.
Usually, two resonance modes, the acoustic mode (AM,the two FM layers precessing in-phase)and the optical mode(OM)(the two FM layers precessing out-of-phase),appear in the FM/NM/FM systems whether the coupling type is FM or AFM.[36]However,the definitions of resonance modes are often inconsistent for different FM material systems. For an FM coupling system, the determination of the resonance mode is relatively simple. The frequency of the OM is higher than that of the AM.But the frequency dispersion is very complex for an AFM coupling system. It is not suitable to determine AM or OM simply from the relative frequency. Therefore,it is very important to judge the mode of resonance peak by other means. With the development of modern testing technology,we found that by combining transverse(T)and longitudinal (L) ferromagnetic resonance (FMR) tests, the modes of resonance peaks can be identified intuitively and effectively. It is also a useful method to evaluate the exchange coupling strengths for both FM and AFM coupled systems.[37]In the conventional transverse pumping FMR (T-mode), the microwave field ˜his applied perpendicular to the external bias field (H) direction, which results in a strong coupling in the AM and a weak coupling in the OM [Fig. 1(b)]. The dynamic magnetization components parallel to ˜hfrom both FM layers are added to each other in the case of in-phase precession in the transverse configuration. This leads to a strong absorption of the AM resonance. While for the OM,the dynamic magnetizations parallel to ˜hcancel out due to the out-of-phase precession.[8]If the two ferromagnetic layers are exactly identical, the OM is perfectly canceled in the FMR spectra.[37]In comparison,the longitudinal pumping(Lmode)FMR,as reported by Zhang in 1994,is very sensitive to the OM resonance.[39]With longitudinal pumping, ˜his along the external bias field direction and can couple with the OM to produce a noticeable absorption at resonance, especially when the magnetizations of the two FM layers are antiparallel to each other, while the in-phase dynamic magnetizations are canceled out[Fig.1(c)].This leads to enlarged OM and reduced AM resonance peaks.[27–35]The resonance mode can be easily identified from the relative intensities of the resonance peaks.
2. Experiment
The FeCoB (25 nm)/Ru (tRu˚A)/FeCoB (25 nm) trilayers (defined as TL) were prepared by a composition gradient sputtering (CGS) through using RF magnetron sputtering at room temperature with a background vacuum better than 5×10⁻⁵Pa, using a (100) single crystal Si substrate with a dimension of 65 mm in length, 5 mm in width, and 0.5 mm in thickness. Several B-chips with 5 mm×5 mm wasplaced on the Fe70Co30target along the radial direction as shown in Fig.1(a). The Si substrate was pasted on the sample turntable with its length direction along the B arrangement direction.It should be mentioned here that the turntable does not rotate during the deposition of the FeCoB film. As a result,a B composition gradient with an increasing B composition from left to right will be formed along the length(R)direction[Fig.1(a).As for the preparation process of FeCoB/Ru/FeCoB trilayers,it can be described as follows. Firstly, a 25-nm-FeCoB film was deposited using the CGS method above with power of 60 W and Ar pressure of 0.5 Pa at an Ar flow rate of 60 sccm.Secondly,a uniform Ru spacer layer was deposited on the top of the 25-nm-FeCoB layer through using the turntable speed of 5-round per minute with the sputtering power of 45 W and pressure of 0.6 Pa at an Ar flow rate of 60 sccm. The Ru thickness was calculated using deposition time according to the Ru deposition rate. Finally, another 25-nm-FeCoB layer was deposited on the Ru layer under the same CGS conditions as that on the bottom FeCoB layer. As a control,a 50-nm FeCoB single layer (defined as SL) was prepared under the same CGS conditions. The SL and TL samples were cut into 13 segments each with length of 5 mm along the length direction,and were numbered sequentially according to sample positionsn=1–13(from left to right along the length direction).
The static magnetic properties of the samples were investigated using an alternating gradient magnetometer(AGM,MicroMagTM Model 2900). The dynamic properties were investigated by a vector network analyzer (VNA, Agilent N5224A) with a co-planar waveguide transmission line fixture. The profiles of T- and L-mode FMR are schematically shown in Figs. 1(b) and 1(c). The in-plane magnetic field and angle dependence of FMR frequency and intensity for each film were measured using VNA-FMR.The magnetic field dependence was investigated along the EA direction,and the angle dependence was studied using the start angle from the width direction of the sample (i.e., the 0◦of the angleθcorresponds to the direction perpendicular to the length direction). The compositions of the samples were detected by a field-emission electron probe microanalyzer(FE-EPMA,JOEL JXA-8530F).

Fig. 1. Schematic diagram of (a) component gradient sputtering (CGS)method,and the profiles of(b)T-and(c)L-mode FMR measurements along EA direction.
3. Results and discussion
Figure 2 shows the plots of composition versus sample position of the single layer for Fe, Co, and B elements. As illustrated,a linear distribution of compositions is obtained by this CGS method. The Fe/Co atomic ratio is 2.12,corresponding to an Fe:Co atomic deposition ratio of 1:1.1. In contrast,a linearly increasing B compositionCBwith an increment ratio of 0.479 is achieved. According to the theory of ferromagnetism,magnetostriction energy is expressed as
whereλSis the saturation magnetostriction coefficient andσis the stress. Positive sign and negative sign of stress are taken for tensile stress and compressive stress, respectively,andθis the angle between stress and magnetization. Based on Eq.(1),for a film with a positiveλS,the compressive stress results in the arrangement of magnetic moments perpendicular to the compressive stress direction. If the intrinsic stress orientation is arranged along one direction, a uniaxial magnetic anisotropy will be formed. For the investigated films, a uniaxial stress along theR-direction is induced by the B-gradient along theR-direction. Owing to the FeCoB film with a positiveλSand compressive stress direction along theR-direction,the magnetic moment is preferentially arranged perpendicular toR-direction. Like previous researches,[40–42]the B-gradient induced uniaxial magnetic anisotropy (UMA) with easy axis perpendicular to theR-direction will result in a self-biased high-frequency FMR.
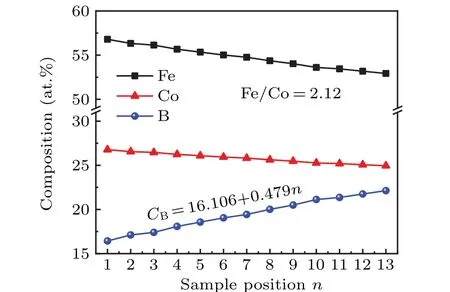
Fig.2. Distributions of Fe,Co,and B elements in a single layer.
3.1. Static magnetic properties
Figures 3(a)–3(h) show the hysteresis loops of the Fe-CoB/Ru/FeCoB trilayers with various values of Ru thickness along the EA direction and the hard axis (HA) direction. As illustrated, the FeCoB single layer (tRu=0 ˚A) has obvious uniaxial magnetic anisotropy[Fig.3(a)]. For the trilayer withtRu=1 ˚A,the hysteresis loops(not shown here)are very similar to those for the single layer, which can be attributed to the discontinuous Ru spacer, where the ferromagnetic layers are still interconnected. For the samples with the Ru thickness greater than 2 ˚A(2 ˚A≤tRu≤8 ˚A),the remanence along the HA is larger than that along EA, showing an AFM-like coupling with an obtuse angle (>90◦) between the magnetic moments in the upper FM layer and the lower FM layer. The sample withtRu=8 ˚A is a representative AFM coupled sample. The magnetic moments of the two FM layers are antiparallel at low fields, resulting in a small remanence along the EA. When the applied magnetic field increases to 21 Oe(1 Oe=79.5775 A·m−1), a spin flip occurs due to antiferromagnetic coupling and uniaxial magnetic anisotropy. When the Ru thickness further increases in a range of 9 ˚A≤tRu≤14.5 ˚A, the remanence along the EA is larger than that along the HA, implying that the moment angle is changed from obtuse angle into acute angle, and an FM coupling appears.When the Ru thickness reachestRu=16 ˚A,the interlayer coupling type reverts to an AFM-like coupling again. The static magnetic properties reveal that an oscillation of the interlayer coupling type takes place in the FeCoB/Ru/FeCoB trilayers with the variation of Ru thickness.

Fig. 3. Hysteresis loops along EA directiion and HA direction for Fe-CoB/Ru/FeCoB trilayers with various values of thickness Ru.
3.2. Dynamic magnetic properties
From the static magnetic properties above,it can be concluded that the interlayer coupling oscillation with the Ru thickness is present,and the Ru thickness intervals of 0–2,2–8, 9–14.5, above 16 ˚A correspond to FM, AFM, FM, AFM couplings, respectively. For simplicity, we choose some representative thickness values for each interval to discuss.
3.2.1. tttRRRuuu===111˚A˚A˚A, FM coupling

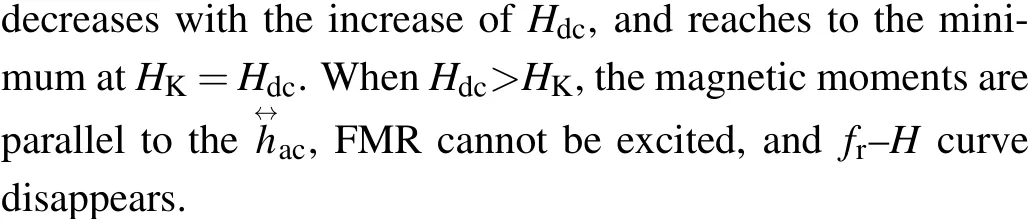
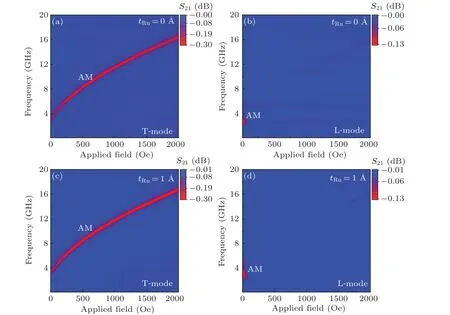
Fig. 4. Applied field-dependent FMR frequency (fr–H) curves along EA for 50-nm-FeCoB single layer in (a) T-mode and (b) L-mode, and FeCoB/Ru/FeCoB(tRu=1 ˚A)trilayer in(c)T-mode and(d)L-mode.
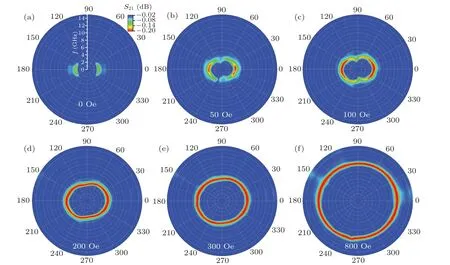
Fig.5. Angle dependent FMR frequency(fr-curve)at T-mode for tRu=1-˚A trilayer in various magnetic fields.
The in-plane distribution of FMR frequency and intensity are characterized by an in-plane angle rotation method (fr–θcurve). Figure 5 shows thefr–θcurves oftRu=1-˚A trilayer measured at T-mode at various applied magnetic fields. Since the Ru spacer is discontinuous and FM coupling between the two ferromagnetic layers is present,the polar FMR spectra is very similar to that of the single layer. At zero applied field,thefr–θcurve looks like a pair of “parentheses”, indicating a good uniaxial magnetic anisotropy in the sample. With the applied magnetic field increasing from 50 Oe to 100 Oe,the intensity and frequency of the resonance along the EA increase,but the intensity of the resonance along the EA is enhanced with the increase of applied field, and an “8”-shapedfr–θcurves are observed in Figs.5(b)and 5(c). As the applied field further increases[Figs.5(d)and 5(f)],the magnetic moments will rotate following the applied field, leading to a superposition between the UMA field (HK) and external fields. As a result,an ellipticfr–θcurve is observed.

Fig.6. The fr–H curves of FeCoB/Ru/FeCoB(tRu=5 ˚A)trilayer along EA at(a)T-mode and(b)L-mode.

Fig.7. The in-plane angle-dependent FMR frequency and intensity at T-mode for the tRu=5-˚A trilayer in various magnetic fields.
3.2.2. 222˚A˚A˚A≤≤≤tttRRRuuu≤≤≤888˚A˚A˚A, AFM coupling
Thefr–Hcurve at T-mode for thetRu=5-˚A trilayer(the representative sample),shown in Fig.6,reveals that there is an OM resonance peak at about 12 GHz in zero field[Fig.6(a)].The OM resonance can also be verified by the L-mode measurement, which is sensitive to the OM resonance, and only one OM peak is observed [Fig. 6(b)]. Comparing Fig. 6(a)with Fig.6(b),the resonance peak at higher frequency can be assigned to the OM resonance, indicating an AFM interlayer coupling in thetRu=5-˚A trilayer. As the field increases, the OM resonance frequency increases slightly,but when the field reaches a critical field around 197 Oe[Fig.6(a)],the resonance mode suddenly switches from OM to AM,i.e., the interlayer coupling switches from AFM to FM. Further increasing the magnetic field,only AM resonance is observed infr–Hcurve.
Figure 7 shows the in-plane angle-dependent FMR frequency and intensity for thetRu=5-˚A trilayer in various magnetic fields.In zero field,only one OM resonance withθ=50◦can be observed. In a field range of 50 Oe≤H ≤150 Oe,the AM resonance appears in the direction of the intensity maximum perpendicular to that of the OM resonance. Moreover,the intensity and frequency of the AM resonance increase with the applied magnetic field increasing, while the intensity of OM resonance decreases gradually till disappearing. The fact is consistent with the result in Fig.6(a),where the critical field of OM resonance disappearing is about 200 Oe. When the applied field further increases,thefr–θcurve,which is close to the fourfold symmetry, indicates that the magnetic moments in the upper and lower FM layer are both 90◦, but because of the existence of UMA fieldHK, it deviates from complete symmetry.
3.2.3. 999˚A˚A˚A≤≤≤tttRRRuuu≤≤≤111444...555˚A˚A˚A, FM coupling
When the Ru thickness is in a range of 9 ˚A≤tRu≤14.5 ˚A,the interlayer coupling reverts from AFM to FM again. Taking thetRu=10-˚A trilayer as a representative sample,thefr–Hcurve shown in Fig.8(a),reveals that there are two resonance modes observed at T-mode measurement. Comparing with the L-mode result [Fig. 8(b)], the resonance mode at higher frequency and lower frequency can be assigned as AM and OM modes, respectively. The intensity of AM resonance is far stronger than that of OM resonance, indicating that the FM interlayer coupling is dominated.
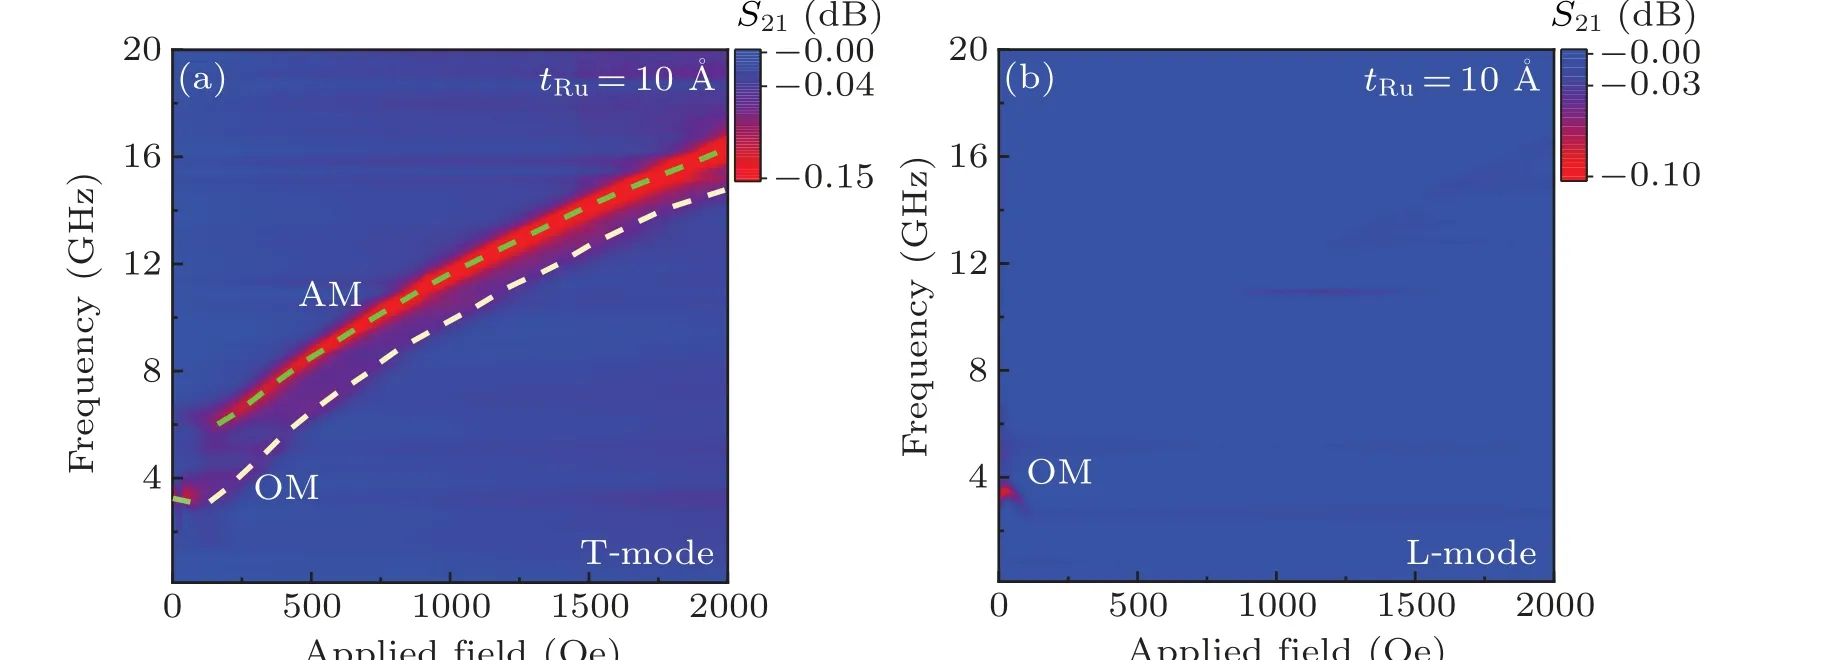
Fig.8. fr–H curves along EA direction for tRu=10-˚A trilayer at T-mode(a)and L-mode(b).
Figure 9 shows the in-plane angle dependent FMR frequency and intensity at T-mode fortRu=10-˚A trilayer in various magnetic fields.As illustrated,the two resonances overlap and only the AM resonance can be observed in the orthogonal directions[as indicated by the arrows in Fig.9(c)]. As the applied field increases,the frequency and intensity of the AM resonance increase. However, the intensity of the OM resonance (along 0◦/180◦and 90◦/270◦) remains very weak, and gradually combines together with the AM resonance with the increase of magnetic fields[see Figs.9(d)–9(f)].
In addition,when the Ru thickness is 16 ˚A,the interlayer coupling type reverts to the AFM coupling again, which will not be described here. The overall variations of FMR frequency and resonance modes with the Ru thickness for the trilayers along the EA direction are summarized in Fig. 10.As illustrated,when the Ru thickness is thinner than 2 ˚A,theS21–fcurve of the trilayer is almost the same as that of the single layer [Fig. 10(a)], single layer andtRu=1 ˚A). As the Ru thickness increases, two resonance peaks appear in theS21–fcurve. It is exciting that an ultrahigh OM FMR frequency of 20.02 GHz is present in thetRu=2.5 ˚A trilayer with the AFM coupling. The fact indicates that the AFM interlayer coupling is an effective way to obtain an ultrahigh FMR frequency. In addition,a pure OM ferromagnetic resonance with a frequency of 19.42 GHz is also obtained attRu=3 ˚A. For the trilayers with Ru thickness in the range of 2 ˚A≤tRu≤8 ˚A,the antiferromagnetic interlayer coupling exists with the OM frequency higher than the AM one. However, in the range of 9 ˚A≤tRu≤14.5 ˚A,the ferromagnetic interlayer coupling appears with the AM frequency becoming higher than OM frequency. WhentRu=16 ˚A,the interlayer coupling type reverts to the AFM again. The oscillation of interlayer coupling is summarized in Fig.10(b).
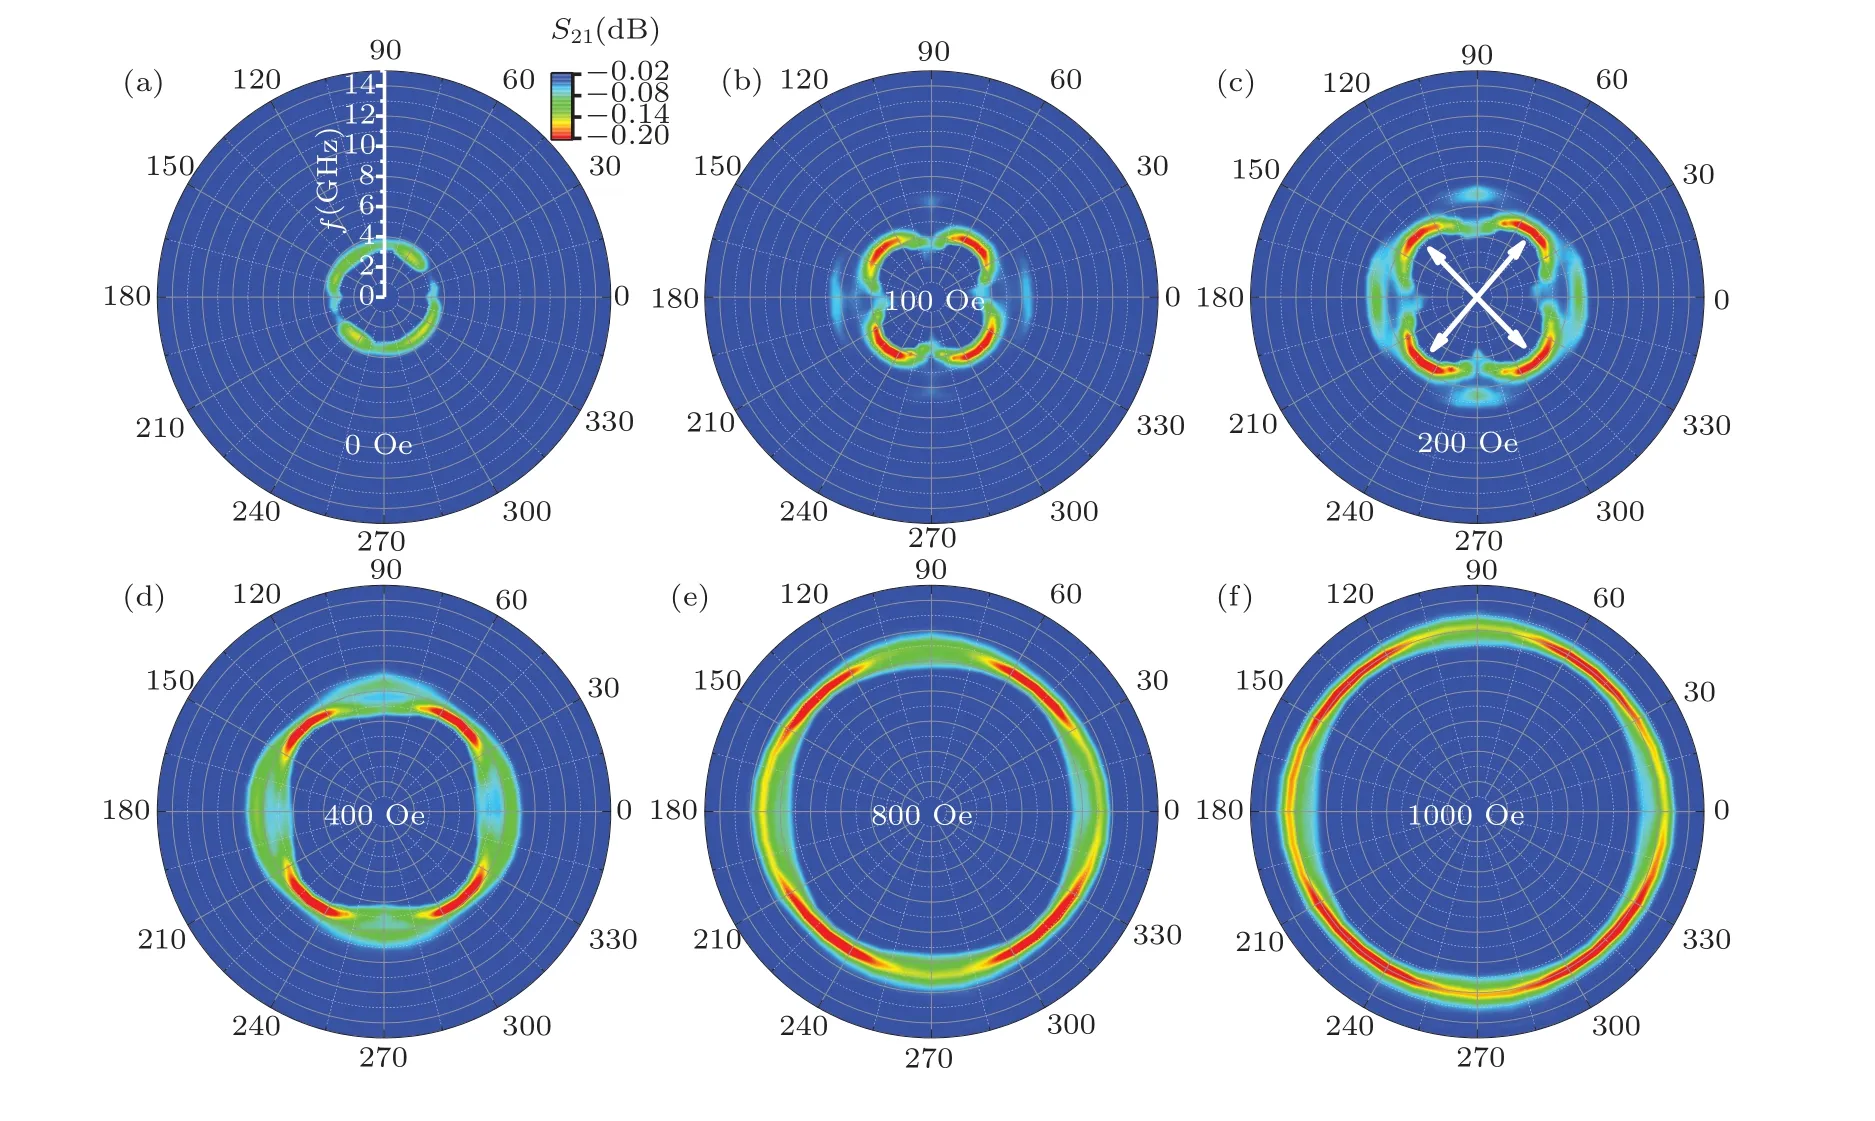
Fig.9. In-plane angle dependence of FMR frequency and intensity at T-mode for tRu=10-˚A trilayer in various magnetic fields.

Fig. 10. (a) Curves of scattering parameter S21 versus frequency (S21–f) along EA direction for FeCoB/Ru(tRu)/FeCoB trilayers, and (b) Ruthickness-dependent AM and OM frequencies in zero magnetic field.
3.3. Analysis of interlayer exchange coupling coefficients
The effect of interlayer coupling on FMR properties has been extensively investigated.[39,43–46]Like the spin–exchange interaction of electrons, the interlayer exchange coupling energy between the trilayers of the film can be expressed as[22]
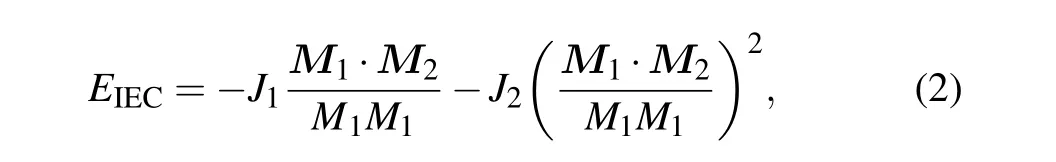
whereM1andM2are the magnetization vectors of the two ferromagnetic layers respectively,J1is the bilinear coupling coefficient, andJ2is the biquadratic coupling coefficient. IfJ1plays a dominant role, whenJ1> 0, the magnetic moments are aligned parallel to minimize the free energy, thus the ferromagnetic coupling occurs;whenJ1<0,the magnetic moments are antiparallel, and antiferromagnetic coupling is present. WhenJ2plays a dominant role andJ2< 0, when the magnetic moments are orthogonal,the free energy is minimized.
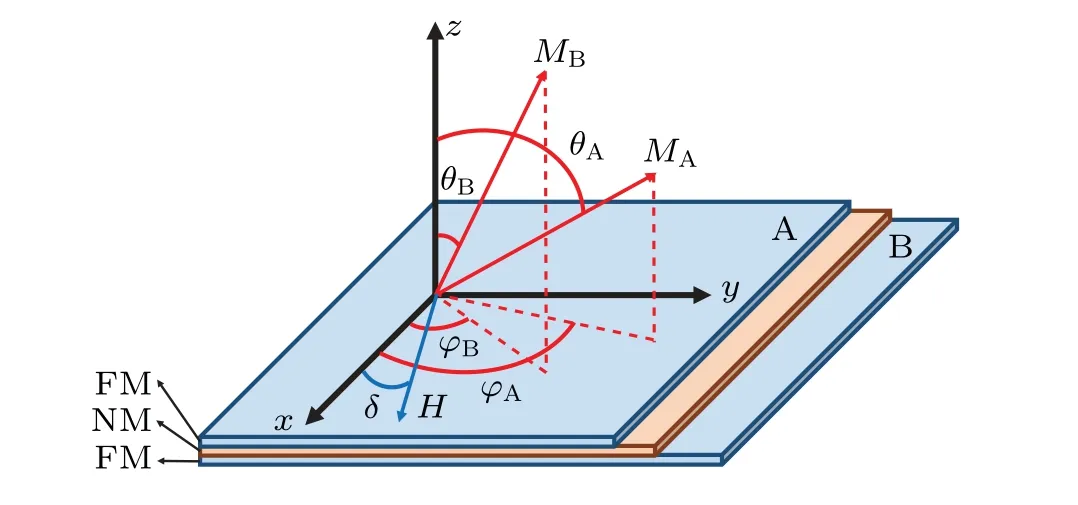
Fig.11. Schematic diagram of FMR coordinates of FM/NM/FM trilayer.
A schematic diagram of the FMR coordinates of the FM/NM/FM trilayers is shown in Fig.11. Supposing that the thickness of ferromagnetic layer A istA, the anisotropic field along thexdirection isHA, the magnetization isMA, and the direction can be uniquely determined byθAandϕA,and so is the case for ferromagnetic layer B.Since the thickness of the non-magnetic layer is less than the critical coupling thickness,there is interlayer coupling between the two ferromagnetic layers A and B.
Now,a case is considered here that only the applied magnetic field within the film surface is considered and the angle between the magnetic field direction and thexaxis is set to beδ, and the direction of the microwave field h is along theyaxis. For this trilayer film structure,in addition to the interlayer exchange coupling energy, the respective energy of the two ferromagnetic layers should also be considered,so the free energy per unit area of the structure can be expressed as

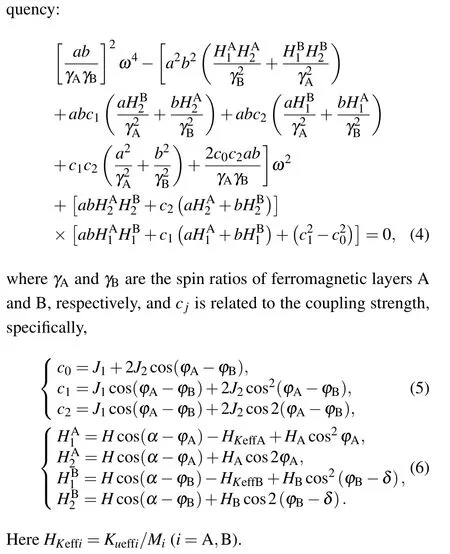
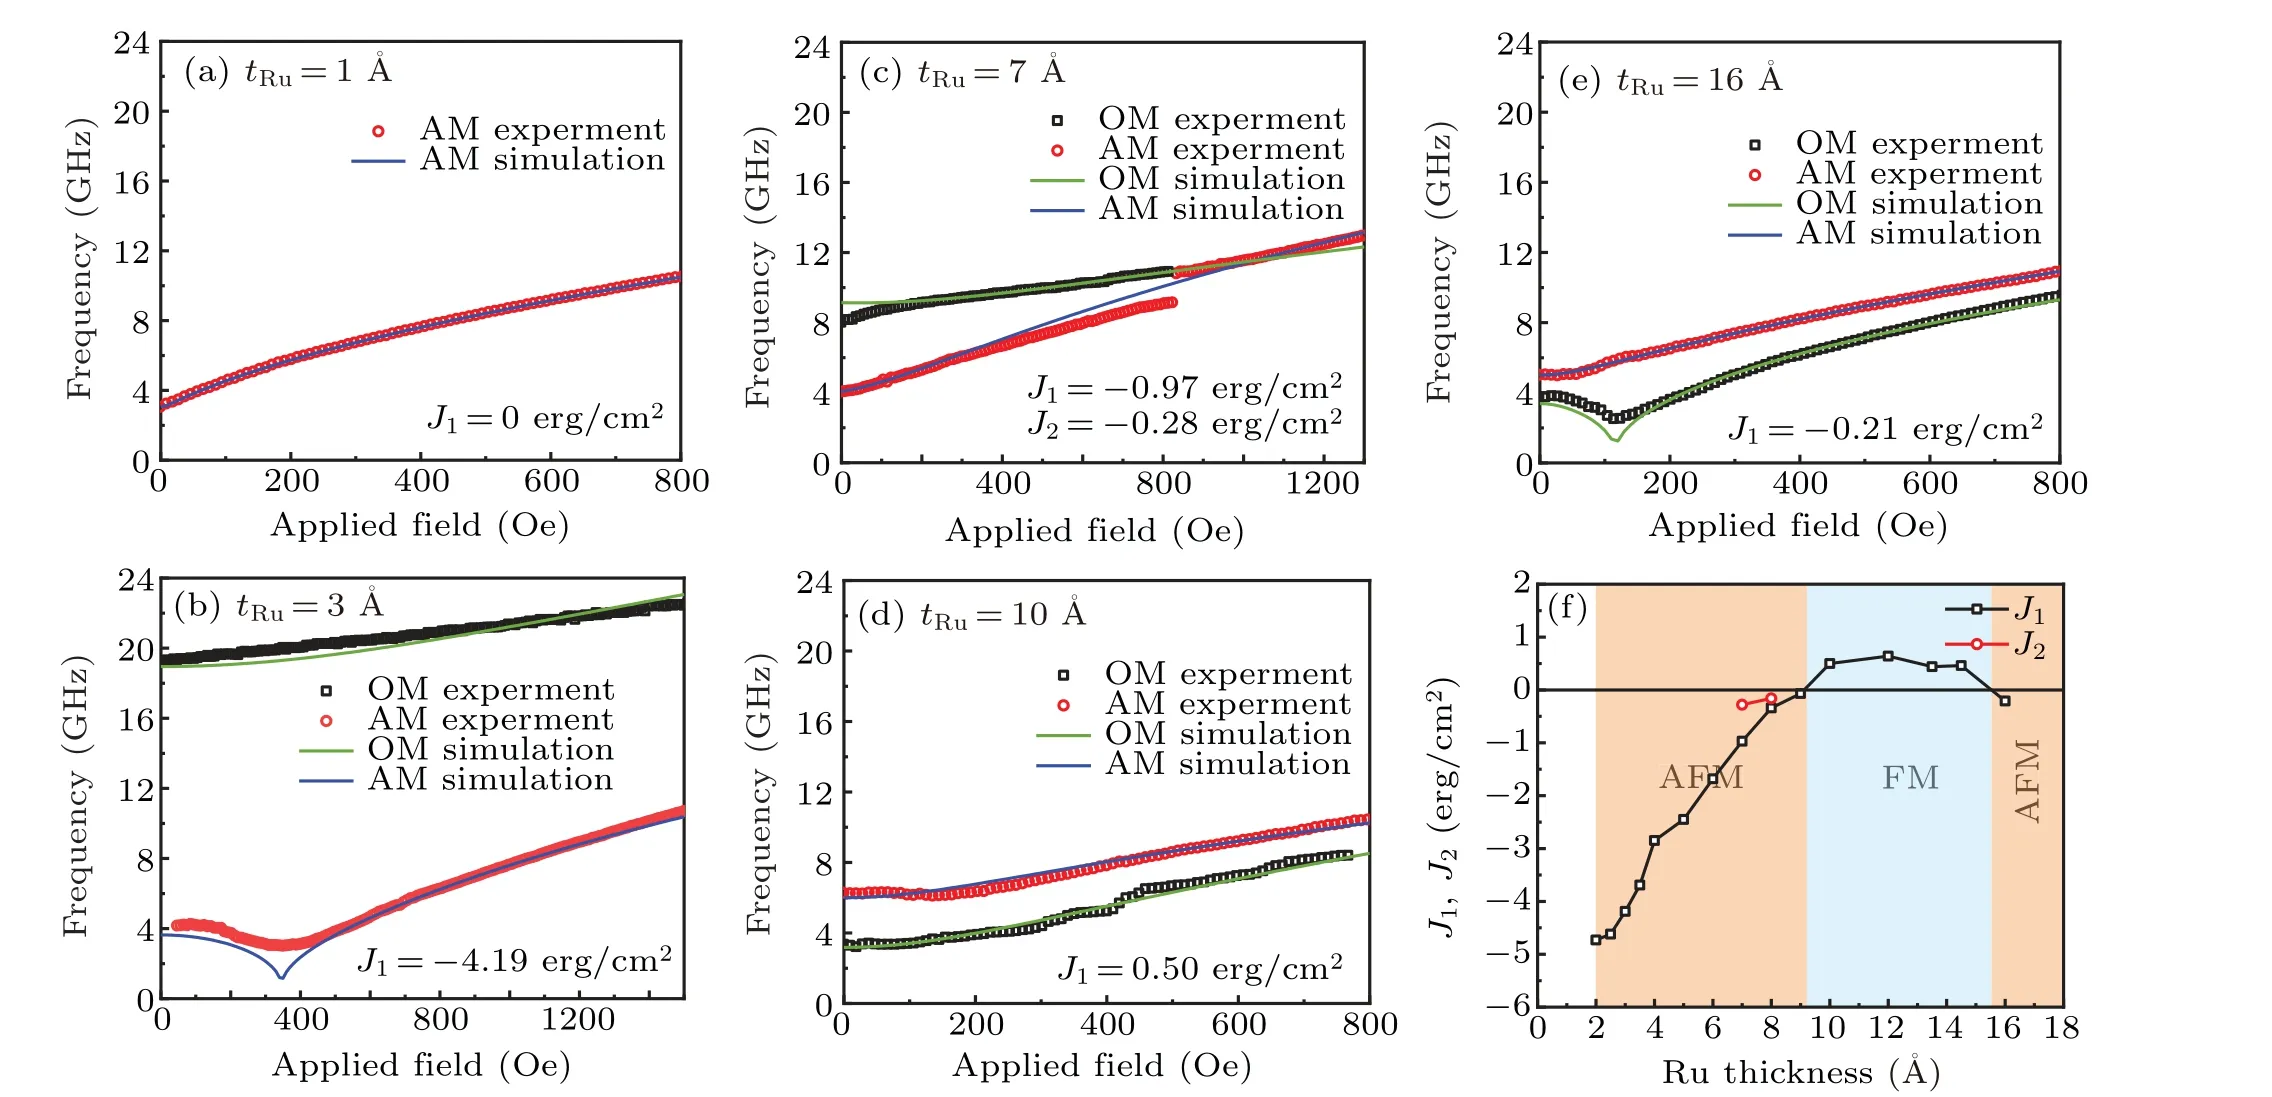
Fig. 12. (a)–(e) Comparison between the simulation results and experimental results for trilayers, and (f) coupling coefficients J1 and J2 oscillating with variation of Ru thickness in middle layer. The unit 1 erg=10−7 J.
The parameters of the film are substituted into the equation, and by setting different coupling coefficientsJ1andJ2,the calculated results are compared with the experimental ones so that the optimized coefficients are obtained. Figures 12(a)–12(e) show the comparisons between the theoretical simulation and the experimental results. The simulated coupling coefficientsJ1andJ2are summarized in Fig. 12(f). It is interesting to note that the simulation results are well consistent with the experimental ones. AttRu≤1 ˚A, the FM interlayer coupling occurs. In the range of 2 ˚A≤tRu≤8 ˚A,J1<0 is dominant, and AFM coupling appears. In the range of 9 ˚A≤tRu≤14.5 ˚A,J1>0 and the coupling type changes into the FM coupling. When the Ru thickness increases to 16 ˚A,the coupling type reverts to the AFM coupling again. In addition,the bilinear and biquadratic coupling(J1andJ2)are present simultaneously for the trilayers withtRu=6 ˚A–8 ˚A in the transition region from AFM to FM coupling[Fig.12(f)].
4. Conclusions
The FeCoB/Ru/FeCoB trilayers with various values of Ru thickness are prepared by a composition gradient sputtering method to realize the interlayer coupling and investigate its effect on the FMR performances. Interestingly, it is observed that the interlayer coupling oscillates with two periods from FM to AFM by varying Ru thickness. The Ru thickness dependence of two oscillation periods can be divided into four segments: 0–2, 2–8, 9–14.5, and above 16 ˚A, corresponding to FM,AFM,FM,and AFM couplings,respectively. In addition, in the first AFM coupling region oftRu=2 ˚A–8 ˚A, the OM resonance frequency is far higher than the AM one. In the trilayer withtRu=2.5 ˚A,an ultrahigh OM frequency over 20 GHz is achieved. This means that the AFM interlayer coupling is an effective way to enhance the FMR frequency. This study provides a way to control the interlayer coupling type and intensity, and therefore obtaining the excellent ultrahigh FMR performances.
Acknowledgements
Project supported by the National Natural Science Foundation of China(Grant Nos.51871127 and 11674187).
猜你喜欢
金桥(2022年6期)2022-06-20
金桥(2022年4期)2022-05-05
金桥(2022年4期)2022-05-05
走向世界(2022年3期)2022-04-19
走向世界(2022年3期)2022-04-19
金桥(2022年3期)2022-03-29
金桥(2022年3期)2022-03-29
中学生数理化·八年级物理人教版(2021年5期)2021-11-22
金桥(2021年6期)2021-07-23
能源(2020年10期)2020-11-13
- Chinese Physics B的其它文章
- Direct measurement of two-qubit phononic entangled states via optomechanical interactions
- Inertial focusing and rotating characteristics of elliptical and rectangular particle pairs in channel flow
- Achieving ultracold Bose–Fermi mixture of 87Rb and 40K with dual dark magnetic-optical-trap
- New experimental measurement of natSe(n,γ)cross section between 1 eV to 1 keV at the CSNS Back-n facility
- Oscillation properties of matter–wave bright solitons in harmonic potentials
- Synchronously scrambled diffuse image encryption method based on a new cosine chaotic map