
Highly expression of MYBL2 is correlated with a poor prognosis and immune infiltration in clear cell renal carcinoma
2022-11-03 06:35YuXinChenJunPanHongQianGuoWeiDongGan
Medical Data Mining 2022年4期
Yu-Xin Chen ,Jun Pan ,Hong-Qian Guo,2 ,Wei-Dong Gan,2*
1Nanjing Drum Tower Hospital,The Affiliated Hospital of Nanjing University Medical School,Nanjing 210008,China.2Department of Urology,Drum Tower Hospital,Medical School of Nanjing University,Institute of Urology,Nanjing University,Nanjing,China.
Abstract Background: Clear cell renal carcinoma (ccRCC) is notorious for its highly unfavorable prognosis,closely related to immune cell infiltration (ICI).MYB Proto-Oncogene Like 2(MYBL2) is elevated in multiple types of human cancer and is recognized as a crucial role in tumorigenesis.In the present study,we aimed to determine the roles of MYBL2 in the prognostic outcomes of ccRCC.Methods:We analyzed the GSE100666 dataset from the Gene Expression Omnibus (GEO) database and found that the expression of MYBL2 was significantly higher in ccRCC subjects than in normal controls.Next,RNA sequencing data related to ccRCC were retrieved from The Cancer Genome Atlas (TCGA) database and the levels of MYBL2 were compared between tumor and peri-tumor tissues.The correlation between MYBL2 and clinicopathological parameters was assessed by logistic analysis.The Kaplan-Meier method,Cox-regression analysis,and nomograms,were applied to investigate the potential clinical benefits of MYBL2 in ccRCC.We also evaluated the correlation between MYBL2 and immune cell infiltration with a single-sample gene set enrichment analysis (ssGSEA).The association between MYBL2 and immune checkpoints was determined via the TIMER and TISIDB databases.Finally,correlation analysis was conducted to predict upstream non-coding RNAs (ncRNAs) regulating MYBL2,and a completing endogenous RNA (ceRNA) network was constructed to visualize the long non-coding RNAs (lncRNAs)-microRNAs (miRNAs)-MYBL2 axis in ccRCC.Finally,further analysis of upstream lncRNAs was carried out to validate the accuracy of the network.Results:MYBL2 was significantly over-expressed in ccRCC (P <0.001).High levels of MYBL2 expression in ccRCC correlated with a worse T stage,a more advanced N stage,a higher M stage,a more deleterious pathological stage,and higher histological grades.MYBL2 was identified as a risk factor for disease-specific survival (hazard ratio (HR)=2.73, P <0.001),overall survival (HR=1.91, P <0.001),and progression-free interval(HR=2.03, P <0.001).MYBL2 also positively associated with multiple types of immune cells and checkpoints.Finally,two ceRNA axes,PVT1-miR-30e-5p-MYBL2 and LINC00511-miR-29c-3p-MYBL2 were detected as the most promising upstream ncRNAs regulating MYBL2 in ccRCC,and we also validated the expression of MYBL2 and PVT1 by launching qRT-PCR.We found that the expression of MYBL2 was significantly higher in 786-O than in human kidney-2 cell line HK-2 (P <0.001) and the expression of PVT1 was significantly higher in Caki-1 than in HK-2 (P <0.001).Conclusion:Our study revealed that ncRNAs might upregulated the expression of MYBL2 in ccRCC and that this was associated with an unfavorable prognosis and immune infiltration.
Keywords: MYB Proto-Oncogene Like 2;clear cell renal carcinoma;completing endogenous RNA;immune infiltration
Introduction
Globally,renal cell carcinoma (RCC) is a frequent and lethal malignant tumor that features three major subtypes: chromophobe RCC,papillary RCC,and ccRCC,and besides there are also some other rare subtypes [1].Identified as the most frequent histological subtype of RCC,ccRCC accounts for almost 70% of all cases of RCC [2].Since an association between the tumorigenesis of renal cells and the inhibition of the immune system has been recognized,immunotherapy may potentially impair tumor growth in ccRCC [3].It has been reported that immune cells,including neutrophils,monocyte,macrophages,dendritic cells,natural killer (NK) cells,and T cells can influence the innate immune response of ccRCC,thus contributing to the expansion or suppression of tumor growth [4-8].Moreover,a number of immune checkpoints,including programmed cell death 1 and cytotoxic T-lymphocyte-associated protein 4 (CTLA-4),have been shown to be associated with ccRCC,thus providing another potential option for immunotherapy [9].Therefore,there is an urgent need to investigate potential immune checkpoints and immune infiltration in ccRCC.
There are three gene members of the MYB Proto-Oncogene family in humans: MYB,MYBL1,and MYBL2 [10].As a significant component of the DREAM complex,MYBL2 has been shown to participate in the modulation of the cell cycle,apoptosis,and cell differentiation[11-14].Numerous researchers have demonstrated a correlation between MYBL2 and multiple forms of human cancer,particularly prostate cancer,colorectal cancer,breast cancer,and hepatocellular carcinoma [15-18].Further evidence showed that MYBL2 contributed to ICI in human cancer [19].Statistical analysis also revealed that MYBL2 was associated with T cells,NK cells,B cells,and other types of immune cells and led to tumorigenesis [20].However,the expression,prognosis,immune infiltration,and relevant mechanisms underlying the role of MYBL2 in ccRCC remain largely unknown.
In the present study,we investigated the specific expression of MYBL2 in ccRCC.We also used multiple dimensional analysis,based on various databases,to perform clinicopathological analysis and correlation analysis of the immune infiltration of MYBL2 in ccRCC.Finally,to identify the upstream mechanisms of MYBL2 in ccRCC that were mediated by ncRNAs,we generated a ceRNA network to provide a theoretical basis for further investigation.Collectively,our findings suggest that ncRNAs upregulate the expression of MYBL2,thus contributing to an unfavorable prognosis and immune infiltration in ccRCC patients.
Materials and methods
Ethics statement and data processing
High-throughput RNA-seq data(transcripts per kilobase of exon model per million mapped reads format) and clinicopathological data from the Kidney Renal Clear Cell Carcinoma Project were retrieved from the TCGA (www.tcga-data.nci.nih.gov/tcga/) database [21].In addition,RNA-seq data relating to MYBL2 were retrieved from the GEO (www.ncbi.nlm.nih.gov/geo) database to detect the expression of MYBL2 at the transcriptional level (GSE100666).
Differentially expressed genes(DEGs) in ccRCC
To detect DEGs in ccRCC,we built a volcano plot and a heatmap based on the GSE100666 dataset which was sequenced on GPL6538,and set thresholds with log-fold changes >1.5 and adjustedP-values <0.05.In addition,to investigate the expression of MYBL2 at the protein level,we obtained immunochemical images from the Human Protein Atlas (www.proteinatlas.org) database [22].
MYBL2 expression and the clinicopathological parameters of ccRCC patients
A range of data was collected from TCGA relating to patients with ccRCC;these patients were then divided into low-and high-MYBL2 expression subgroups.Next,we compared these two groups with regard to their relative clinicopathological characteristics by using the Pearson’s chi-square test for rank datasets and Wilcoxon rank test for continuous datasets.Logistic analysis was also performed to demonstrate the relationship between clinicopathological parameters and the expression of MYBL2.
The clinical importance of MYBL2 expression in patients with ccRCC
The predictive values of MYBL2 for ccRCC diagnosis were evaluated by receiver operating characteristic analysis.We carried out survival analysis of ccRCC to compare the differences in MYBL2 expression between ccRCC tissue and pericarcinoma tissue.After gaining access to information relating to the clinical outcomes of patients from the TCGA database,we evaluated progression-free interval (PFI),overall survival (OS),and disease-specific survival (DSS),by employing univariate and multivariate Cox-regression analysis as well as Kaplan-Meier analysis [23].In addition,we integrated all factors that remained independent predictors in the Cox models to establish a nomogram for OS,DSS,and PFI.Calibration curves were also built to validate the accuracy of the nomogram.
MYBL2 expression and ICI in ccRCC
To investigate the interaction between MYBL2 and ICI in ccRCC,we created a lollipop diagram to demonstrate the extent of infiltration of 24 types of immune cells,including B cells,CD8+T cells,cytotoxic cells,dendritic cells (DCs),activated DCs,immature DCs,plasmacytoid DCs,eosinophils,mast cells,macrophages,NK cells,NK CD56+cells,NK CD56-cells,neutrophils,T cells,T helper cells,Th1 cells,Th2 cells,Th17 cells,regulatory T cells,T effector memory cells,T central memory cells,T follicular helper cells,and T gamma delta cells [24].The correlations between MYBL2 expression and ICI were investigated by Spearman’s test,and the extent of ICI was compared between low-and high-MYBL2 expression subgroups by Wilcoxon’s rank sum test.
TIMER analysis
TIMER (timer.cistrome.org/) is an online platform that can be used to comprehensively analyze ICI cells and immune checkpoints related to human cancer [25].Analysis of the TIMER database uses gene expression profiles from the TCGA database.First,we evaluated the expression levels of MYBL2 in 33 types of human cancer to explore the statistical significance of pan-cancer transcriptional levels of MYBL2.Next,to explore the correlation between MYBL2 expression and immune checkpoints in ccRCC,we performed correlation analysis based on Spearman’s test.
TISIDB analysis
The TISIDB database (cis.Hku.hk/TISIDB/) is an online platform that can be used to analyze tumors,ICI,and immune checkpoints.We used the TISIDB to analyze the interaction between MYBL2 expression and lymphocytes involved in tumor immune infiltration.Pan-cancer correlation analysis was performed between MYBL2 and immune checkpoints and a heat map was downloaded from the TISIDB database.In addition,to validate the correlation analysis derived from the TIMER database,the association between MYBL2 and immune checkpoints in ccRCC was detected via the TISIDB database.
The prediction of candidate MYBL2 target miRNAs in ccRCC
Upstream miRNAs binding to MYBL2 were predicted by the analysis of different target miRNA prediction databases,including PITA (http://genie.weizmann.ac.il/pubs/mir07/mir07_data.html),miRanda (http://www.miranda.org/),and TargetScan (http://www.targetscan.org/).We selected candidate MYBL2 target miRNAs based on the fact that only the most commonly detected miRNAs in PITA,miRanda,and TargetScan were integrated for further analysis.Next,the starbase (http://starbase.sysu.edu.cn/) database was used to screen predicted MYBL2 target miRNAs that exhibited a significant negative correlation with MYBL2 [26].
The prediction of upstream incRNAs and construction of a ceRNA network
Using the ceRNA hypothesis that lncRNAs correlate negatively with target miRNAs and correlate positively with target mRNAs,we evaluated candidate upstream lncRNAs that showed a significant negative association with candidate MYBL2 target miRNAs by using the starbase database.We also generated Sankey diagrams to construct a ceRNA network.To validate the clinicopathological benefits of candidate MYBL2 target lncRNAs,we performed expression,survival,and correlation analysis.
Cell lines and cell culture reagents
Human RCC cell lines (786-O,and Caki-1) and HK-2 were obtained from and authenticated by Cell Resource Center in China.These cells were maintained in Dulbecco’s modified Eagle’s medium/F12(HyClone,Inc.,USA) supplemented with 10% fetal bovine serum(Gibco BRL,Grand Island,NY,USA) and 1% antibiotics(penicillin-streptomycin,Gibco,USA).
RNA extraction and qRT-PCR
Total RNA was isolated from cells using Trizol reagent (Invitrogen,Carlsbad,CA,USA).Use Prime Script RT reagent kit (Takara,Dalian,China) for reverse transcrip-tion,and then use SYBR Prime Script RT PCR kit (Takara,Dalian,China) for qRT-PCR.Use 18s rRNA as an internal reference and use the 2-△△Ct method to calculate the results.MYBL2 primer sequences: forward primer CCGGAGCAGAGGGATAGCA and reverse primer CAGTGCGGTTAGGGAAGTGG.PVT1 primer sequences: forward primer GCCCCTTCTATGGGAATCACTA and reverse primer GGGGCAGAGATGAAATCGTAAT.18s rRNA primer sequences:forward primer CAGCCACCCGAGATTGAGCA and reverse primer TAGTAGCGACGGGCGGTGTG.
Statistical analysis
Statistical tests were conducted with R 3.6.3 software.GPL6538 divided patients from the GSE100666 dataset into a normal group and a tumor group,and then used this information to compare DEGs between the two groups;this analysis was performed with the R package “DESeq2” [27].The R packages “pheatmap” and “ggplot2”were then used to visualize DEGs based on the GSE100666 database as a heatmap and a volcano plot.Next,we compared MYBL2 and the expression of upstream lncRNAs between tumor tissues and peri-tumor tissues using unpaired t-tests for unpaired samples and paired t-tests for paired samples;results were then visualized by the R package “ggplot2”.Kaplan-Meier analysis was constructed by the R package “survminer”; then,univariate and multivariate Cox-regression analyses were performed by the R package “survival”.The “rms” package in R was utilized to build calibration curves and nomograms.The correlation between MYBL2 expression and ICI was assessed by the R package “GSVA” [28].Correlation analysis between upstream lncRNAs and MYBL2 was performed by Pearson’s analysis and visualized by the R package “ggplot2”.The results of qRT-PCR were visualized by the R package“ggplot2”.Finally,a Sankey diagram for the ceRNA network was established by the R package “ggalluvial”.P<0.05 was recognized as statistically significant.
Results
Pan-cancer analysis of MYBL2 mRNA expression in different databases
To evaluate the potential ability of MYBL2 to mediate tumorigenesis,we used the TIMER database to determine expression levels in various cancer types.This analysis showed that breast invasive carcinoma (P< 0.001),bladder urothelial carcinoma (P< 0.001),colon adenocarcinoma (P<0.001),cholangiocarcinoma (P<0.001),head and neck squamous cell carcinoma (P< 0.001),esophageal carcinoma (P<0.001),kidney renal papillary cell (P<0.001),kidney renal clear cell carcinoma (P<0.001),kidney chromophobe(P< 0.001),lung squamous cell carcinoma (P< 0.001),lung adenocarcinoma (P<0.001),liver hepatocellular carcinoma (P<0.001),rectumadenocarcinoma(P<0.001),prostate adenocarcinoma (P <0.001),uterine corpus endometrial carcinoma(P< 0.001),thyroid carcinoma (P< 0.001),and stomach adenocarcinoma (P<0.001) were associated with higher levels of MYBL2 expression when compared with normal tissue (Figure 1C).To compare the differences in MYBL2 expression between ccRCC and normal tissues,we used the GSE100666 dataset to detect the expression levels of MYBL2 in ccRCC (Figure 1A,B).Using the TCGA database,paired or unpaired datasets demonstrated that the expression of MYBL2 in ccRCC tissue was remarkably (P<0.001)upregulated compared to normal tissue (Figures 1D,E).To prove the accuracy of our data analysis,we collected IHC results from the Human Protein Atlas database.We found that the protein levels of MYBL2 in ccRCC tissue were increased compared with normal tissue(Figure 1F).
Association between MYBL2 expression and the clinicopathological features of ccRCC
The association between clinicopathological parameters of ccRCC patients with low-and high-MYBL2 expression levels are presented in Table 1.Patients in the high-MYBL2 group were considered to have worse pathological stages,higher histological grades,and more advanced clinical T,N and M stages compared to those in the low-MYBL2 group.No significant differences were detected between the two groups with regard to gender and age.
Next,we used receiver operating characteristic curves to illustrate the potential of MYBL2 to diagnose ccRCC.When the area under the curve was 0.937,MYBL2 demonstrated extremely high specificity and sensitivity for ccRCC diagnosis(Figure 2A).MYBL2 expression in cases of ccRCC with different clinicopathological parameters was also compared.Patients in the high-MYBL2 group showed a worse T(Figure 2B),N (Figure 2C),and M (Figure 2D) stage,a more deleterious histological grade (Figure 2E) and pathological stage,and a higher risk (Figure 2F) when compared to those in the low-MYBL2 group.
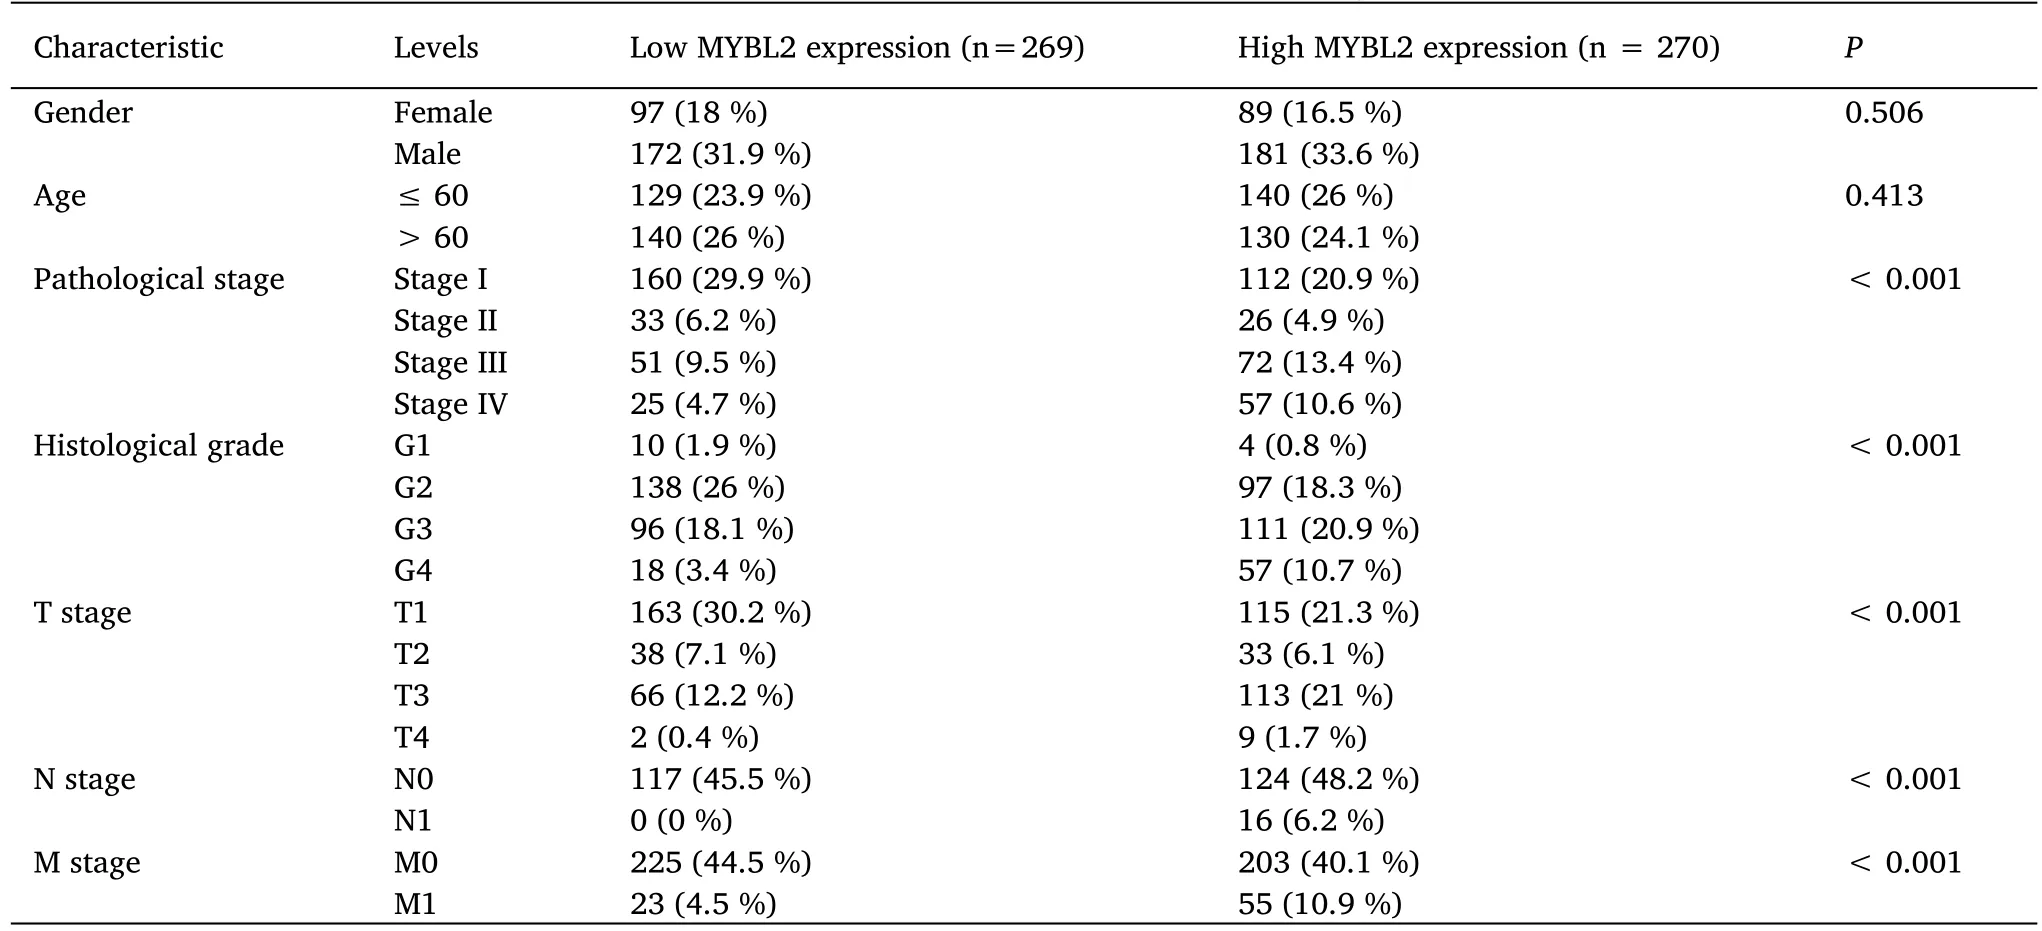
Table 1 Association between MYBL2 expression and clinicopathological features in ccRCC
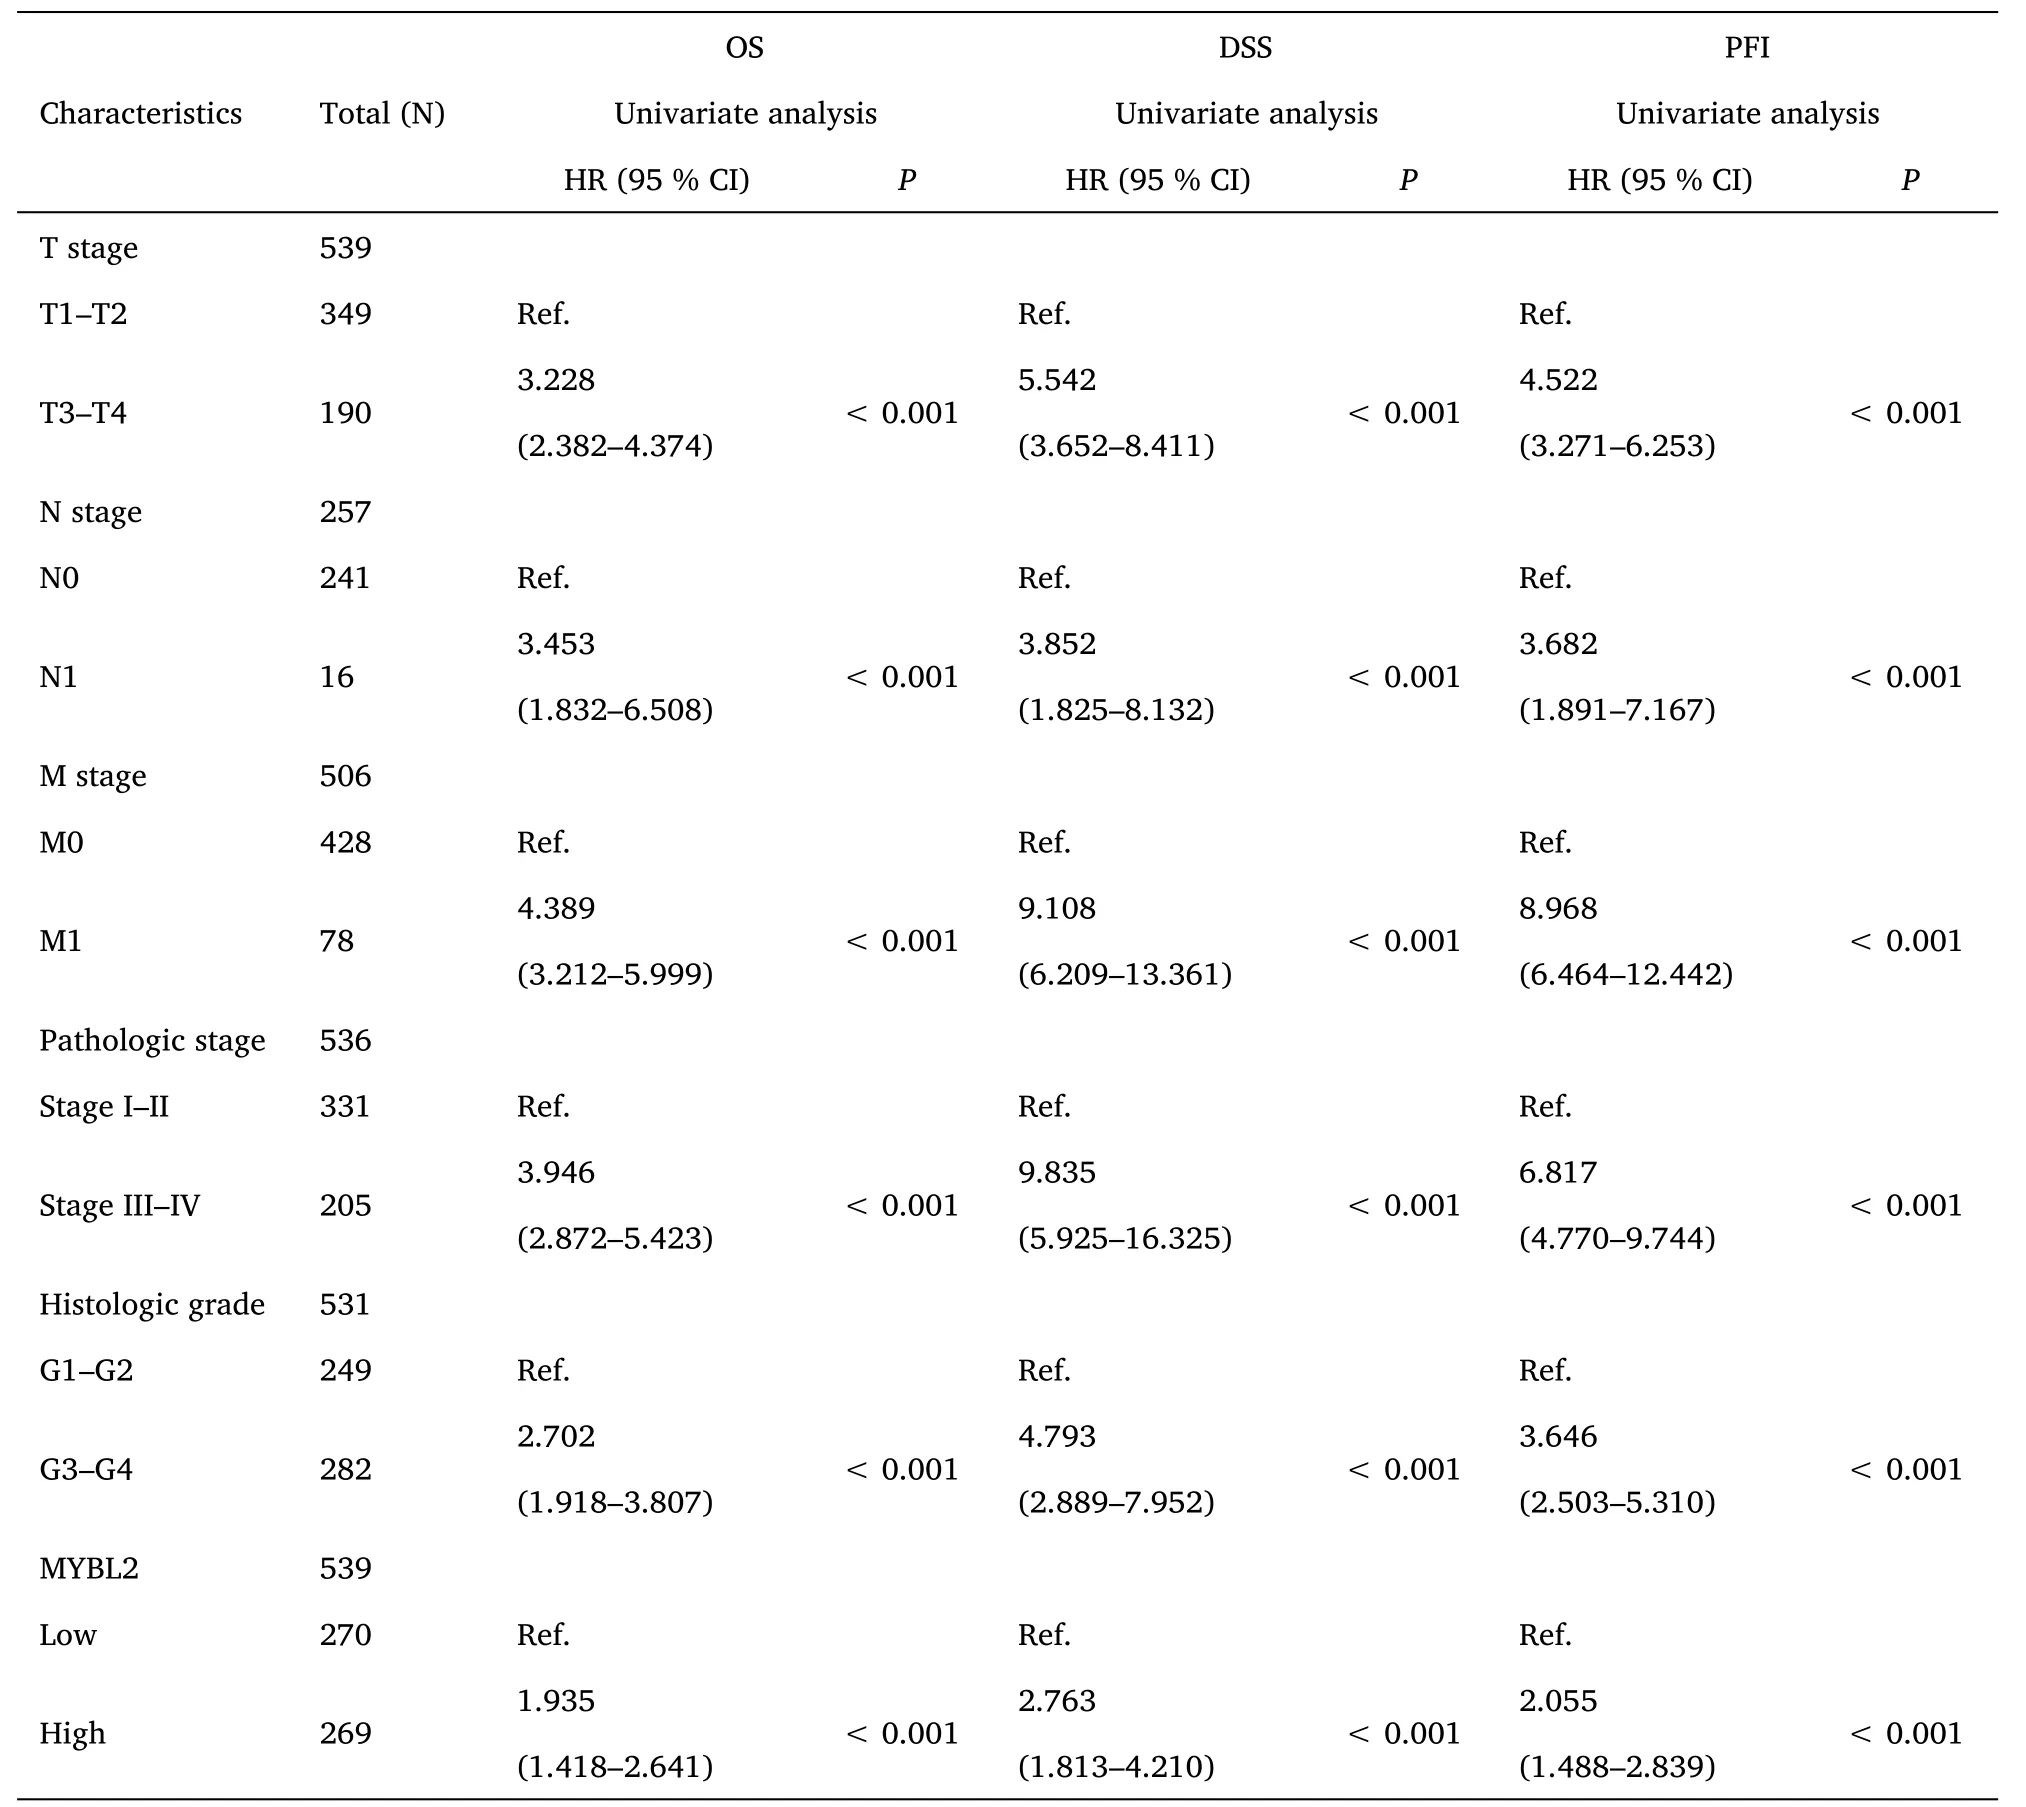
Table 2 Univariate Cox-regression analysis for the clinical outcomes of ccRCC patients

Table 3 Multivariate analysis for the prognostic outcomes of ccRCC
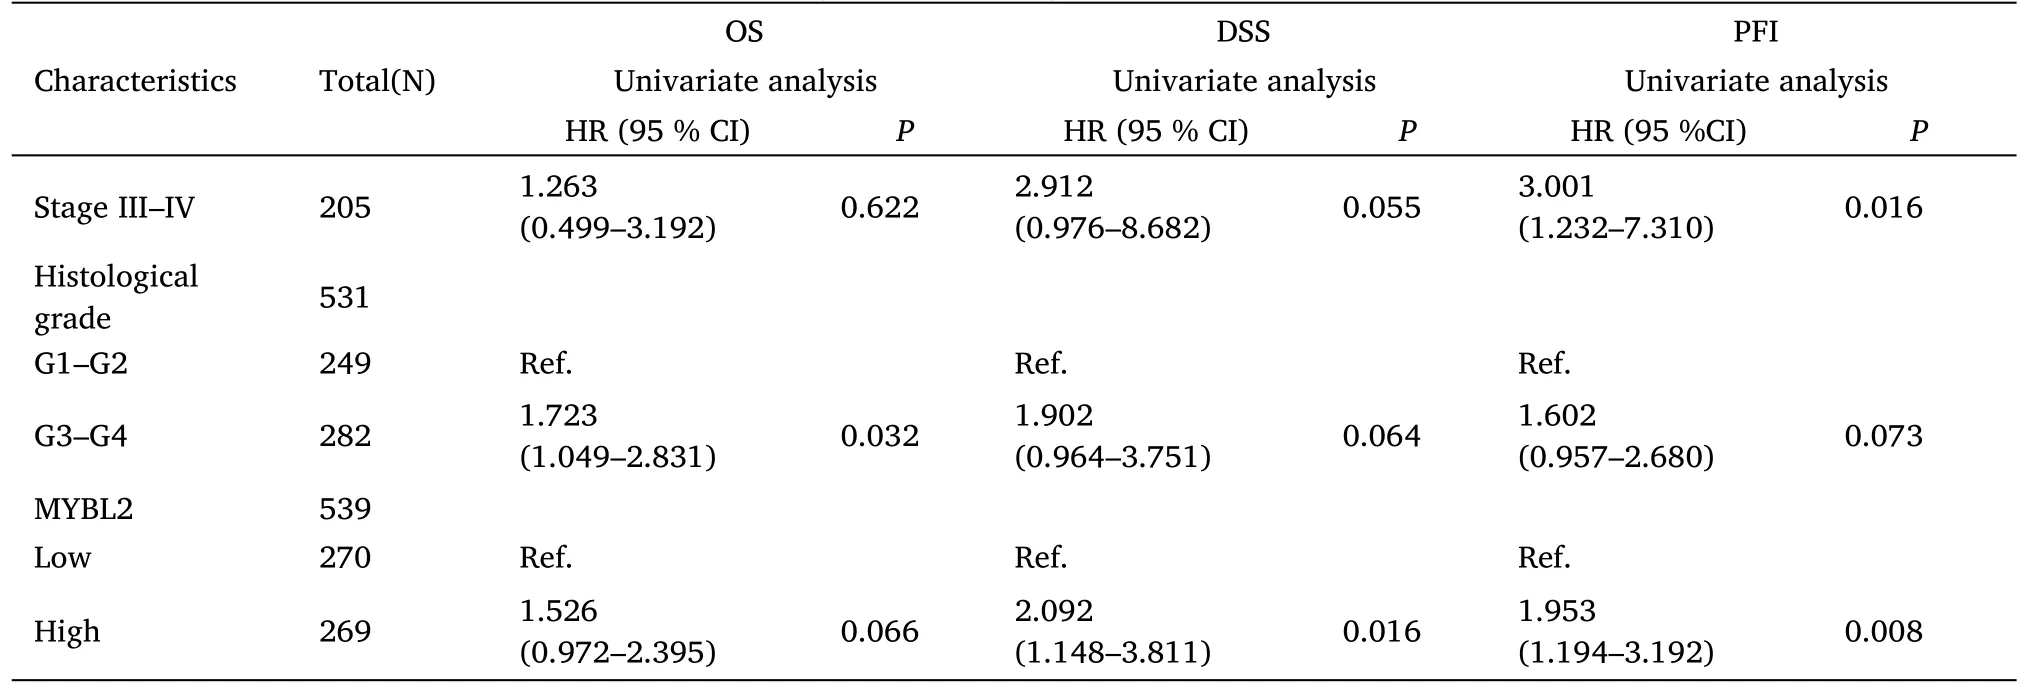
Table 3 Multivariate analysis for the prognostic outcomes of ccRCC(Continued)
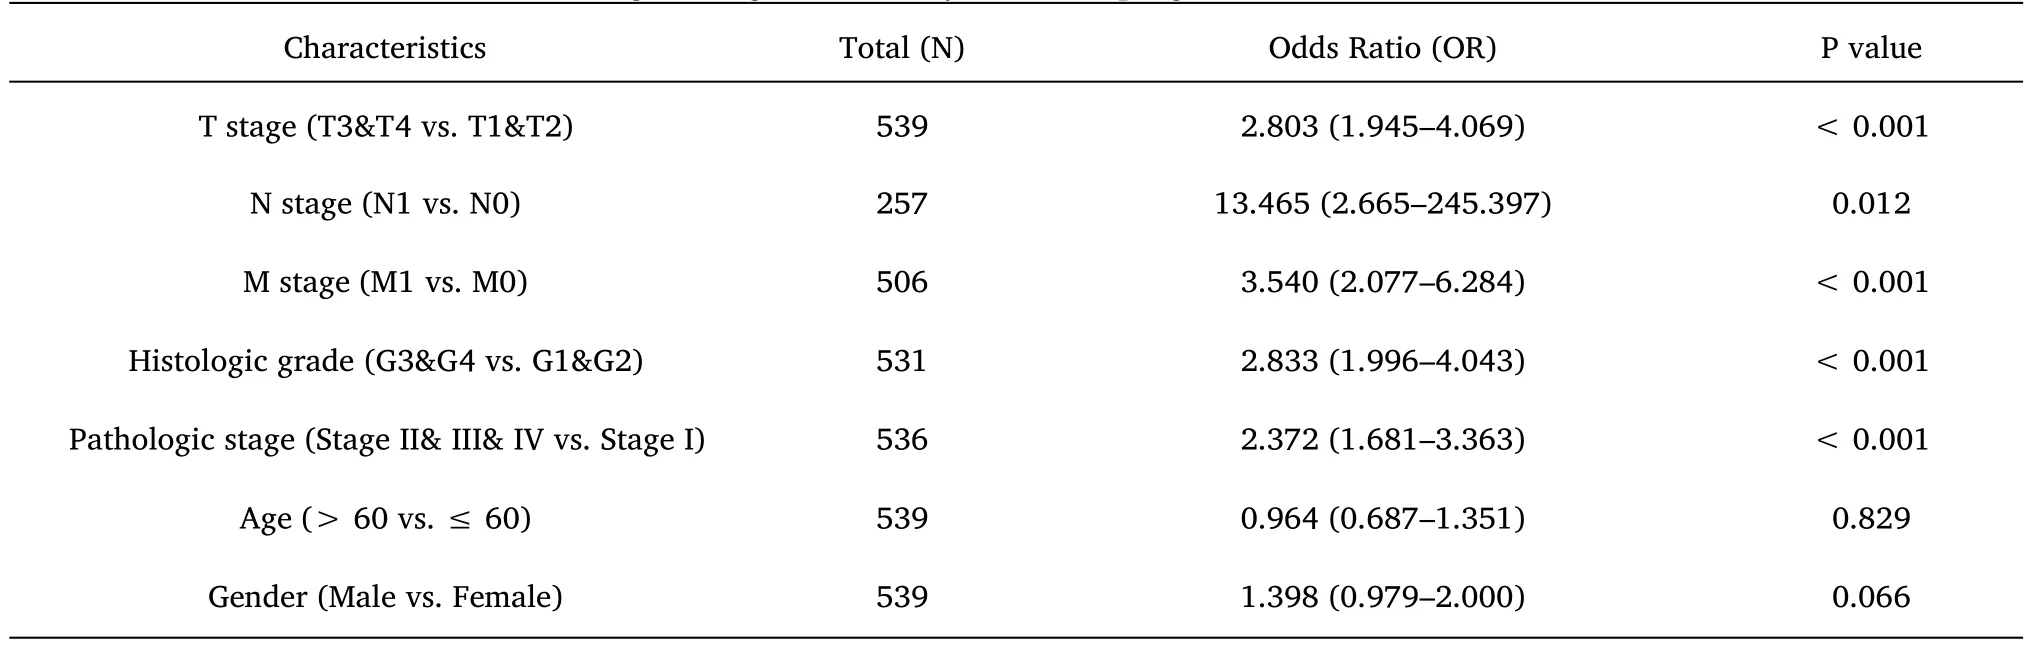
Table 4 Logistic regression analysis for the prognostic outcomes of ccRCC
Prognostic performance of MYBL2 in clinicopathological subgroups of ccRCC
Furthermore,to assess the prognostic values of MYBL2,we conducted univariate Cox-regression analysis on specific subgroups (Table 2).As illustrated in Table 2,MYBL2 was established as an independent risk factor for OS in T stages T3 and T4 (HR=3.228,P<0.001),M1 stage (HR=4.389,P<0.001),N1 stage (HR=3.453,P<0.001),pathological stages stage III and IV (HR=3.946,P<0.001),and histological grades G3 and G4 (HR=2.702,P<0.001).Results revealed that MYBL2 was also an independent factor for DSS and PFI.Moreover,multivariate Cox-regression analysis was carried out to further investigate the clinical prognostic values of MYBL2.As shown in Table 3,Additionally,logistic analysis was also conducted to illustrate the relationship between clinicopathological features and MYBL2 in Table 4.MYBL2 acts as a potential risk factor for DSS (HR=2.092,P=0.016) and PFI(HR=1.953,P=0.008).Moreover,M stage was associated with predictive benefits for clinical prognosis in multivariate analysis.Next,Kaplan-Meier curves were applied to prove the prognostic benefits of MYBL2 for clinical outcomes.As illustrated in Figure 2G-I,for patients in the high-MYBL2 group,PFI(HR=2.03,P<0.001) OS (HR=1.91,P<0.001),and DSS (HR=2.73,P<0.001) were predictors of worse clinical outcomes when compared to those in the low-MYBL2 group.
To verify the predictive values of MYBL2 for the clinical prognosis of ccRCC,all independent prognostic factors identified in the multivariate analysis were used as significant elements to create a prognostic nomogram.M stage,histological grade,pathological stage and MYBL2 were included in the nomograms to predict OS with a C-index of 0.714 (0.693-0.734) (Figure 3A),disease-specific survival with a C-index of 0.770 (0.746-0.793) (Figure 3B),and progression-free interval with a C-index of 0.800 (0.782-0.817)(Figure 3C).Furthermore,calibration curves were constructed to verify the accuracy of the prognostic nomograms.All calibration curves showed satisfactory predictive outcomes for 1-,3-and 5-year prognosis (Figure 3D,E,F).
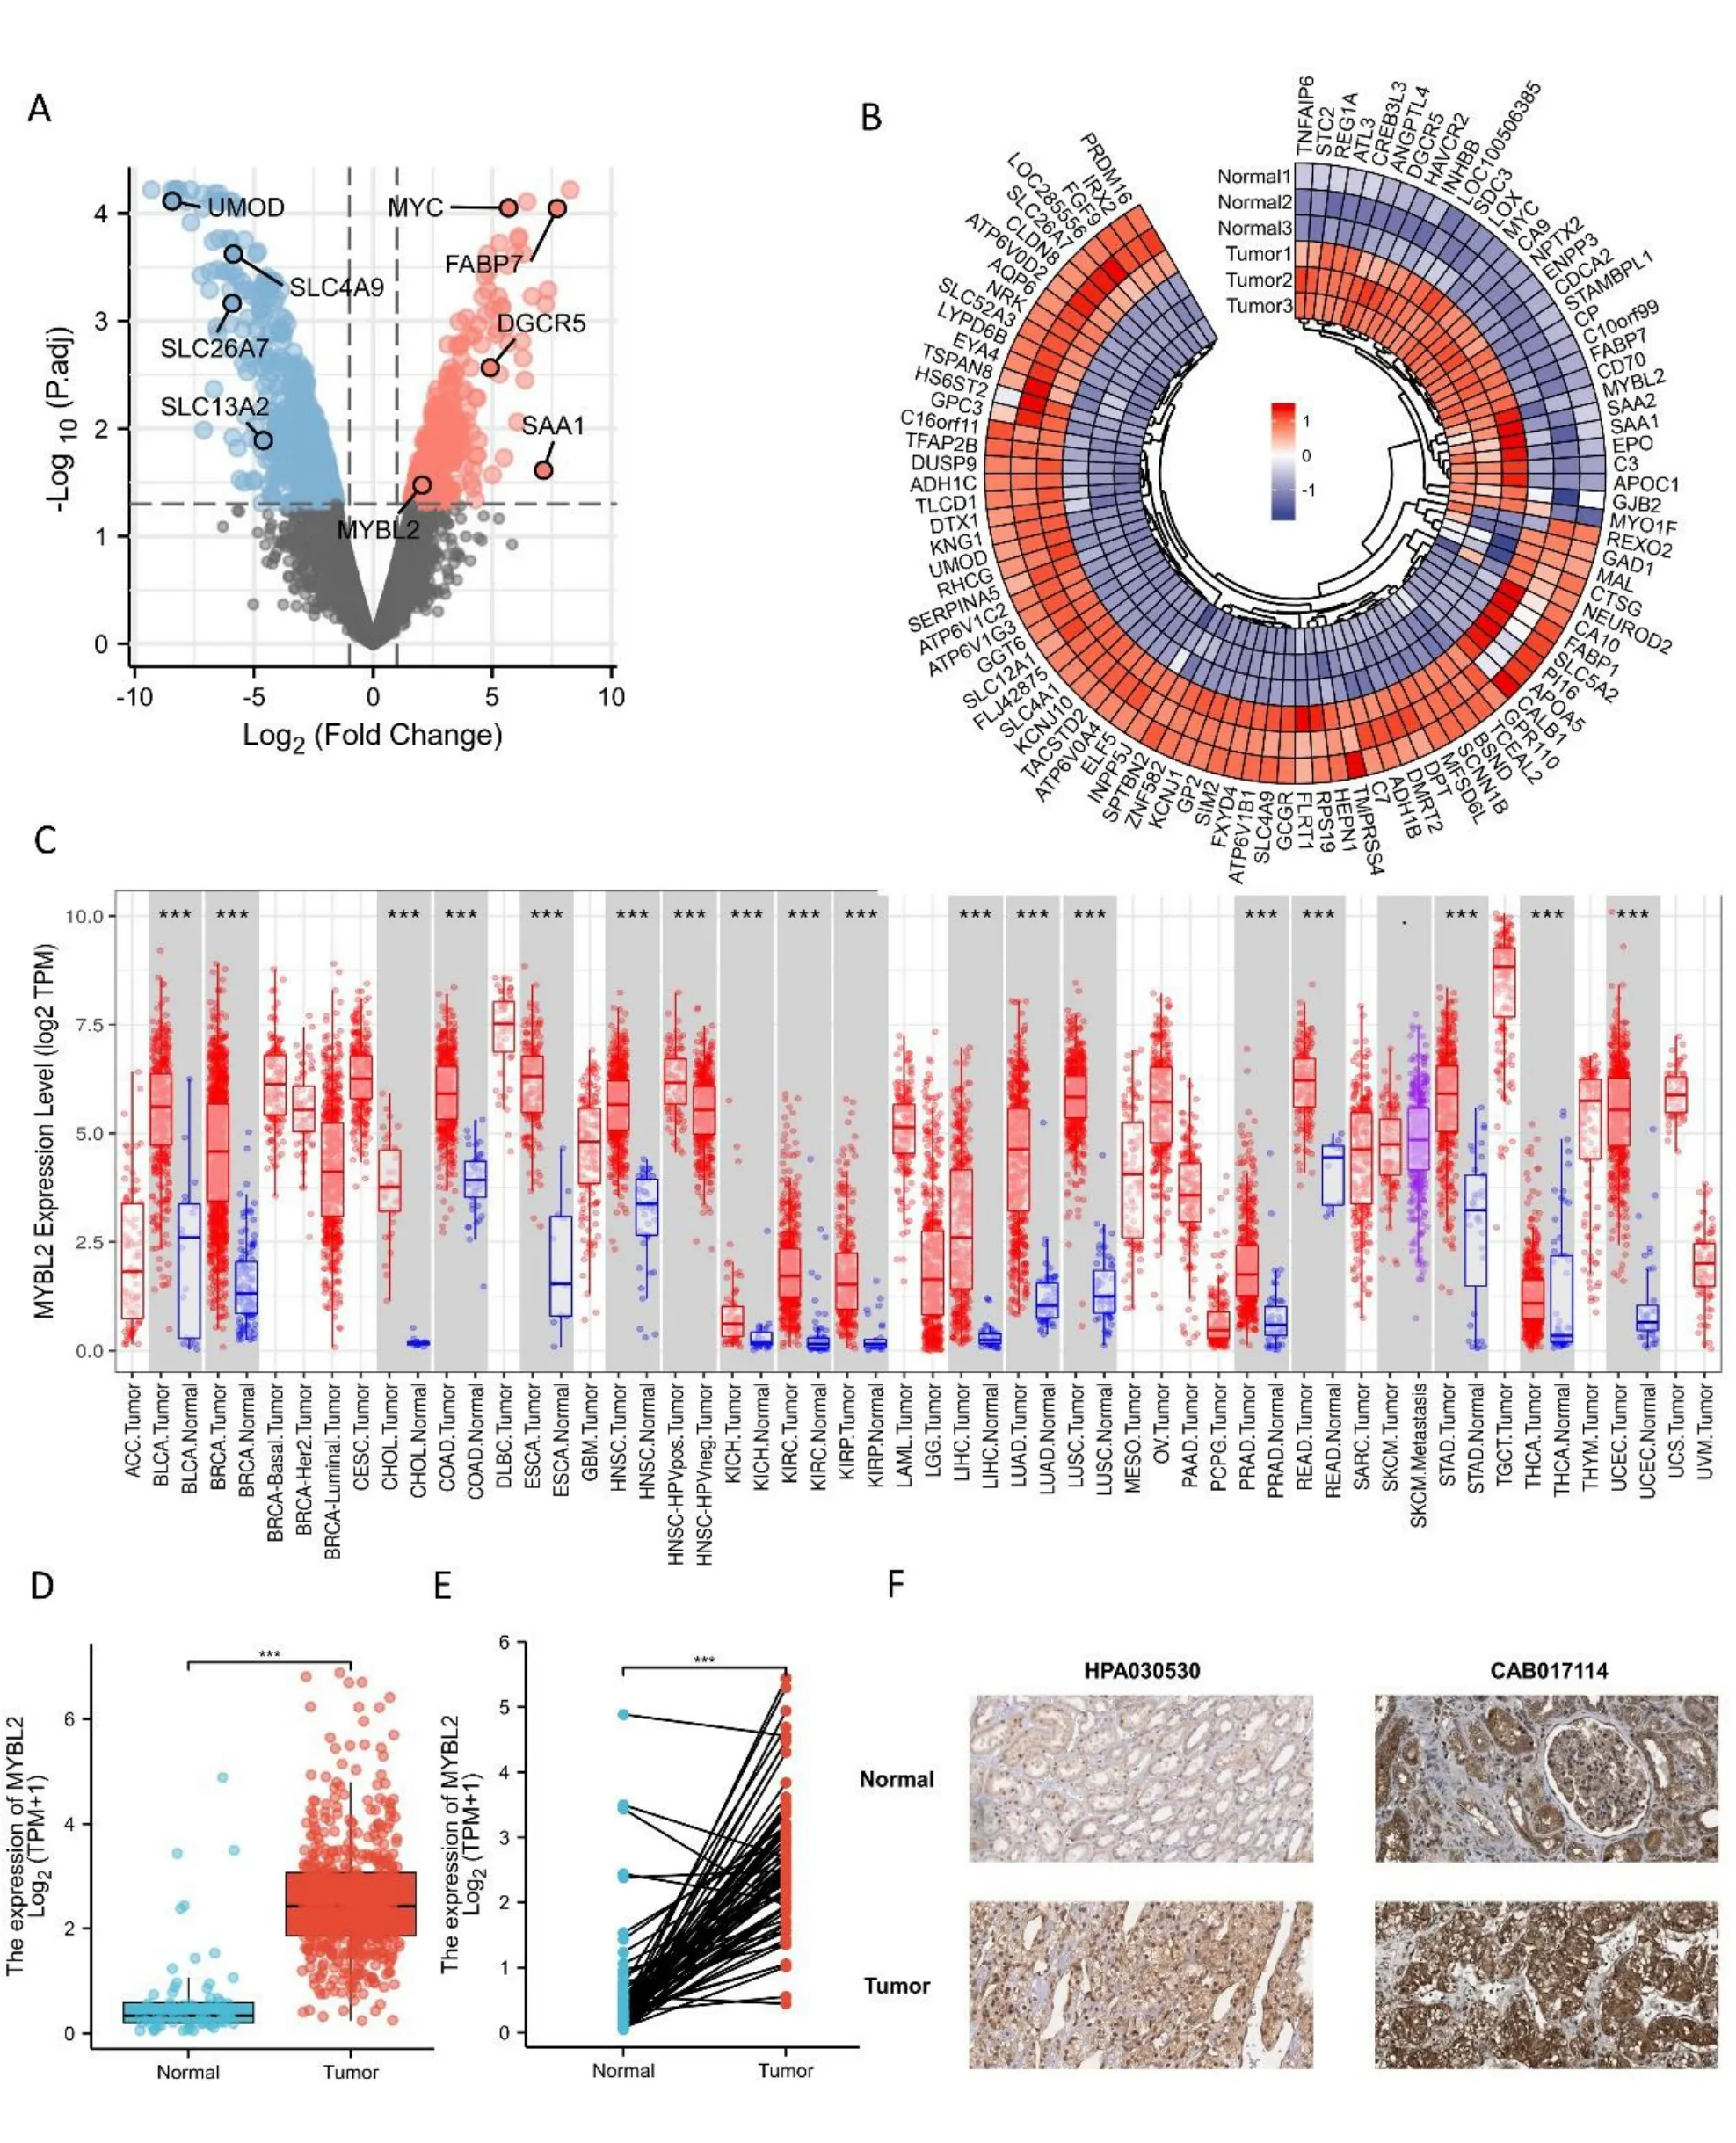
Figure 1 Differential mRNA expression profiles in ccRCC patients stratified by MYBL2 levels.(A) A volcano plot representing differentially expressed genes between tumors and paired adjacent normal tissues based on the GSE100666 dataset.Significantly upregulated genes are colored in red whereas significantly downregulated genes are colored in blue.(B) Heat map of the most prevalent over/under expressed genes in ccRCC from selected studies.Heat map displaying the 100 most differently expressed genes between healthy controls and ccRCC patients.Red pixels correspond to an increased abundance of mRNA in the samples whereas blue pixels indicate decreased mRNA levels.Rows represent genes and columns represent experimental samples.Normal1,GSM2 690790;Normal2,GSM2 690789;Normal3,GSM2 690788;Tumor1,GSM2 690787;Tumor2,GSM2 690786;Tumor3,GSM2690785.(C) A comparison of MYBL2 expression between tumors and pericarcinous tissues in different types of cancers based on TCGA database.ns, P ≥0.05;*P <0.05;**P <0.01;***P <0.001.(D) Expression levels of MYBL2 in ccRCC (n=539) and normal tissue (n=72).(E) The expression of MYBL2 in ccRCC (n=72) and its paired adjacent tissues (n=72).(F) MYBL2 mRNA expression in normal tissue and ccRCC..ccRCC,clear cell renal carcinoma;MYBL2,MYB Proto-Oncogene Like 2.
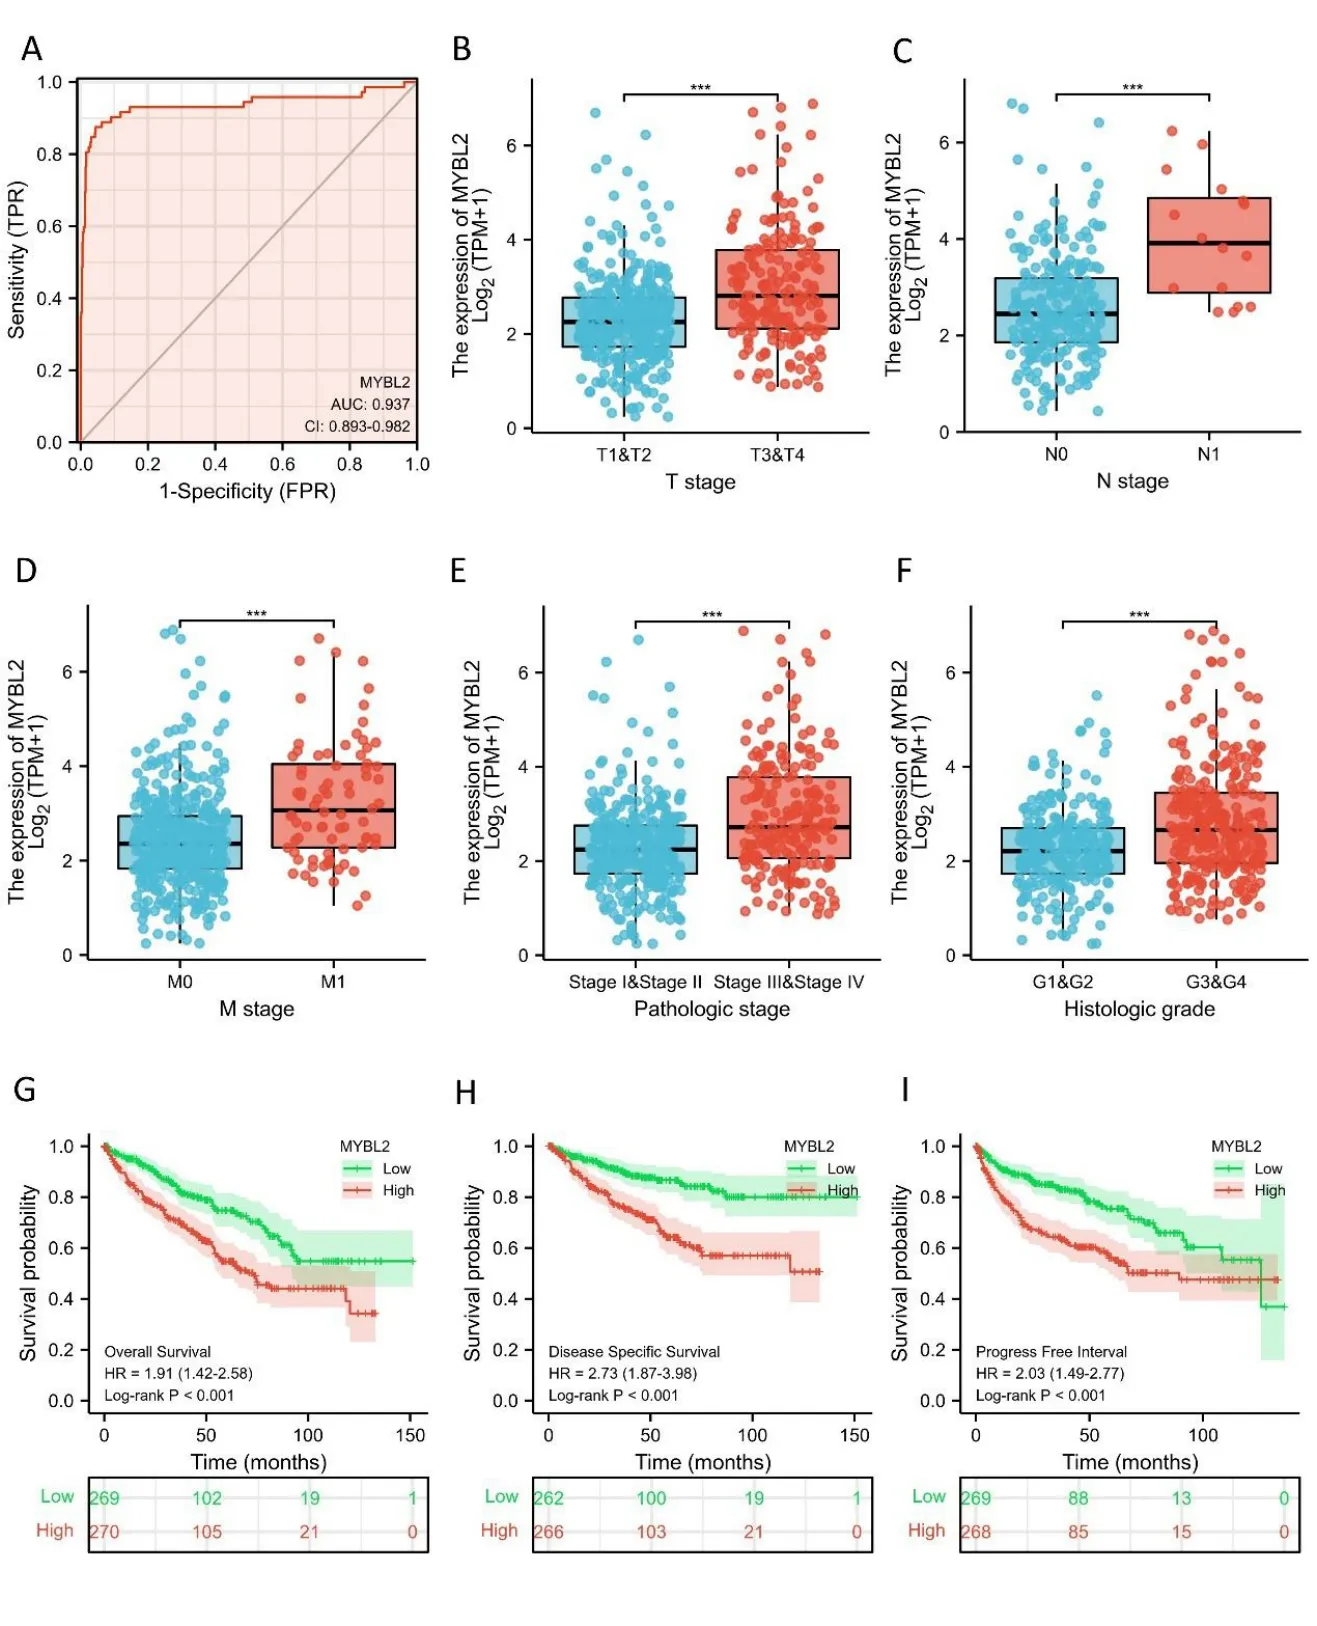
Figure 2 MYBL2 expression is associated with clinicopathological characteristics in ccRCC patients.(A) Receiver operating characteristic curve analysis evaluating the performance of MYBL2 for ccRCC diagnosis.The Wilcoxon rank sum test was applied to analyze the association between MYBL2 expression and clinical T stage (B),clinical N stage (C),clinical M stage (D),histological grade (E),and pathological stage (F)Kaplan-Meier analyses comparing overall survival (G),disease-specific survival (H),and progression-free interval (I) between high-and low-MYBL2 expression groups.ccRCC,clear cell renal carcinoma;MYBL2,MYB Proto-Oncogene Like 2.
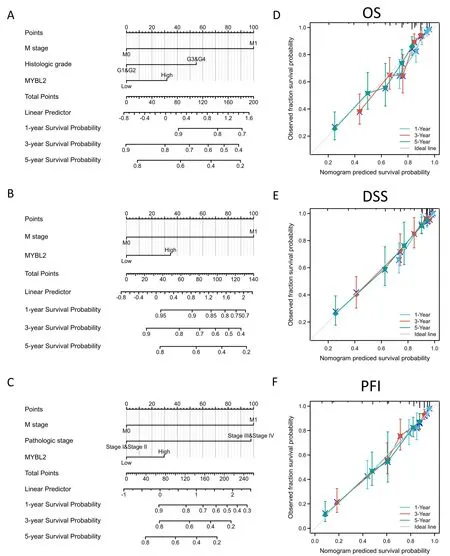
Figure 3 The predictive value of MYBL2 expression for clinical outcomes in patients with clear renal ccRCC and the construction and validation of nomograms based on MYBL2 expression.The nomograms were constructed to establish MYBL2 expression-based risk scoring models for 1-,3-,and 5-year overall survival (A),disease-specific survival (B),and progression-free interval (C).Calibration plots validating the efficiency of nomograms for overall survival (D),disease-specific survival (E),and progression-free interval (F).ccRCC,clear renal cell carcinoma;MYBL2,MYB Proto-Oncogene Like 2;OS,overall survival;DSS,disease-specific survival;PFI,progression-free interval.
MYBL2 expression was positively correlated with ICI in ccRCC
Next,we evaluated the infiltration of 24 types of immune cells in ccRCC by using the ssGSEA method.The correlations between MYBL2 and ICI were then analyzed by Spearman’s tests.As shown in Figure 4A,Th2 cells (R=0.613,P<0.001),Treg (R=0.454,P<0.001),Th1 cells (R=0.428,P<0.001),T cells (R=0.396,P<0.001),Macrophage(R=0.350,P<0.001),TFH (R=0.342,P<0.001),B cell (R=0.329,P<0.001),aDC (R=0.319,P<0.001),NK CD56+cell (R=0.294,P<0.001),DC (R=0.284,P<0.001),cytotoxic cells (R=0.269,P<0.001),T helper cells (R=0.268,P<0.001),iDC (R=0.156,P<0.001),NK CD56dim cells (R=0.132,P=0.002),and CD8 T cells(R=0.131,P=0.002)showed a positive and significant association with MYBL2 while Th17 cells(R=-0.187,P<0.001) showed a negative correlation with MYBL2.To verify the accuracy of the correlations between MYBL2 and ICI using the ssGSEA method,eight of the most statistically significant immune cells were evaluated based on the TISIDB database,including act_CD8+T cells(Figure 4B),act_CD4+T cells (Figure 4C),Th1 cells (Figure 4D),Th2 cells (Figure 4E),act_DC cells (Figure 4F),and macrophages (Figure 4G).Results from the TISIDB database were similar to those derived from the ssGSEA method.
The relationship between MYBL2 and immune checkpoints in ccRCC
The correlations between MYBL2 and immune checkpoints in ccRCC were visualized as a heat map based on data from the TISIDB database(Supplementary Figure S1).As shown in the heat map,several immune checkpoints,including PDCD1,CTLA-4,CD96,and LAG3,were detected.Since these four molecules are vital for tumor cells to evade immune escape,the relationship between MYBL2 and these immune checkpoints was then evaluated (based on the TIMER database) by Spearman’s analysis (Figure 5A-D).Adjusted by tumor purity,correlation scatter diagrams illustrated the positive association between MYBL2 and these immune checkpoints.Next,we validated the results yielded by the TISIDB database and identified significant and positive correlations between MYBL2 and PDCD1 (Supplementary Figure S2 A),CTLA-4 (Supplementary Figure S2 B),LAG3(Supplementary Figure S2 C),and CD96(Supplementary Figure S2 D).
Prediction of upstream miRNAs targeting MYBL2 in ccRCC
Research has shown that non-coding RNAs play a vital role in modulating the expression of downstream mRNAs.To predict upstream MYBL2-targeted miRNAs,we used the miRanda,PITA and TargetScan databases to analyze 33,11,11 MYBL2 target miRNAs,respectively.We constructed a Venn diagram to depict MYBL2-targeted miRNAs that were commonly predicted by all three databases,including miR-29a/b/c-3p,miR-30a/b/c/d/e-5p,and miR-143-3p (Figure 6A).Furthermore,we used the starbase database to investigate the association between MYBL2 and its target miRNAs.As shown in Figure 6C-D,miR-29c-3p (r=-0.237,P<0.0001),miR-30a-5p (r=-0.401,P<0.0001),miR-30b-5p (r=-0.187,P<0.0001),miR-30c-5p (r=-0.241,P< 0.0001),miR-30d-5p(r=-0.289,P<0.0001),and miR-30e-5p (r=-0.115,P<0.0001)were shown to exhibit a significant negative correlation with MYBL2.The starbase database was also used to predict potential binding sites of MYBL2 to the target miRNAs(Figure 6B).
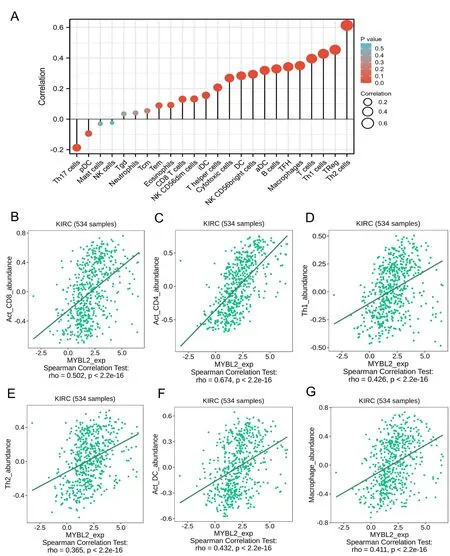
Figure 4 Correlation between immune cell infiltration and MYBL2 expression in patients with ccRCC.(A) Relationships among the infiltration levels of 24 immune cell types and MYBL2 expression profiles by Spearman’s analysis.The correlation of infiltration levels of immune cells,including Act_CD8 (B),Act_CD4 (C),Th1 (D),Th2 (E),Act_DC (F),and macrophages (G).MYBL2,MYB Proto-Oncogene Like 2;ccRCC,clear cell renal carcinoma.
Prediction of lncRNAs upstream of MYBL2 target miRNAs and the construction of a MYBL2-related ceRNA network in ccRCC
Next,to ascertain whether the expression of MYBL2 was modulated by upstream ncRNAs,we used the starbase database to predict that six MYBL2 target miRNAs.It is widely recognized that the realization of the ceRNA network hypothesis needs negative correlation between lncRNAs and miRNAs.As shown in Figure 7A-B,miR-29c-3p exhibited a negative association with two target lncRNAs,including CCDC144NL-AS1 (r=-0.135,P< 0.01) and LINC00511 (r=-0.172,P<0.0001).C10orf25 (r=-0.183,P<0.0001) exhibited a negative correlation with miR-30b-5p.Furthermore,miR-30e-5p was negatively associated with C10orf25 (r=-0.115,P< 0.01),LINC00921 (r=-0.181,P<0.0001) and PVT1 (r=-0.146,P<0.001). Based on the ceRNA network hypothesis,a miRNAs-lncRNAs-MYBL2 network was established as six pairs of ceRNA networks,including CCDC144NL-AS1-miR-29c-3p-MYBL2,LINC00511-miR-29c-3p-MYBL2,C10orf25-miR-30b-5p-MYBL2,C10orf25-miR-30e-5p-MYBL2,LINC00921-miR-30e-5p-MYBL2 and PVT1-miR-30e-5p-MYBL2 (Figure 7C).All of these ceRNA networks were highlighted by our correlation analysis.

Figure 5 Correlation of immune checkpoints and MYBL2 expression in patients with ccRCC.Shown are the Spearman’s correlation of MYBL2 with the expression of statistically significant immune checkpoints in ccRCC adjusted by purity using TIMER,including PDCD1 (A),CTLA-4 (B),LAG3 (C),and CD96 (D).MYBL2,MYB Proto-Oncogene Like 2;ccRCC,clear cell renal carcinoma.
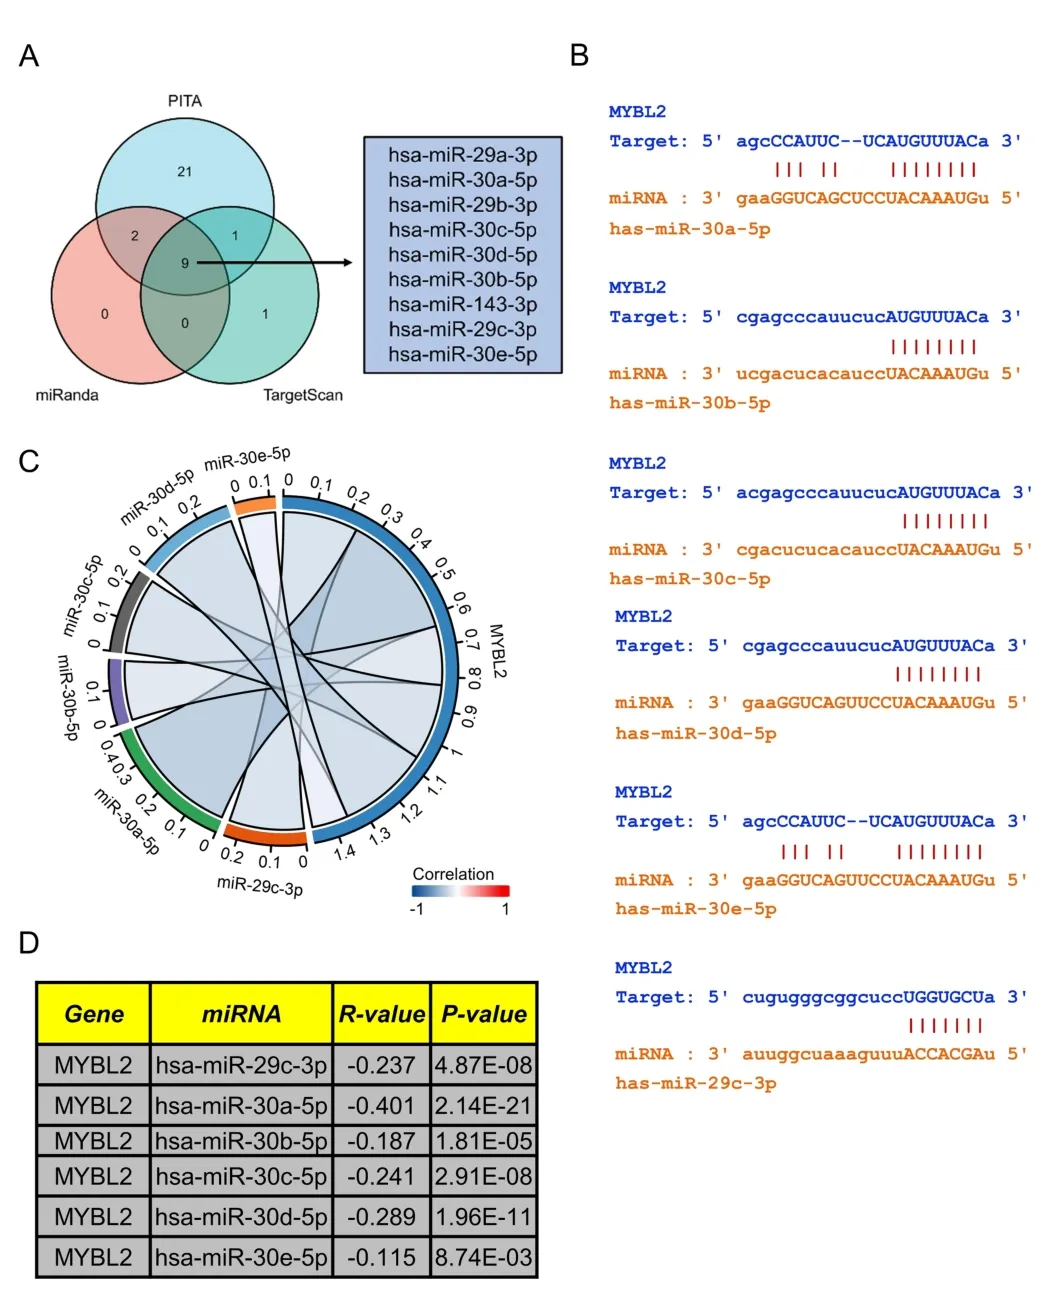
Figure 6 Prediction of miRNAs targeting MYBL2 in ccRCC.(A) Venn diagram showing the prediction results of MYBL2 targets arising from the PITA,miRanda,and TargetScan software packages.(B) TargetScan was used to predict the potential binding sites of MYBL2 to target miRNAs.(C)Chor plots showing target miRNA-mRNA with significant correlations according to the starbase database;(D) A table showing the significant correlation between MYBL2 and target miRNA.miRNA,microRNA;MYBL2,MYB Proto-Oncogene Like 2;ccRCC,clear cell renal carcinoma.
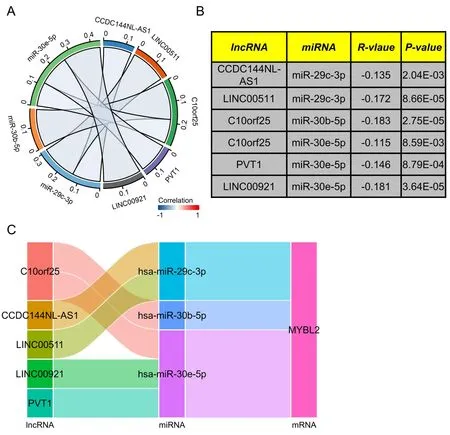
Figure 7 Construction of a predicted lncRNA and ceRNA network in ccRCC.We used starbase software to analyze the correlation between miRNA and target lncRNA (A) We used chord plots to show miRNA-lncRNA pairs that were significantly correlated.(B) A table showing the significant correlation between lncRNA and target miRNA.(C) Sankey diagram showing the lncRNA-miRNA-mRNA (MYBL2) regulatory network in line with the ceRNA hypothesis.lncRNA,long non-coding RNA;ceRNA,completing endogenous RNA;miRNA,microRNA;ccRCC,clear cell renal carcinoma;MYBL2,MYB Proto-Oncogene Like 2.
Further validation of potential upstream lncRNAs binding to MYBL2 target miRNAs in ccRCC
To detect the most likely upstream lncRNAs for the predicted MYBL2 target miRNAs in ccRCC,expression analysis,correlation analysis,and survival analysis,should be taken into consideration based on the hypothesis that the construction of a ceRNA network involves negative miRNA-lncRNA correlation and positive lncRNA-mRNA association.As shown in Figure 8A-C,PVT1 expression was significantly higher in the high-MYBL2 group,negatively associated with miR-30e-5p,and positively correlated with MYBL2.Similarly,significantly higher expression levels of LINC00511 in the high-MYBL2 group was negatively correlated with miR-29c-3p and positively correlated with MYBL2 (Figure 8D-F).Survival analysis based on the log-rank test,including overall survival and disease-specific survival,that the higher expression of PVT1 and LINC00511 in the high-MYBL2 group was associated with a poor prognosis (Supplementary Figure S3).qRT-PCR was employed to validate the mRNA expression of MYBL2 and PVT1 between ccRCC cell lines and normal kidney cell lines (Figure 9B,C).Based on our results,the MYBL2 statistically over-expressed in 786-O than in HK-2(P<0.001) and the expression of PVT1 was significantly higher in Caki-1 than in HK-2 (P<0.001).Additionally,we have analyzed other 3 axes based on TCGA database.We found that in Supplementary Figure S4 A-C,C10orf25,also named as ZNF22-AS1 was significantly elevated in the ccRCC group.CCDC144NL-AS1 expression was significantly higher in the ccRCC group than in normal group.The expression of LINC00921 was elevated in ccRCC group.Survival analysis based on the log-rank test,including overall survival and disease-specific survival,revealed that C10orf25 was associated with better prognosis in ccRCC (Supplementary Figure S4 D,G).However,no statistical significance was found in association between prognosis and two lncRNAs (CCDC144NL-AS1 and LINC00921) in ccRCC(Supplementary Figure S4 E,F,H,I).Since these three lncRNAs didn’t reveal poor prognosis in ccRCC,we excluded these three ceRNA axes.

Figure 8 Expression analysis and correlation analysis for upstream lncRNAs in ccRCC.(A) Expression levels of PVT1 in ccRCC (n=539) and normal tissue (n=72).(B) Scatter plots showing PVT1-miRNAs with significant correlation.(C) Scatter plots showing the correlation between PVT1 and MYBL2.(D) Expression levels of LINC00511 in ccRCC (n=539) and normal tissue (n=72).(E) Scatter plots showing LINC00511-miRNAs with significant correlation.(F) Scatter plots showing the correlation between LINC00511 and MYBL2.lncRNA,long non-coding RNA;ccRCC,clear cell renal carcinoma;miRNA,microRNA;MYBL2,MYB Proto-Oncogene Like 2.
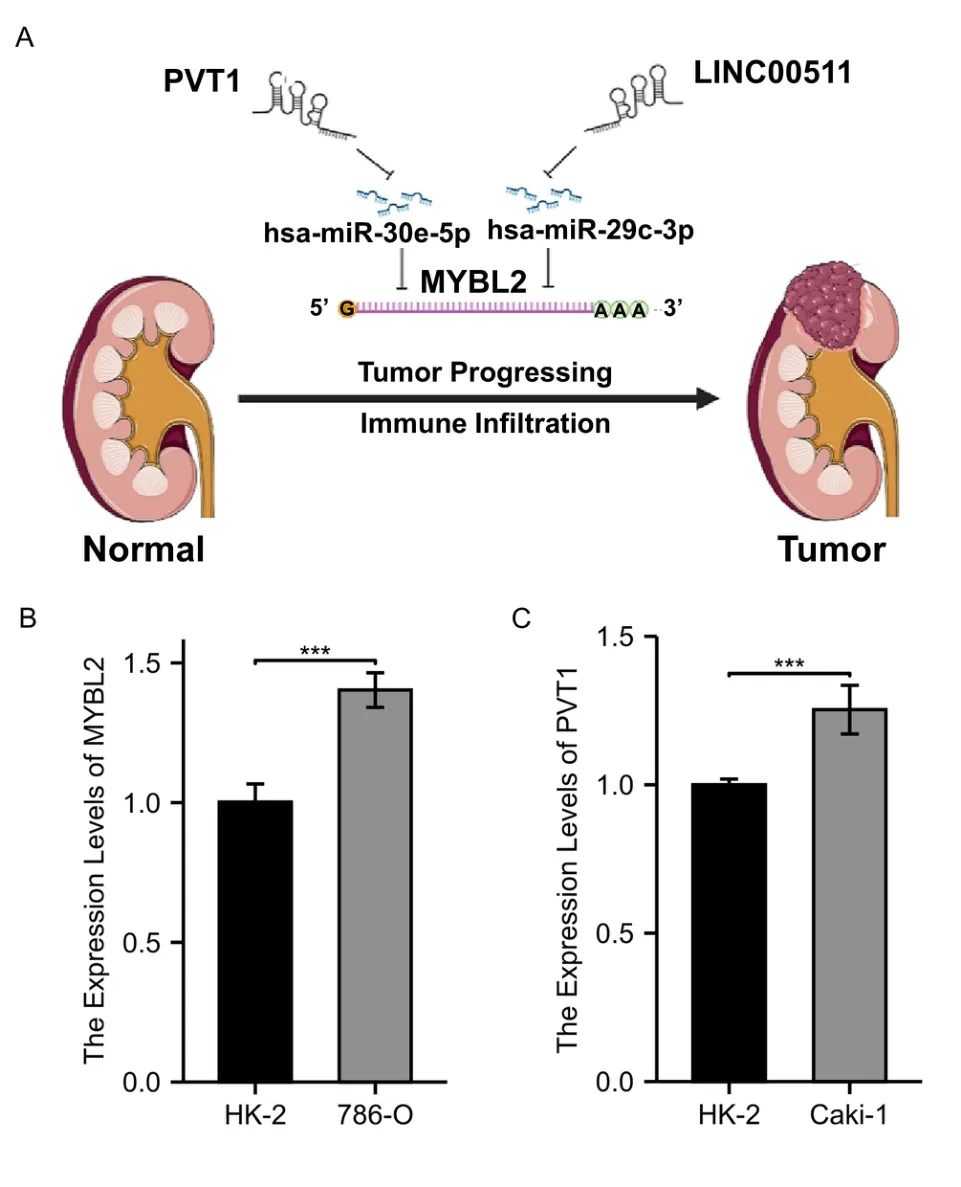
Figure 9 A model of the PVT1-hsa-miR-30e-5p-MYBL2 and LINC00511-hsa-miR-29c-3p-MYBL2 axis in the carcinogenesis of ccRCC and qRT-PCR validation.(A) two ceRNA axes,PVT1-miR-30e-5p-MYBL2 and LINC00511-miR-29c-3p-MYBL2 were detected as the most promising upstream ncRNAs regulating MYBL2 in ccRCC.(B) A comparison on the expression of MYBL2 between 786-O and HK-2 (C) A comparison on the expression of PVT1 between Caki-1 and HK-2.MYBL2,MYB Proto-Oncogene Like 2;ccRCC,clear cell renal carcinoma;HK-2,human kidney-2 cell line.
Discussion
Currently,ccRCC has a notorious reputation as a human cancer due to its unfavorable prognostic outcome.Therefore,identifying the precise molecular mechanisms of MYBL2 in ccRCC might be an essential strategy to identify potential prognostic biomarkers or suggest effective therapeutic targets.Increasing evidence has illustrated the vital significance of MYBL2 in the generation and progression of various types of human cancers,including ccRCC.However,there is still a lack of understanding with regard to the precise role of MYBL2 in ccRCC.
In our study,we first explored DEGs from the GSE100666 dataset;these DEGs were associated with the overexpression of MYBL2 in the tumor group.Then,we conducted pan-cancer analysis based on the TIMER database to show that MYBL2 was significantly elevated in ccRCC tissues when compared to peri-tumor tissues.With regards to clinicopathological characteristics,Sun et al.reported that the overexpression of MYBL2 was positively related to age,gender,clinical stage,histological grade,T stage,along with distant metastasis and lymph node metastasis [29].Nevertheless,we found no significant difference between the high-MYBL2 group and the low-MYBL2 group regarding age and gender,although this may have been due to different sample sizes.Furthermore,survival analysis relating to the comparison between high-and low-MYBL2 subgroups and based on OS,DSS,PFI,revealed a poor prognosis in patients with high expression levels of MYBL2.These findings demonstrate that MYBL2 can be developed as a crucial diagnostic indicator,prognostic biomarker,and therapeutic target for ccRCC.
It has been widely reported that ncRNAs,such as circular RNAs,lncRNAs,and miRNAs,participate in the control of gene expression via ceRNA-related mechanisms [30-33].To identify predictive candidate MYBL2 target miRNAs,we employed MYBL2 target miRNAs from the miRanda,PITA and TargetScan databases and identified nine promising miRNAs which frequently appeared in all three databases.After performing correlation analysis with MYBL2,six candidate MYBL2 target miRNAs were identified,including miR-29c-3p and miR-30a/b/c/d/e-5p.Increasing evidence has demonstrated that these miRNAs mediate tumor suppression in ccRCC.For instance,miR-30a-5p was found to bind to the 3’-untranslated region of ZEB2(zinc-finger E-box binding homeobox 2),suppressed the aggressiveness of ccRCC cells,and downregulated epithelial-mesenchymal transition in ccRCC cells [34].Moreover,miR-30a-5p promoter methylation (miR-30a-5pme) was identified as a biomarker for the identification of tumor progression and poor prognosis in ccRCC.miR-30a-5pmealso exhibited an inverse association with miR-30a-5p,thus suggesting the suppressive effects of this miRNA on tumors [35].MiR-30b-5p has been reported to suppress cell growth and metastasis by targeting GNA13 (G-protein subunit α-13 and Rab-3D (Ras-related protein Rab-3D) [36].Acting as a form of urinary exosome,miR-30c-5p inhibited the aggressiveness of tumors in ccRCC by targeting HSPA5 (heat-shock protein 5) [37].Other research showed that miR-30d-5p function as an inhibitor of tumor growth and autophagy by targeting ATG5 (autophagy-related gene 5) in RCC [38].However,additional basic experiments and bioinformatic analysis are still needed to fully explore the tumor-suppression function of miR-29c-3p and miR-30e-5p in ccRCC[39].Therefore,our study provides the basis for subsequent hypothesis testing using appropriate experimental methods.
Based on the principles of ceRNA,certain lncRNAs could be integrated into the miRNA-lncRNA-MYBL2 axis as an oncogenic lncRNA in ccRCC [40].Therefore,we evaluated expression,survival,and correlation analyses among predicted lncRNAs negatively associated with MYBL2 target miRNAs and the upstream lncRNAs,LINC00511 and PVT1.By elevating the expression of cyclin D1,LINC00511 was previously shown to acte as a miR-625 sponge to downregulate its mRNA silencing function [41].However,few studies have investigated the clinicopathological benefits of LINC00511.Previous research showed that hypoxia-induced factor-2α enhanced PVT1 transcription which is known to promote tumorigenesis in ccRCC [42].PVT1 also stabilized the structure of myeloid leukemia cell differentiation protein 1(Mcl-1) to delay apoptosis in tumor cells,thus promoting the development of tumorigenesis in ccRCC [43].Furthermore,PVT1 appears to be closely associated with hypoxia-induced factor-1α,thus affecting genes involved in angiogenesis,migration and the cell cycle [44,45].PVT1 has also been confirmed as an essential biomarker for poor prognosis in ccRCC by various researchers [46-48].In this study,we identified PVT1-miR-30e-5p-MYBL2 and LINC00511-miR-29c-3p-MYBL2 axes,thus highlighting the potential and unique regulatory pathways of ccRCC.
Our findings indicated that MYBL2 was significantly and positively associated with multiple types of immune cells,including Th2 cells,regulatory T cells,Th1 cells,T cells,macrophagess,TFH,B cells,aDC,NK CD56+cells,DC,cytotoxic cells,T helper cells,iDC,NK CD56dim cells,and CD8 T cells in ccRCC.The presence of multiple types of immune cells in the ccRCC microenvironment indicated significant potential for immunotherapy [49-51].Moreover,the efficiency of immunotherapy in human cancers relies on a positive correlation with immune checkpoints [52,53].Previous studies revealed that ccRCC correlated positively with programmed cell death 1,CTLA-4,LAG-3 and TIGIT [54-59].Our present study demonstrated that MYBL2 expression was positively correlated with PDCD1,CTLA-4,LAG-3,and CD96.Other research has demonstrated that CD96 acts as an immune checkpoint and is closely associated with multiple forms of human cancers [60,61].The association between CD96 and high-MYBL2 ccRCC has not yet been recognized widely;the findings of our study suggest an avenue for follow-up validations.
Conclusion
In summary,we identified that the expression levels of MYBL2 were elevated in various types of cancers (including ccRCC) and were associated with poor prognosis in ccRCC.To predict the upstream ncRNAs targeting MYBL2,we constructed ceRNA networks including PVT1-miR-30e-5p-MYBL2 axis and LINC00511-miR-29c-3p-MYBL2 axis.Furthermore,MYBL2 was also significantly correlated with the infiltration of immune cells and with several immune checkpoints,meaning MYBL2 might be a potential target for immunotherapy in ccRCC.However,further fundamental experiments and clinical research are now required to validate the accuracy of these results.

- Medical Data Mining的其它文章
- Bibliometric analysis of literature review of osteoarthritis in the Cochrane database
- Simulation analysis and pharmacokinetic evaluation of atractylide I for the treatment of diabetic nephropathy
- Advancing biological fluorescence microscopy with deep learning: a bibliometric perspective
- Feature selection and machine learning approach for carotid atherosclerosis in asymptomatic adults
- Investigating public perceptions regarding the Long COVID on Twitter using sentiment analysis and topic modeling
- A novel prognosis signature based on two cuprotosis-related genes for kidney renal clear cell carcinoma