采用热红外和可见光图像无损测定棉花苗期叶面积
2022-11-13 07:09陈家乐吴沣槭韩迎春李小飞王占彪王国平雷亚平杨北方辛明华李亚兵
农业工程学报 2022年15期
陈家乐,吴沣槭,韩迎春,李小飞,王占彪,,冯 璐,,王国平,雷亚平,杨北方,辛明华,李亚兵,
采用热红外和可见光图像无损测定棉花苗期叶面积
陈家乐1,吴沣槭2,韩迎春1,李小飞1,王占彪1,2,冯 璐1,2,王国平1,雷亚平1,杨北方1,辛明华1,李亚兵1,2※
(1. 中国农业科学院棉花研究所棉花生物学国家重点实验室,安阳 455000;2. 郑州大学农学院棉花生物学国家重点实验室郑州科研中心,郑州 450000)
叶面积是影响植物光合作用、蒸腾作用、呼吸作用及产量形成的重要形态指标之一,为实现作物叶面积准确、稳定和无损化测量,该研究基于红外线成像设备,提供了一种利用热红外和可见光图像测定棉花叶片面积的方法。以苗期棉花作为研究对象,通过红外成像相机T660获取棉花的热红外和可见光波段的图像,分别使用GrabCut算法和Hough圆检测提取红外图像中叶片和可见光图像中已知实际面积的圆状参照物(五角硬币)的像素面积,进而根据叶片区域和圆状参照物区域的像素倍数关系计算棉花的真实叶面积,将通过该研究所提方法计算的叶面积结果与传统的剪纸称重法、Image Pro Plus软件图像法进行皮尔逊相关性分析,检验该方法的可行性。分析表明,基于所提方法的测量值与剪纸称重法、Image Pro Plus软件图像法的结果之间均存在显著的线性相关关系(<0.01)(相关系数分别为0.992,0.996)。3种方法对5盆棉花进行8次测量,结果显示,该研究所提方法测量值的平均变异系数为0.78%,在测量工作中表现稳定,为快速获取棉花苗期叶面积提供了一种准确稳健的理论方法。
叶面积;棉花;热红外图像;GrabCut;Hough圆检测
0 引 言
叶片是植物进行光合作用、蒸腾作用和有机物质合成的主要器官[1],其面积决定着作物吸收太阳辐射能进行光合作用的能力[2]。无损、准确、快速地分割植物叶片并提取其面积、周长等几何参数值,不仅能为研究植物的光合效率等生理机制提供数据支撑[3];还可以为监测病虫害、栽培管理提供重要指导意义[4]。
传统的叶面积测量方法主要有网格法[5]、剪纸称重法[6]、叶面积仪法[7]、系数法[8]等,而网格法与剪纸称重法易在描绘边缘时出现较多人为因素导致的误差。叶面积仪测定虽然操作简便、结果准确,但多为进口仪器,测量结果受扫描速度影响大,且不适合过长、过宽的叶面积测量[9]。系数法则是根据叶片的简单测量值建立数学模型来预测叶面积,对不规则型叶片处理结果较差,且校正系数因植物类型、品种等因素而异[10]。随着数码照相技术和图像处理软件的不断改进,利用像素点进行叶面积测定的数字摄影图像得到了迅速的发展[11-12],并广泛应用于玉米[13]、棉花[14]等农作物及经济林[15]的叶面积测量。王忠芝等[16]使用改进的Hough算法对摄取的畸变图像作几何校正后计算叶面积,但是每次只能测量一片叶子,工作量大。李震等[17]以Matlab软件为工具建模,对数字图像进行解析以求解叶面积,结果准确性高,但采用的叶片种类少、叶片间差异小,其算法仍有待完善。Wang等[18]通过灰度变换、阈值分割、形态学操作和二值图像识别计算得到相应的叶面积,虽然精度高,但破坏了植物的完整性。
此外,前述方法中采用的图像均为可见光波段的图像,在进行图像叶片提取时会有诸多干扰,如作物叶片会随时空而呈现浅绿、深绿、黄等颜色[19],疾病感染也会影响叶片颜色[20],作物茎也具有和叶相似的可见光波段等[21],从而难以实现目标区域的快速有效识别。另外,逐片测量叶面积加大了工作量,损伤测量也会给作物带来永久性破坏。
针对前人研究中存在的不足,本文提供了一种手持相机拍摄图像并计算叶面积的方法,为有效获取叶片和参照物的像素信息,采用红外线成像仪T660拍摄同一目标2种波段的图像,对可见光图像进行Hough圆检测提取参照物信息,利用调整前与调整后的热红外图像实现GrabCut算法提取叶片信息,同时将该文所提算法的测量值与剪纸称重法、Image Pro Plus图像法进行对比,以期为田间苗期的棉花叶面积测定提供一种准确、稳定、快捷、无损的测定方法。
1 材料与方法
1.1 试验材料与设计
试验所用棉花品种为鲁棉研28,于2021年7-9月在中国农业科学院棉花研究所东场试验基地温室大棚内进行种植。7月20日选取优质营养土装入塑料盆,棉花种子经双氧水浸泡2 h后点播至盆中,保证1盆1株棉苗,共15盆棉苗。待棉花出苗,真叶长至1~4片(幼苗期)时(8月25日,确保叶片在空间上不重叠),在当天14:00,土壤、叶片及阴影部分的辐射差异达到最大时,进行拍照。
1.2 测量原理
摄取图像的分辨率为640×480,每个像素点代表实际的面积值,棉花叶片所代表的实际面积值可由式(1)计算求得。
S
1
=
S
2
(
T
1
/
T
2
) (1)
式中1代表叶片面积,2代表硬币面积,1是叶片所占的像素个数,2是参照物所占的像素个数。
1.3 图像获取和调整
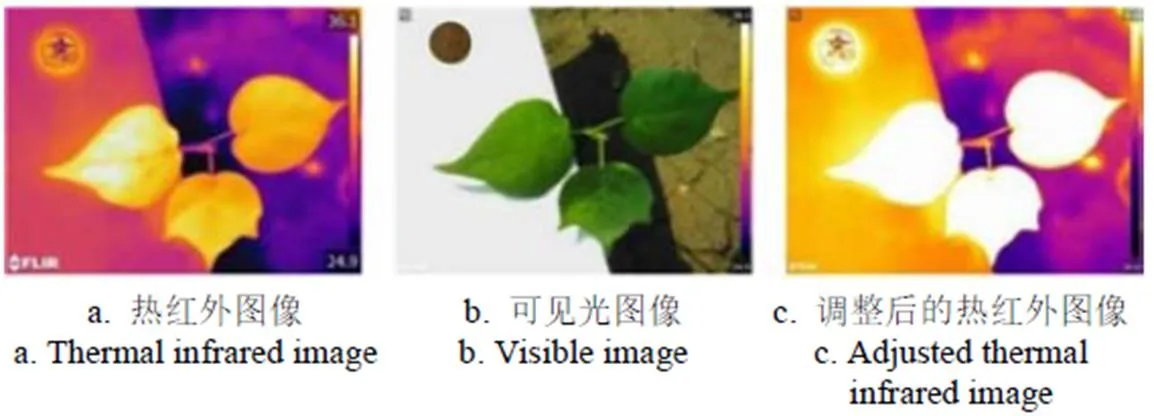
以第1盆棉花第1次拍摄的图片为例,对图像获取及处理的方法和步骤进行说明。利用相机采集的棉花叶片的图像如图1所示。
手持标准板与所托起的叶片在温度上差异不大,在热红外图像图1a中,二者的差异相较于叶片与土壤不明显,因此需要进行调整。使用FLIR tools软件打开图1a,调整温度标尺的上下限,使得位于标准板区域的叶片与标准板表现出较大的差异,叶片与茎也呈现出明显区别。因此调整前图像(图1a)在分割前景叶片与背景土壤时效果更佳,调整后图像(图1c)在分割前景叶片与背景标准板时效果更佳,二者在后续图像处理中需要结合使用,图1b用于进行Hough圆检测提取参照物。
1.4 检测参照物区域
Hough圆检测获取图像中圆的信息,该方法由于受曲线间断的影响较小,能有效得到圆的特征信息,因此广泛应用于很多领域[23]。对可见光图像图1b进行Hough圆检测获取五角硬币像素信息。在进行Hough圆检测之前,为提高检测的准确度,需要对原图像进行灰度化处理来消除干扰。首先将图1b转化为灰度图像,由于要对硬币区域做分析,所以在本步骤中除硬币外所有物体都视为背景。
注:左上角五角硬币是参照物。
图像在计算机中以矩阵形式存储,首先创建一个高为480,宽为640的像素值均为0(黑色)的单通道矩阵掩膜(mask),将其在对应可见光图像中硬币位置的像素值改为255(白色)生成图像图2a,之后将图2a与可见光图像图1b的灰度图进行基于像素点的函数计算。bitwise_and函数对2个像素值进行运算。运算机制如下:2张图像相对应位置中只要有1个像素值为0,则返回像素值0,仅当像素值同时不为0时,返回得到图1b灰度图中硬币位置的像素信息。通过该运算得到仅含硬币区域的图像图2b。
对图2b进行Hough圆检测获取硬币轮廓信息,该检测对噪声比较敏感,首先需要对图像进行中值平滑,以达到降噪的目的。将检测得到的圆的信息绘制在一个等大黑色图像上,该图像是一个二值图像,基于此图像,通过轮廓提取和面积测量函数得到填充的硬币图像图2c,同时计算得到硬币所占据的像素个数。
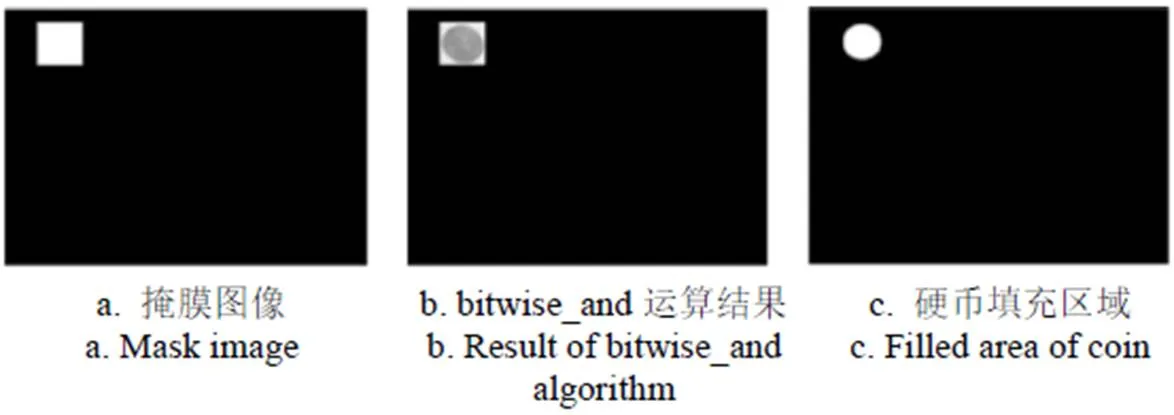
图2 参照物区域提取
1.5 检测叶片区域
目前常用图像分割技术有5类[24-25]:基于阈值、边缘、区域生长、能量泛函分割和图论等。Graph Cuts是一种用户参与的,基于用户提供的先验信息的交互式图像分割算法[26]。以Graph Cuts为基础提出的针对彩色图像分割的GrabCut[27],弥补了Graph Cuts在分割彩色图像上的不足,仅需输入矩形框选取前景和背景,通过非完全标记方法对前景和背景颜色空间建立高斯混合模型(Gaussian Mixture Model, GMM),在能量函数最小化的问题上使用多次迭代的GMM参数学习取代Graph Cuts中的一次最小估计。这种交互式GrabCut分割已被证明具有很大的普适性[28]和较高的可塑性[29]。
将图1a经过Grabcut算法分割后的叶片信息显示在一张黑色三通道图像上,如图3a所示。图3a中,棉花叶片像素与土壤像素相邻处分割效果(黄色和黑色)相较于叶片与标准板处的分割效果更明显(黄色和橙色)。而图1c经过GrabCut算法得到的图3b,则在叶片与标准板相接区域表现出良好的分割效果。图3a和3b单一进行叶片分割都会产生较大的误差,因此需要合并使用进行分割。
将图3a和图3b转为灰度图,图3a在b,g,r三通道中的g通道区分度较好,图3b在b通道的区分度较好。经过通道分离,分别得到图3c和图3d。将图3c和图3d进行图像相加操作,其实质是为2个图像对应位置的每个像素值分配权重后求和。使用addWeighted函数,削弱图3c中叶片与标准板区域区分度差的不良影响,通过运算得到叶片的信息见图3e。
综上所述,为改善焦虑症患者病情,在临床救治工作中以脑电生物反馈疗法开展救治,可大大提升临床治疗效果,可在临床推荐应用。
通过Otsu阈值分割法对图3e进行二值化,得到叶片区域像素值为255,背景区域像素值为0的二值图。如图3f所示。
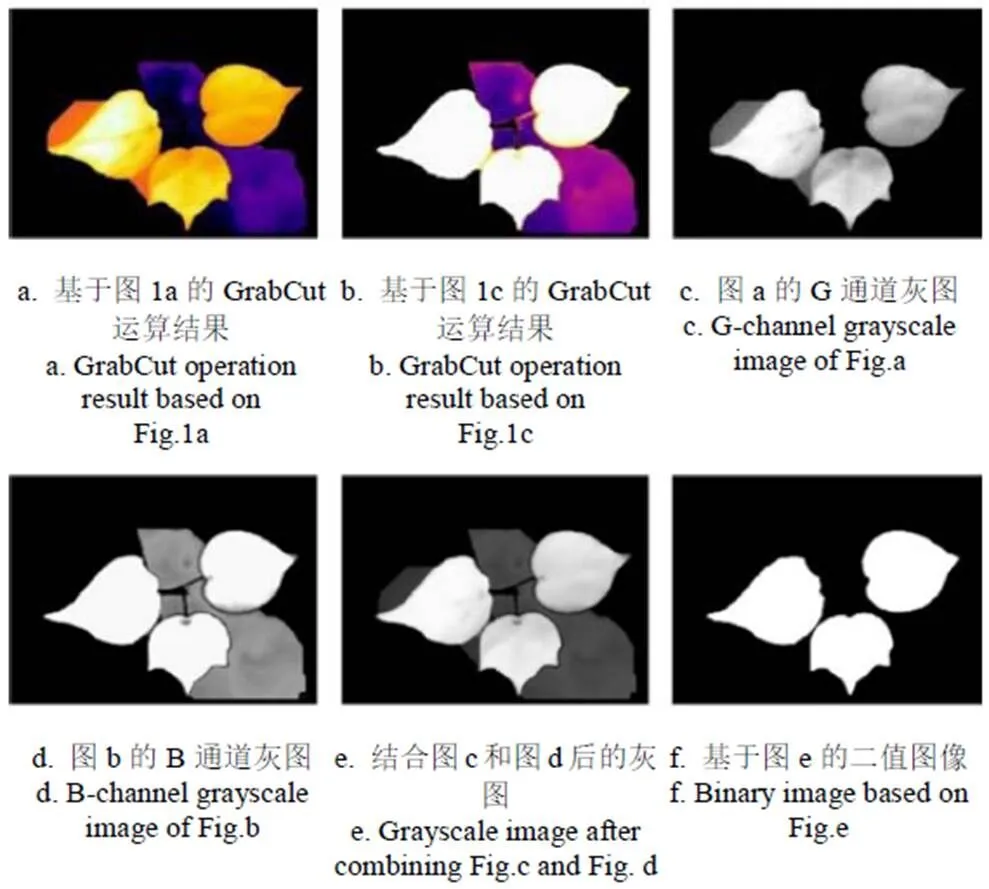
图3 棉花叶片区域提取
1.6 噪声消除
为了避免噪声对叶面积计算的影响,需要对二值图像进行噪声消除,噪声在二值图像中表现为极小的孤立像素点或者较小的连通区域。连通性基于像素点的邻接性,是一种区域概念[30]。李震等[17]通过多次腐蚀二值图像得到仅含有叶片像素主体位置信息的图像,将主体位置看作叶片的生长区域,反向识别腐蚀前二值图中的叶片,并计算面积。
在该研究所提方法中,通过使用skimage库函数对图3f的所有连通区域进行彩色填充,并返回所有连通区域的数目。如果返回的连通区域数目等于叶片数量,则表明在二值图像图3f中不存在噪声,可以直接对图3f进行轮廓提取计算面积;如果返回的连通区域数目大于叶片数目,则需要先根据叶片连通区域的颜色(特定颜色代表特定像素值)选择性提取叶片区域,消除其他噪声区域,再进行叶面积计算。本算法中的连通区域使用4连通区域进行判定。
当连通区域数量大于叶片数量时,假设图3f的连通区域数量大于叶片数量,图4a是图3f经过彩色填充后的图像,蓝色叶片像素值为[0,0,1]、红色叶片像素值为[1,0,0]、青色叶片像素值为[0,1,1]。图4a是一张三通道图像,首先根据像素信息将叶片全部改为白色[1,1,1],其次将图像中非白色区域全部变为黑色得到三通道二值图像图4b,这样图3f中孤立的噪声区域全变为黑色,只有叶片区域的像素值为[1,1,1]。最后对图4b进行通道分离操作,得到单通道图像图4c。

图4 叶片标识及噪声消除
1.7 计算叶片像素值
彩色填充连通区域并返回连通区域数量,如果返回值等于叶片数量,则直接对图3f进行轮廓提取,如果大于叶片数量,则须先根据1.6小节所述步骤进行叶片标识和噪声消除操作得到图4c后,再进行轮廓提取。
以图3f为例,使用OpenCV库的轮廓提取和测量函数对二值图像(图3f)进行外轮廓提取并返回轮廓内的像素数量(图5)。
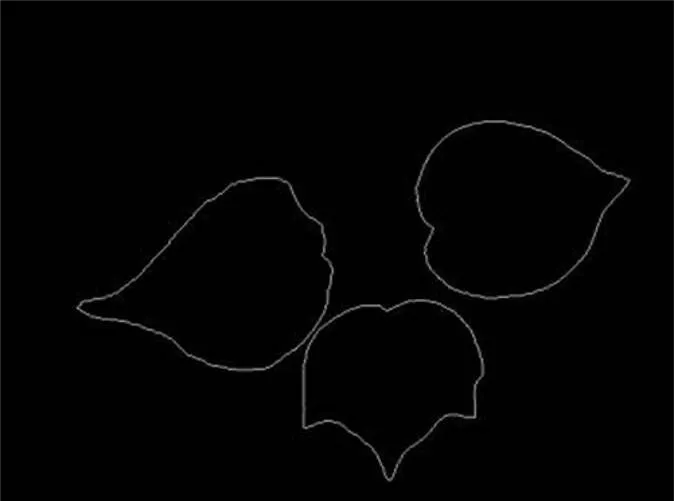
图5 叶片轮廓
1.8 图像和数据处理工具
采用Python 3.7进行图像分割和叶片标识,使用SPSS 23对本研究所提方法,剪纸称重法和Image Pro Plus图像法的测量值进行相关分析并检验相关系数显著性,使用Origin 2021对3种方法的测量值进行回归分析并绘图。
2 结果与分析
2.1 图像法测量的准确性
为了验证本算法在叶面积测量中的准确性,将本文方法计算结果与剪纸称重法,Image Pro Plus图像法进行比较。剪纸时,将叶片平铺在A4纸上,用透明胶带将叶片按压并粘牢固定,所选A4纸(21 cm×29.7 cm)面积为623.7 cm2,质量为70 g。本试验选用的圆形参照物是中国2012年首发的荷花五角硬币,直径为20.5 mm,剪纸称重法使用精度为0.001 g的电子天平(ME203)。利用Image Pro Plus图像法计算叶片面积时,为避免叶片弯曲使用胶带将叶片按压粘牢在白色底板上,通过底板上方的固定扫描仪(Phantom 9800xl, MICROTEK,上海,中国)获取图片并利用软件Image Pro Plus分析,结果如图6所示(叶片来自于前一章节举例所用的苗期棉花)。

注:1,2,3为叶片编号。
经该研究所提方法得到的硬币和叶片的像素面积见表1(仅列举了5盆棉花第1次拍摄的图像),由二者间倍数关系可计算叶片的实际面积。本文所提方法与称重法,Image Pro Plus图像法的计算结果见表2(5盆棉花,每盆测量8次)。

表1 参照物和叶片像素数量
由表2可知,3种方法测量的叶面积值存在以下规律:称重法测量值>本文方法测量值>Image Pro Plus图像法测量值。在使用3种方法对5盆棉花进行8次测量后,数据显示,本文方法测量的结果与称重法、Image Pro Plus图像法所测结果之间均存在极显著的线性相关关系(<0.01)(相关系数分别为0.992和0.996)。3种方法测量结果的回归分析如图7所示。由图7可知,3种方法测量值之间的拟合度较高(2=0.984,RMSE=0.973,2=0.992,RMSE=0.723)。另外,由表2得知,在每盆棉花中,本文所提方法与称重法和Image Pro Plus图像法所测值相差为0.06%~6.73%。综上可知,本算法准确性高,可以用于实际叶面积的测量。

表2 3种方法对5盆棉苗叶面积测量统计结果
注:IPP表示Image Pro Plus;形如“64.48±0.48”的数据结构表示“均值±标准差”;CV表示变异系数。
Note: IPP means Image Pro Plus; data structure like “64.48±0.48” represents “Mean ± Standard deviation”; CV indicates the coefficient of variation.
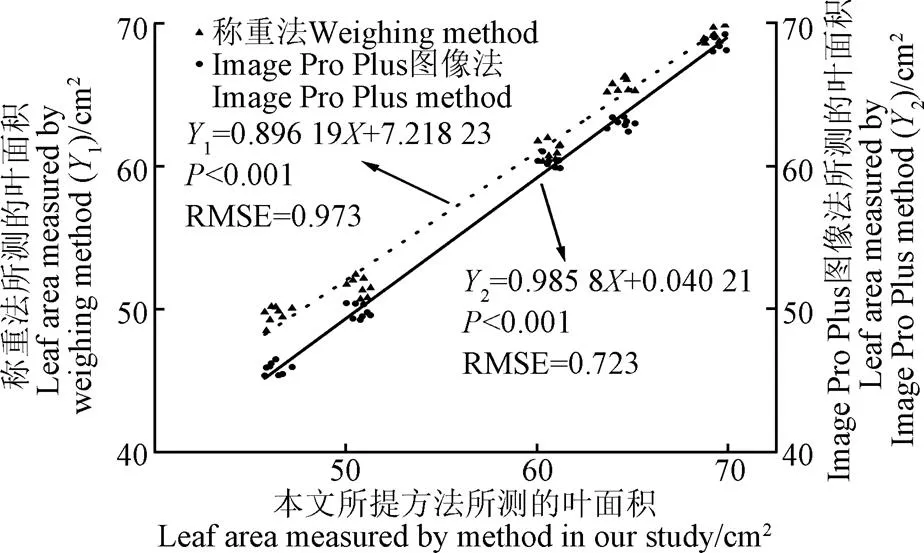
图7 5盆棉花经3种方法多次测量所得的叶面积之间的回归分析
2.2 图像法测量的稳定性
为了验证本文所提方法测量叶面积的稳定性,5盆棉苗均采用3种方法进行了8次测量(表2)。可知,多次测量的平均变异系数分别为:0.74%(Image Pro Plus图像法)<0.78%(本文方法)<1.02%(称重法),称重法数据波动最大,Image Pro Plus图像法与本文方法波动程度相当。由此可知,本研究中图像算法在多次测定叶面积方面具备较高的稳定性。
3 讨 论
在根据植物各部位及其与土壤辐射差异这一特性拍摄红外波段图像,早已有了较为普遍和成熟的研究。叶面积指数(LAI)能够反映作物健康和生产力状况[31],王传宇等[32]通过时间序列红外图像连续监测叶面积指数,为田间环境下冠层参数的自动连续监测提供了解决方案。张智韬等[33]基于当前无人机热红外遥感诊断作物水分胁迫精度不足的问题,提出使用基于热红外图像的冠层温度标准差(CTSD)来诊断作物水分胁迫。杨文攀等[34]基于无人机热红外监测玉米冠层温度,对玉米抗旱情况进行监测。前人研究中,更多的是把热红外图像携带的温度数据加以提取,并结合其他田间参数(如土壤湿度、株高等)进行研究。然而,少有研究挖掘热红外图像在更小尺度上用作测量工具的潜力,本研究结合热红外和可见光图像,将其应用到植株尺度的叶面积测量上,同时保证测量结果的准确性、稳定性和对植株的无损性,克服了以往的叶面积测量方法的不足。
然而,拍摄环境(空气、光线等)的变化、红外线成像仪仪器内部参数的改变等对红外图像产生干扰,因此本文所提方法的准确性仍有提升空间。此外,生育后期的叶片重叠是自然界中普遍存在的客观现象,这种由叶片遮挡引入的偏差可通过建立表征株型的图像特征、表征各器官对叶面积影响的图像纹理特征、多角度热红外和可见光图像的投影面积与真实叶面积之间的模型来削弱[35]。以上问题可在未来研究中进一步探讨。
4 结 论
本研究针对现有叶面积测量方法的不足,结合热红外和可见光图像,分别采用GrabCut和Hough圆检测提取叶片和参照物的像素信息进行叶面积计算。
本文方法与剪纸称重法、Image Pro Plus图像法相比,所测叶面积值之间均存在显著的线性相关关系(<0.01)(相关系数分别为0.992,0.996),在整株叶面积统计结果上,本文所提方法与称重法和Image Pro Plus图像法测量结果均相差5%左右。另外,应用本文所提方法测量的结果稳定性高(平均变异系数0.78%)。而且,红外相机携带方便,实际操作要远比需要取样的称重法和Image Pro Plus图像法简便,并且能够保证不损伤棉花叶片。综上所述,本研究为棉花叶面积的准确、稳定和无损测量提供了一种可靠方法,也为热红外图像在小尺度测量工作中的应用奠定了良好基础。
[1] 郭向阳,陈建军,卫晓轶,等. 氮胁迫与非胁迫条件下玉米叶形相关形状的QTL分析[J]. 植物营养与肥料学报,2019,25(11):1929-1938.
Guo Xiangyang, Chen Jianjun, Wei Xiaoyi, et al. QTL mapping of leaf related traits of maize with or without nitrogen stress[J]. Journal of Plant Nutrition and Fertilizers, 2019, 25(11): 1929-1938. (in Chinese with English abstract)
[2] 王全九,王康,苏李君,等. 灌溉施氮和种植密度对棉花叶面积指数与产量的影响[J]. 农业机械学报,2021,52(12):300-312.
Wang Quanjiu, Wang Kang, Su Lijun, et al. Effect of irrigation amount, nitrogen application rate and planting density on cotton leaf area index and yield[J]. Transactions of the Chinese Society for Agricultural Machinery, 2021, 52(12): 300-312. (in Chinese with English abstract)
[3] 苏宝峰,刘易雪,王琮,等. 基于三维点云的叶面积估算方法[J]. 农业机械学报,2019,50(12):240-246,254.
Su Baofeng, Liu Yixue, Wang Cong, et al. Leaf area estimation method based on three-dimensional point cloud[J]. Transactions of the Chinese Society for Agricultural Machinery, 2019, 50(12): 240-246, 254. (in Chinese with English abstract)
[4] 吴千华,孟祥丽,刘一鸣. 植物叶面积测定方法探讨[J].热带林业,2018,46(2):37-39.
Wu Qianghua, Meng Xiangli, Liu Yiming. Discussion about the methods of measuring leaf area of plants[J]. Tropical Forestry, 2018, 46(2): 37-39. (in Chinese with English abstract)
[5] 柳觐,倪书邦,宫丽丹,等. 澳洲坚果叶面积测定方法比较[J]. 中国农学通报,2014,30(25):142-147.
Liu Jian, Ni Shubang, Gong Lidan, et al. Comparison of leaf area determination methods of macadamia spp[J]. Chinese Agricultural Science Bulletin, 2014, 30(25): 142-147. (in Chinese with English abstract)
[6] 李治中,谢菲,刘小梅,等. 2种常用叶面积测量方法准确性的比较研究[J]. 中国农学通报,2013,29(19):193-197.
Li Zhizhong, Xie Fei, Liu Xiaomei, et al. A comparative study on the accuracy of two commonly used methods of leaf area measurement[J]. Chinese Agricultural Science Bulletin, 2013, 29(19): 193-197. (in Chinese with English abstract)
[7] 陈涛涛,迟道才,梁茜. 基于矩形框几何校正的多叶面积测量方法[J]. 农业工程学报,2012,28(8):206-213.
Chen Taotao, Chi Daocai, Liang Qian. Multi-leaf area measurement method based on geometric correction with rectangular box[J]. Transactions of the Chinese Society of Agricultural Engineering (Transactions of the CSAE), 2012, 28(8): 206-213. (in Chinese with English abstract)
[8] 胡林. 植物叶面积系数法改进研究[J]. 中国农学通报,2015,31(5):228-233.
Hu Lin. Research on adjusted coefficient method for leaf area measurement and its error[J]. Chinese Agricultural Science Bulletin, 2015, 31(5): 228-233. (in Chinese with English abstract)
[9] 徐义鑫,李凤菊,王建春,等. 基于OpenCV的Android手机植物叶片几何参数测量系统[J]. 中国农学通报,2015,31(35):236-244.
Xu Yixin, Li Fengju, Wang Jianchun, et al. Open CV-based measurement system for leaf geometry parameters using android mobile phone[J]. Chinese Agricultural Science Bulletin2015, 31(35): 236-244. (in Chinese with English abstract)
[10] 唐力为,李倩,蒋云,等. 藜麦叶面积校正系数的初步研究[J]. 四川农业科技,2021 (9):65-67.
[11] 李方一,黄璜,官春云. 作物叶面积测量的研究进展[J].湖南农业大学学报(自然科学版),2021,47(3):274-282.
Li Fangyi, Huang Huang, Guan Chunyun. Review on measurement of crop leaf area[J]Journal of Hunan Agricultural University (Natural Sciences), 2021, 47(3): 274-282. (in Chinese with English abstract)
[12] 韩殿元,黄心渊,付慧. 基于彩色通道相似性图像分割方法的植物叶面积计算[J]. 农业工程学报,2012,28(6):179-183.
Han Dianyuan, Huang Xinyuan, Fu Hui. Measurement of plant leaf area based on image segmentation of color channel similarity[J]. Transactions of the Chinese Society of Agricultural Engineering (Transactions of the CSAE), 2012, 28(6): 179-183. (in Chinese with English abstract)
[13] 付豪,万鹏,施家伟,等. 基于机器视觉的玉米幼苗叶面积检测装置设计及试验[J]. 华中农业大学学报,2020,39(1):161-170.
Fu Hao, Wan Peng, Shi Jiawei, et al. Design and test of non-destructive detecting device for corn seedling leaf area based on machine vision[J]. Journal of Huazhong Agricultural University, 2020, 39(1): 161-170. (in Chinese with English abstract)
[14] Chen H X, Zhao X X, Han Y C, et al. Competition for light interception in cotton populations of different densities[J]. Agronomy, 2021, 11(1): 176.
[15] 张沛健,尚秀华,吴志华. 基于图像处理技术的5种红树林叶片形态特征及叶绿素相对含量的估测[J]. 热带作物学报,2020,41(3):496-503.
Zhang Peijian, Shang Xiuhua, Wu Zhihua. Morphological characteristics of leaves and estimation of relative chlorophyll content in five species of mangrove based on image processing technology[J]. Chinese Journal of Tropical Crops, 2020, 41(3): 496-503. (in Chinese with English abstract)
[16] 王忠芝,张金瑞. 基于图像处理的叶面积测量方法[J]. 微计算机应用,2010,31(5):68-72.
Wang Zhongzhi, Zhang Jinrui. A measurement approach of leaf area based on digital image processing[J]. Network New Media Technology, 2010, 31(5): 68-72. (in Chinese with English abstract)
[17] 李震,洪添胜,吴伟斌,等. 植物多叶片图像目标识别和叶面积测量方法[J]. 华南农业大学学报,2007(3):105-109.
Li Zhen, Hong Tiansheng, Wu Weibin, et al. Method of object identification and leaf area calculation in multi-leaf scanned image[J]. Journal of South China Agricultural University, 2007(3): 105-109. (in Chinese with English abstract)
[18] Wang S N, Bao L J, Chen B H. Study on estimation method of plant leaf area based on image processing technology[J]. International Journal of Frontiers in Sociology, 2020, 2(9): 76-84.
[19] Zhang Y H, Tang L, Liu X J, et al. Modeling dynamics of leaf color based on RGB value in rice[J]. Journal of Integrative Agriculture, 2014, 13(4): 749-759.
[20] Aparna S, Aarthi R. Segmentation of tomato plant leaf[J]. Progress in Intelligent Computing Techniques: Theory, Practice and Applications, 2018, 1(518): 149-156.
[21] Al-Shakarji N M, Kassim Y M, Palaniappan K. Unsupervised learning method for plant and leaf segmentation[C]// Washington, DC, USA: 2017 IEEE Applied Imagery Pattern Recognition Workshop (AIPR), IEEE, 2017.
[22] 冯璐,邢芳芳,杨北方,等. 基于红外热成像的棉花叶片温度分布量化方法研究[J]. 棉花学报,2020,32(6):569-576.
Feng Lu, Xing Fangfang, Yang Beifang, et al. The quantitative method for temperature distribution of cotton leaves based on infrared thermal image[J]. Cotton Science, 2020, 32(6): 569-576. (in Chinese with English abstract)
[23] Thumu S R. Analysis and cDNA microarray image segmentation based on Hough circle transform[J]. International Journal of Recent Technology and Engineering (IJRTE), 2019, 7(5c): 53-55.
[24] 陈英,郑铖,易珍,等. 肝脏及肿瘤图像分割方法综述[J].计算机应用研究,2022,39(3):641-650.
Chen Ying, Zheng Cheng, Yi Zhen, et al. Review of liver and tumor image segmentation methods[J]. Application Research of Computers, 2022, 39(3): 641-650. (in Chinese with English abstract)
[25] 姜枫,顾庆,郝慧珍,等. 基于内容的图像分割方法综述[J]. 软件学报,2017,28(1):160-183.
Jiang Feng, Gu Qing, Hao Huizhen, et al. Survey on content-based image segmentation methods[J]. Journal of Software, 2017, 28(1): 160-183. (in Chinese with English abstract)
[26] 金海燕,彭晶,周挺,等. 基于Graph Cuts多特征选择的双目图像分割方法[J]. 计算机科学,2021,48(8):150-156.
Jin Haiyan, Peng Jing, Zhou Ting, et al. Binocular image segmentation based on Graph Cuts muti-feature selection[J]. Computer Science, 2021, 48(8): 150-156. (in Chinese with English abstract)
[27] Rother C, Kolmogorov V, Blake A. “GrabCut”: Interactive foreground extraction using iterated graph cuts[J]. ACM Transactions on Graphics, 2004, 23(3): 309-314.
[28] Sun S H, Jiang M, He D J, et al. Recognition of green apples in an orchard environment by combining the GrabCut model and Ncut algorithm[J]. Biosystems Engineering, 2019, 187: 201-213.
[29] Zhang S W, Huang W Z, Wang Z L. Combing modified Grabcut, K-means clustering and sparse representation classification for weed recognition in wheat field[J]. Neurocomputing, 2021, 452: 665-674.
[30] 黄晨,刘泽,罗禹贡,等. 基于背景光照去除和连通区域的车位检测[J]. 汽车工程,2020,42(1):47-51,73.
Huang Chen, Liu Ze, Luo Yugong, et al. Parking space detection based on background illumination removal and connected region[J]. Automotive Engineering, 2020, 42(1): 47-51, 73. (in Chinese with English abstract)
[31] Huang J X, Tian L Y, Liang S L, et al. Improving winter wheat yield estimation by assimilation of the leaf area index from Landsat TM and MODIS data into the WOFOST model[J].Agricultural and Forest Meteorology, 2015, 204: 106-121.
[32] 王传宇,郭新宇,杜建军. 基于时间序列红外图像的玉米叶面积指数连续监测[J]. 农业工程学报,2018,34(6):175-181.
Wang Chuanyu, Guo Xinyu, Du Jianjun. Continuous monitoring of corn leaf area index based on time series infrared images[J]. Transactions of the Chinese Society of Agricultural Engineering (Transactions of the CSAE), 2018, 34(6): 175-181. (in Chinese with English abstract)
[33] 张智韬,边江,韩文霆,等. 无人机热红外图像计算冠层温度特征数诊断棉花水分胁迫[J]. 农业工程学报,2018,34(15):77-84.
Zhang Zhitao, Bian Jiang, Han Wenting, et al. Cotton moisture stress diagnosis based on canopy temperature characteristics calculated from UAV thermal infrared image[J]. Transactions of the Chinese Society of Agricultural Engineering (Transactions of the CSAE), 2018, 34(15): 77-84. (in Chinese with English abstract)
[34] 杨文攀,李长春,杨浩,等. 基于无人机热红外与数码影像的玉米冠层温度监测[J]. 农业工程学报,2018,34(17):68-75,301.
Yang Wenpan, Li Changchun, Yang Hao, et al. Monitoring of canopy temperature of maize based on UAV thermal infrared imagery and digital imagery[J]. Transactions of the Chinese Society of Agricultural Engineering (Transactions of the CSAE), 2018, 34(17): 68-75, 301. (in Chinese with English abstract)
[35] 蒋霓. 单株水稻绿叶面积无损测量方法研究[D]. 武汉:华中科技大学,2014.
Jiang Ni. A Non-Destructive Method for Total Green Leaf Area Estimation of Individual Rice Plants[D]. Wuhan: Huazhong University of Science and Technology, 2014. (in Chinese with English abstract)
Nondestructive measurement of cotton leaf area at the seedling stage based on thermal infrared and visible images
Chen Jiale1, Wu Fengqi2, Han Yingchun1, Li Xiaofei1, Wang Zhanbiao1,2, Feng Lu1,2, Wang Guoping1, Lei Yaping1, Yang Beifang1, Xin Minghua1, Li Yabing1,2※
(1.,,455000,; 2.,,,,450000,)
A leaf area has been one of the most important indicators of photosynthesis, transpiration, respiration, and yield components of plants. The physiological and ecological indicators can dominate plant growth, fruit development, and quality formation. The purpose of this study is to measure the leaf area of cotton by the thermal infrared and visible images. An accurate, convenient, stable, and nondestructive approach was also proposed for the early leaf area measurement in physiological and ecological research. The experimental cotton was cultivated in the greenhouse of the East Field Experimental Base of Cotton Research Institute, Chinese Academy of Agricultural Sciences from July to September 2021 (On July 20th, the cotton seeds were soaked in the hydrogen peroxide for two hours, and then sown in the pots, one cotton seedling per pot, totally 15 pots). When the cotton was in the seedling stage (August 25th, the number of euphylla was 1-4), the infrared imager T660 was used to take photos at 14:00 pm, where the radiation difference among soil, leaf and shadow reached the outstanding effect. Five pots of cotton seedlings were randomly selected to capture the images. Both thermal infrared and visible images were obtained eight from each pot. Taken together, 16 images were obtained from each cotton pot. A hand-held standard board with a circular reference was used to hold the inclined leaves in each capture, in order to reduce the distortion of cotton leaves in the image. Hough circle detection was used to extract the region of reference substance in the visible image. The GrabCut was used to extract the leaf regions in the thermal infrared image. The capture and thermal infrared images were firstly adjusted by the FLIR tools. After that, the pixel values of leaf regions of the two images were assigned the weights and then superimposed. The color filling was carried out using a 4-connected field, in order to eliminate the isolated pixels near the leaf regions. The pixel value of the leaf area was defined after the color filled the connected area. The leaf regions were converted into white (pixel value is [1, 1, 1]), whereas, the rest was converted into black ([0, 0, 0]), according to the pixel values of the leaves. The following step was to convert the 3-channel image with the leaf information into a single-channel image. Then, the contour was extracted from the reference substance and the leaf regions. The leaf area was then calculated, according to the multiple relationships of the number of the pixels. The study-cutting weighing and Image Pro Plus image were used to measure the five pots of cotton seedlings for eight times after capture. The correlation analysis showed that there was a significant linear correlation (>0.99,<0.01). The difference between the method proposed in this paper, weighing, and Image Pro Plus method are all in the 0.06%-6.73% range. Additionally, the higher stability of the measurement was achieved, where the average coefficient of variation was 0.78%. Therefore, an accurate, stable, rapid, and nondestructive method can provide a promising convenience for physiological and ecological research in the early leaf area measurement.
leaf area; cotton; thermal infrared image; GrabCut; Hough circle detection
10.11975/j.issn.1002-6819.2022.15.019
S126
A
1002-6819(2022)-15-0179-07
陈家乐,吴沣槭,韩迎春,等. 采用热红外和可见光图像无损测定棉花苗期叶面积[J]. 农业工程学报,2022,38(15):179-185.doi:10.11975/j.issn.1002-6819.2022.15.019 http://www.tcsae.org
Chen Jiale, Wu Fengqi, Han Yingchun, et al. Nondestructive measurement of cotton leaf area at the seedling stage based on thermal infrared and visible images[J]. Transactions of the Chinese Society of Agricultural Engineering (Transactions of the CSAE), 2022, 38(15): 179-185. (in Chinese with English abstract) doi:10.11975/j.issn.1002-6819.2022.15.019 http://www.tcsae.org
2021-09-18
2022-03-07
国家自然科学基金资助项目(No.31601264)
陈家乐,研究方向为作物栽培理论与技术。Email:grachenjiale@163.com
李亚兵,博士,博士生导师,研究方向为作物栽培理论与技术。Email:criliyabing@163.com
猜你喜欢
少儿科学周刊·儿童版(2022年10期)2022-06-27
环球时报(2022-05-23)2022-05-23
湖南农业大学学报(自然科学版)(2021年3期)2021-07-02
金桥(2021年4期)2021-05-21
小读者(2020年4期)2020-06-16
新疆农业科学(2020年1期)2020-02-14
电子制作(2019年7期)2019-04-25
光学精密工程(2016年3期)2016-11-07
中国麻业科学(2015年5期)2015-12-28
小天使·一年级语数英综合(2014年7期)2014-06-26