
Overweight and abdominal fat are associated with normal bone mineral density in patients with ulcerative colitis
2022-11-30 06:10MirellaBrasilLopesAndreCastroLyraRaquelRochaFernandaGomesCoqueiroCarlaAndradeLimaCarolinaCunhadeOliveiraGenoileOliveiraSantana
Mirella Brasil Lopes,Andre Castro Lyra,Raquel Rocha, Fernanda Gomes Coqueiro, Carla Andrade Lima,Carolina Cunha de Oliveira, Genoile Oliveira Santana
Abstract
BACKGROUND
Low bone mineral density (BMD) is common in patients with inflammatory bowel disease. However, nutritional risk factors for low BMD in the ulcerative colitis(UC) population are still poorly understood.
AIM
To investigate the association of anthropometric indicators and body composition with BMD in patients with UC.
METHODS
This is a cross-sectional study on adult UC patients of both genders who were followed on an outpatient basis. A control group consisting of healthy volunteers,family members, and close people was also included. The nutritional indicators evaluated were body mass index (BMI), total body mass (TBM), waist circumference (WC), body fat in kg (BFkg), body fat in percentage (BF%), trunk BF (TBF),and also lean mass. Body composition and BMD assessments were performed by dual-energy X-ray absorptiometry.
RESULTS
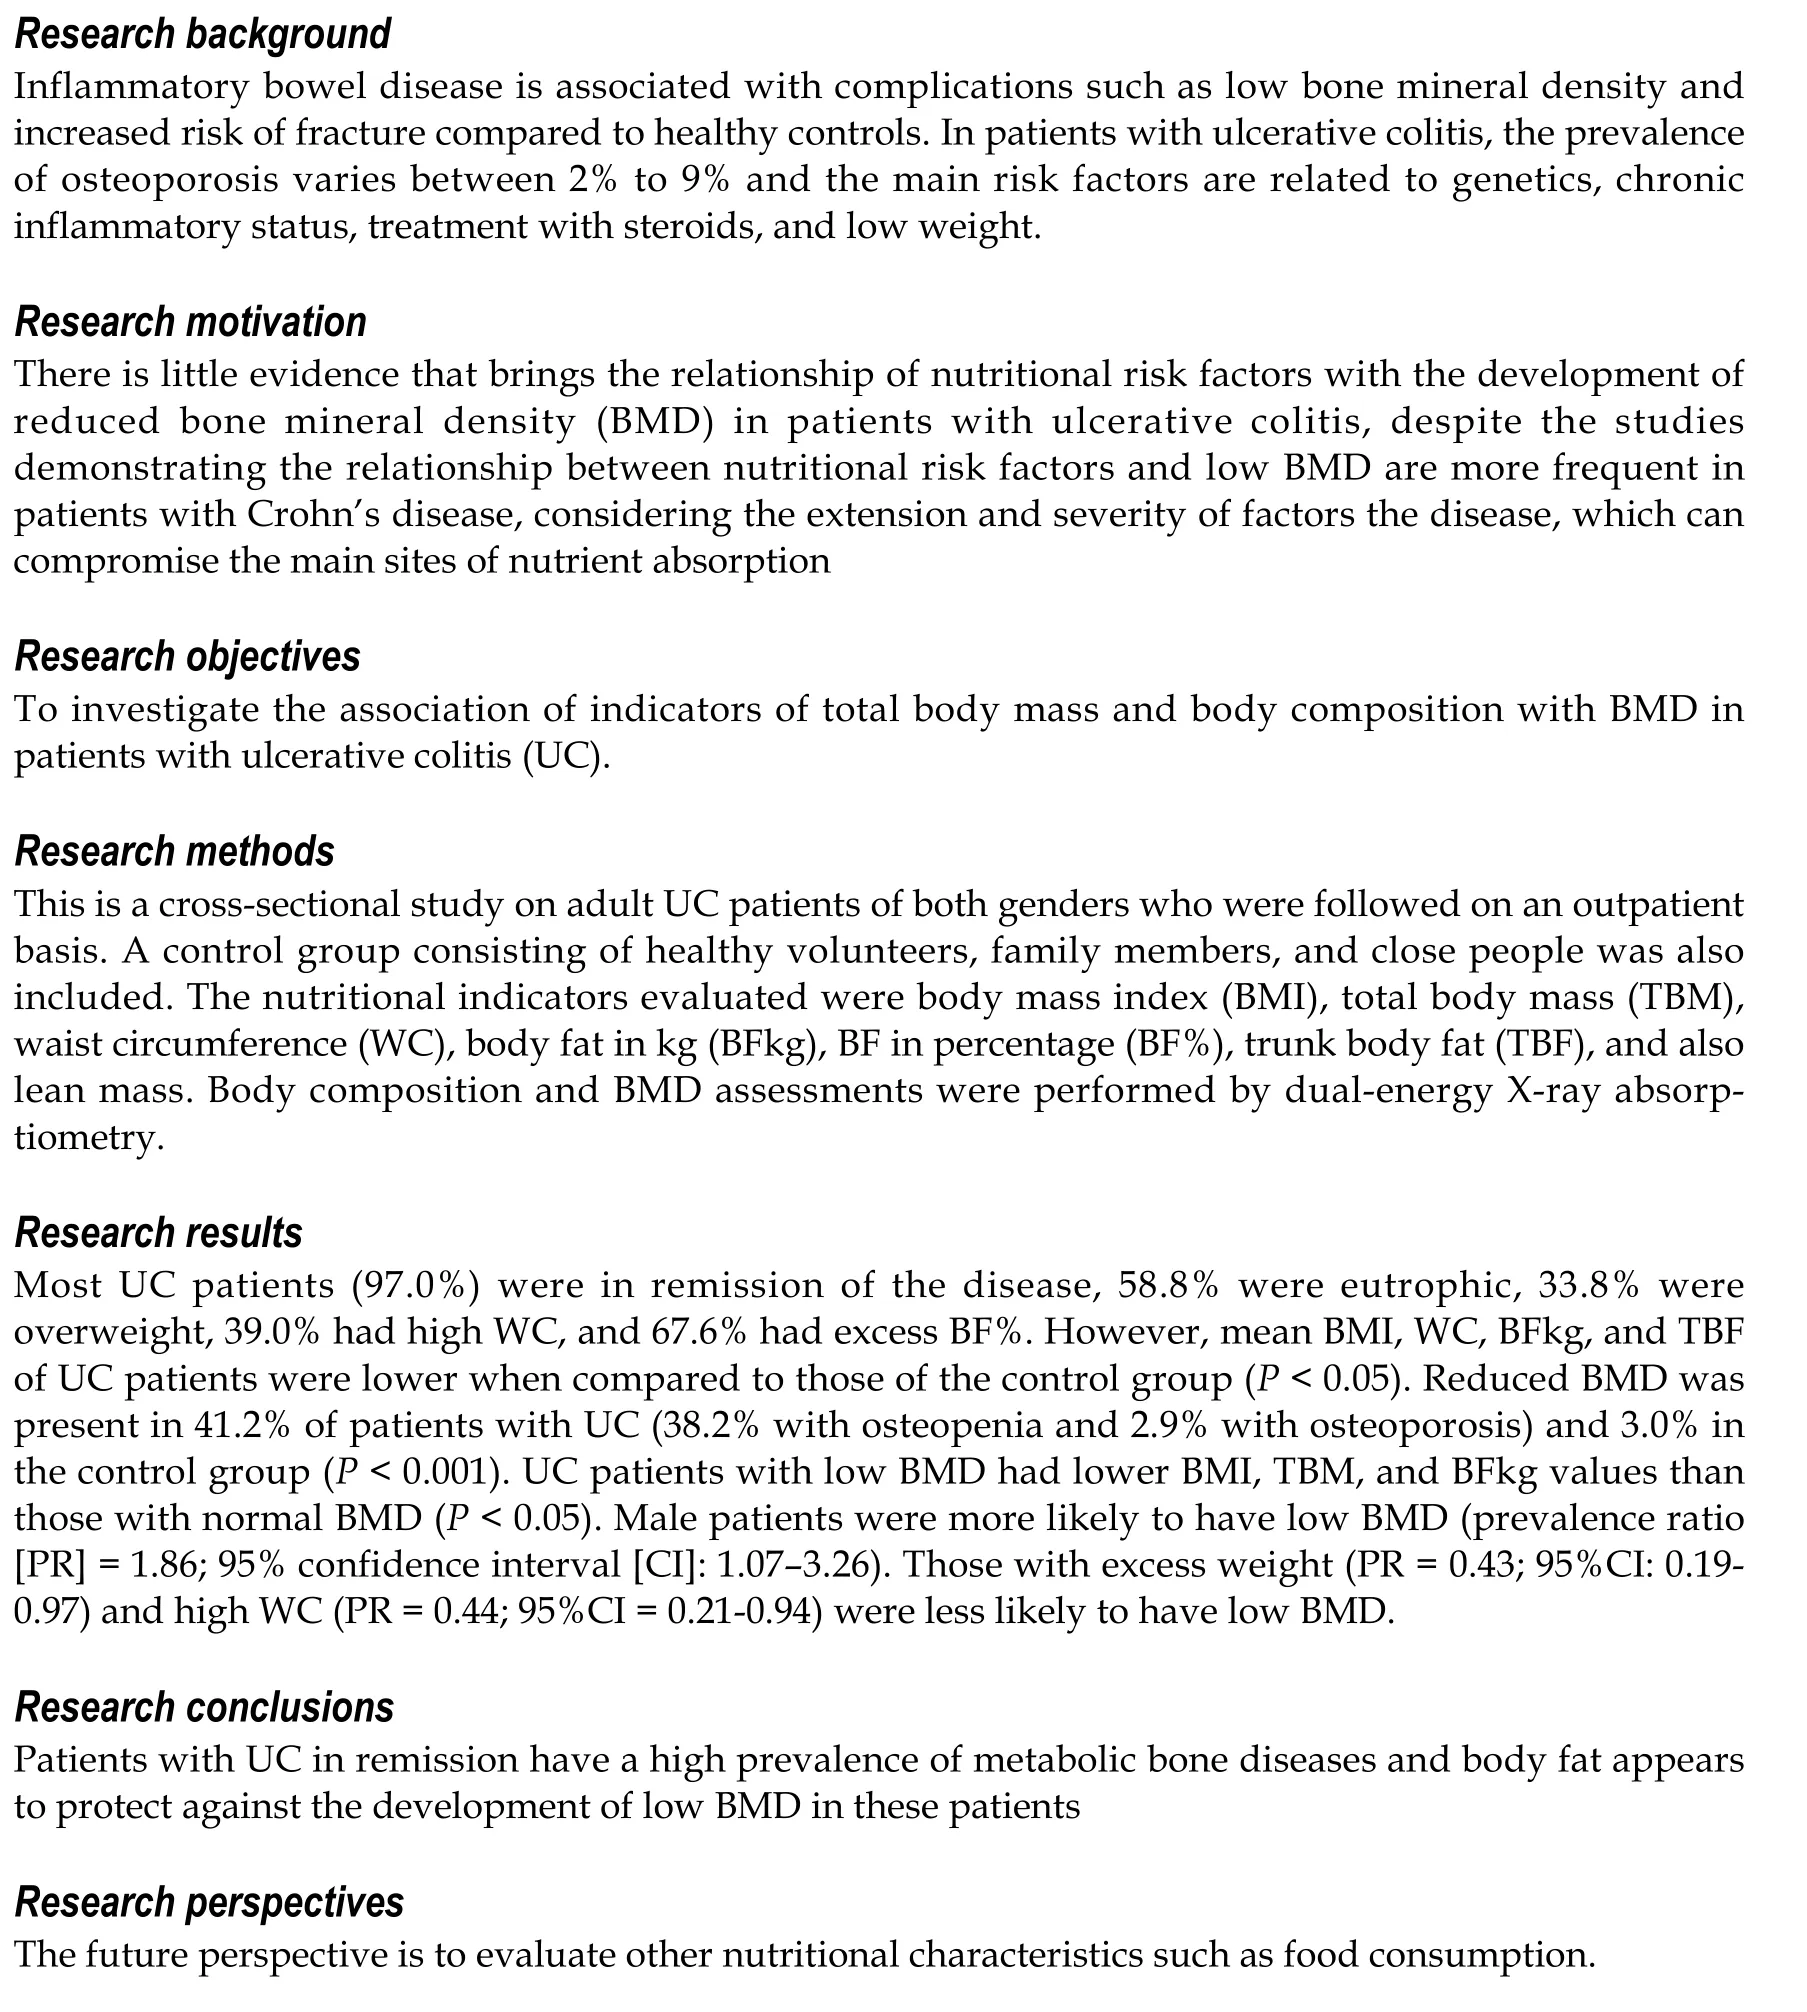
The sociodemographic characteristics of patients with UC (n = 68) were similar to those of healthy volunteers (n = 66) (P > 0.05). Most patients (97.0%) were in remission of the disease, 58.8% were eutrophic, 33.8% were overweight, 39.0% had high WC, and 67.6% had excess BF%. However,mean BMI, WC, BFkg, and TBF of UC patients were lower when compared to those of the control group (P < 0.05). Reduced BMD was present in 41.2% of patients with UC (38.2% with osteopenia and 2.9% with osteoporosis) and 3.0% in the control group (P < 0.001). UC patients with low BMD had lower BMI, TBM, and BFkg values than those with normal BMD (P < 0.05). Male patients were more likely to have low BMD (prevalence ratio [PR] = 1.86; 95% confidence interval [CI]: 1.07-3.26).Those with excess weight (PR = 0.43; 95%CI: 0.19-0.97) and high WC (PR = 0.44; 95%CI: 0.21-0.94)were less likely to have low BMD.
CONCLUSION
Patients with UC in remission have a high prevalence of metabolic bone diseases. Body fat appears to protect against the development of low BMD in these patients.
Key Words: Ulcerative colitis; Bone mineral density; Body composition; Fat body; Abdominal fat
INTRODUCTION
Low bone mineral density (BMD) is often seen in patients with inflammatory bowel disease (IBD)[1,2].Patients with Crohn's disease and ulcerative colitis (UC), the main types of IBD, are at increased risk of fracture compared to healthy controls, with an osteoporotic fracture risk around 32%[3-6]. In patients with UC, the prevalence of osteoporosis varies between 2% to 9%[7].
The cause of osteoporosis in patients with IBD is multifactorial. Most studies involving patients with UC demonstrate that the main risk factors for this disease are related to genetics, chronic inflammatory status, treatment with steroids, and low weight[8-10].
Nutritional status appears to influence the BMD of patients with IBD. The inflammatory process and complications of the disease in the active phase can lead to compromised nutritional status, with reduced body mass and muscle mass reserves and micronutrient deficiency, and consequently to low BMD and increased risk of osteoporotic fractures[11,12]. Although the increased prevalence of overweight/obesity is evident in patients with UC, studies explaining the relationship between abdominal fat and disease complications in this group of patients are limited[13].
Studies that demonstrate the relationship between nutritional risk factors and low BMD are more frequent among patients with CD considering the extension and severity of the disease, which can compromise the main sites of nutrient absorption. Thus, there is little evidence that brings the relationship of nutritional risk factors with the development of reduced BMD in patients with UC. The aim of the present study was to investigate the association of indicators of total body mass and body composition with BMD in patients with UC.
MATERIALS AND METHODS
Study design and patients
This is a cross-sectional study involving adult outpatients with UC from two reference centers.Consecutive patients with a diagnosis of UC confirmed by clinical, endoscopic, radiological, and histological criteria were included[14]. The control group consisted of healthy volunteers, family members, and close people with the same sociodemographic characteristics and lifestyle compared to the UC group. Volunteers recruited were matched for gender and age, with no history of bowel surgery or taking medications known to affect bone turnover.
Elderly people, pregnant women, patients with diseases that cause changes in bone metabolism(chronic renal failure, chronic obstructive pulmonary disease, thyroid disease, liver disease, and systemic lupus erythematosus), malignant diseases, diabetes mellitus, or celiac disease, menopausal or post-menopausal patients, and those in use of estrogen therapy were not included in the study.
Clinical data
The clinical criteria for patients with UC were activity index and disease duration, past history of intestinal resection, accumulated dose of glucocorticoids in the last year, use of glucocorticoids for 3 mo or more, extent of disease according to Montreal classification[15], and serum calcium, albumin, and C-reactive protein (CRP) levels, in addition to smoking, regular physical activity[16], and use of calcium and vitamin D supplements.
Disease activity was assessed by the Lichtiger index[17], considering activity when a score ≥ 10 points. Calcium (mmol/L) and serum albumin (g/dL) and CRP (mg/L) were collected on the same day as the BMD evaluation and performed in the same laboratory. Calcium and albumin were measured using the dry chemical method and CRP was measured by the turbidimetry method.
Anthropometric assessment and body composition
Anthropometric measurements were performed by a trained and standardized team. Height (in centimeters) and body weight (in kg) were measured in duplicate, with subjects wearing light clothing and without shoes, using a scale (Filizola, São Paulo, Brazil), 150 kg capacity and 100 g interval, with an attached stadiometer with a 0.5 cm scale. The body mass index (BMI) was obtained using the formula weight/height2and classified according to the World Health Organization[18]. For statistical analysis,two groups were considered, those with excess weight (BMI ≥ 25.0 kg/m2) and those without (BMI <25.0 kg/m2).
Waist circumference (WC) was measured with the individual in an upright position, with feet together and without shoes. The measurement was taken with an inelastic measuring tape, which circled the individual at the midpoint between the iliac crest and the last rib[18]. High WC was considered when ≥ 80 cm for women and ≥ 90 cm for men[19].
The evaluation of body composition was performed by dual-energy X-ray absorptiometry (DXA) of the total body using a Prodigy Lunar Bone Densitometer (GE Medical Systems, United States). The equipment calibration followed the manufacturer's recommendations and both the calibration and analysis were performed by a single technician with experience in this type of assessment. The values of total body fat in percentage (BF%), total body fat in kilograms (BFkg), trunk body fat in kg (TBF), and lean mass in kilograms (LBM) were obtained. The percentage of body fat (BF%) was considered high when ≥ 25% for men and ≥ 32% for women[18].
Bone mineral density assessment
BMD was determined by DXA in the whole body, lumbar spine (L1-L4), and femoral neck. Results of DMO are expressed in g/cm2and also presented as T-score or Z-score. The BMD classification was based on the T-score for men 50 years of age and older and patients with UC and the Z-score for those younger than 50 years of age for men and premenopausal women. For patients with UC, the T-score was used regardless of age, considering the possibility of secondary loss of bone mass determined by the underlying disease or by the therapies used. According to the T-score, the BMD was normal up to 1 standard deviation (SD), with osteopenia values below -1 and above -2.5 SD and with osteoporosis ≤ -2.5 SD. For the Z-score, BMD ≤ -2.0 SD was considered below the estimated for the age group (BMD reduced for age). In the osteopenia/osteoporosis classification, the bone sites of the femoral neck or lumbar spine were used[20].
Statistical analysis
Results are expressed as proportions for categorical variables, the mean and SD for continuous variables with a normal distribution, and median and interquartile range for variables without a normal distribution. Mann-Whitney test was used to compare continuous variables and the chi-square test or Fisher's exact test to compare categorical variables. Poisson regression analysis with robust variance was used to obtain estimates of the prevalence ratio and the respective 95% confidence interval (CI). For all tests, a P-value < 0.05 was considered statistically significant. The Statistical Package for Social Science program(SPSS, Chicago, IL, United States, version 21.0) was used for data tabulation and analysis.
Ethical considerations
Informed consent was obtained from all participants and the Ethics Committee of the University Hospital Professor Edgar Santos approved the study protocol (nº117/2011).
RESULTS
Clinical and nutritional characteristics
In this study, 68 patients with UC and 66 people in the control group were included. In both groups, the majority were female and demographics, lifestyle, and use of nutritional supplements were similar (P >0.05) (Table 1).
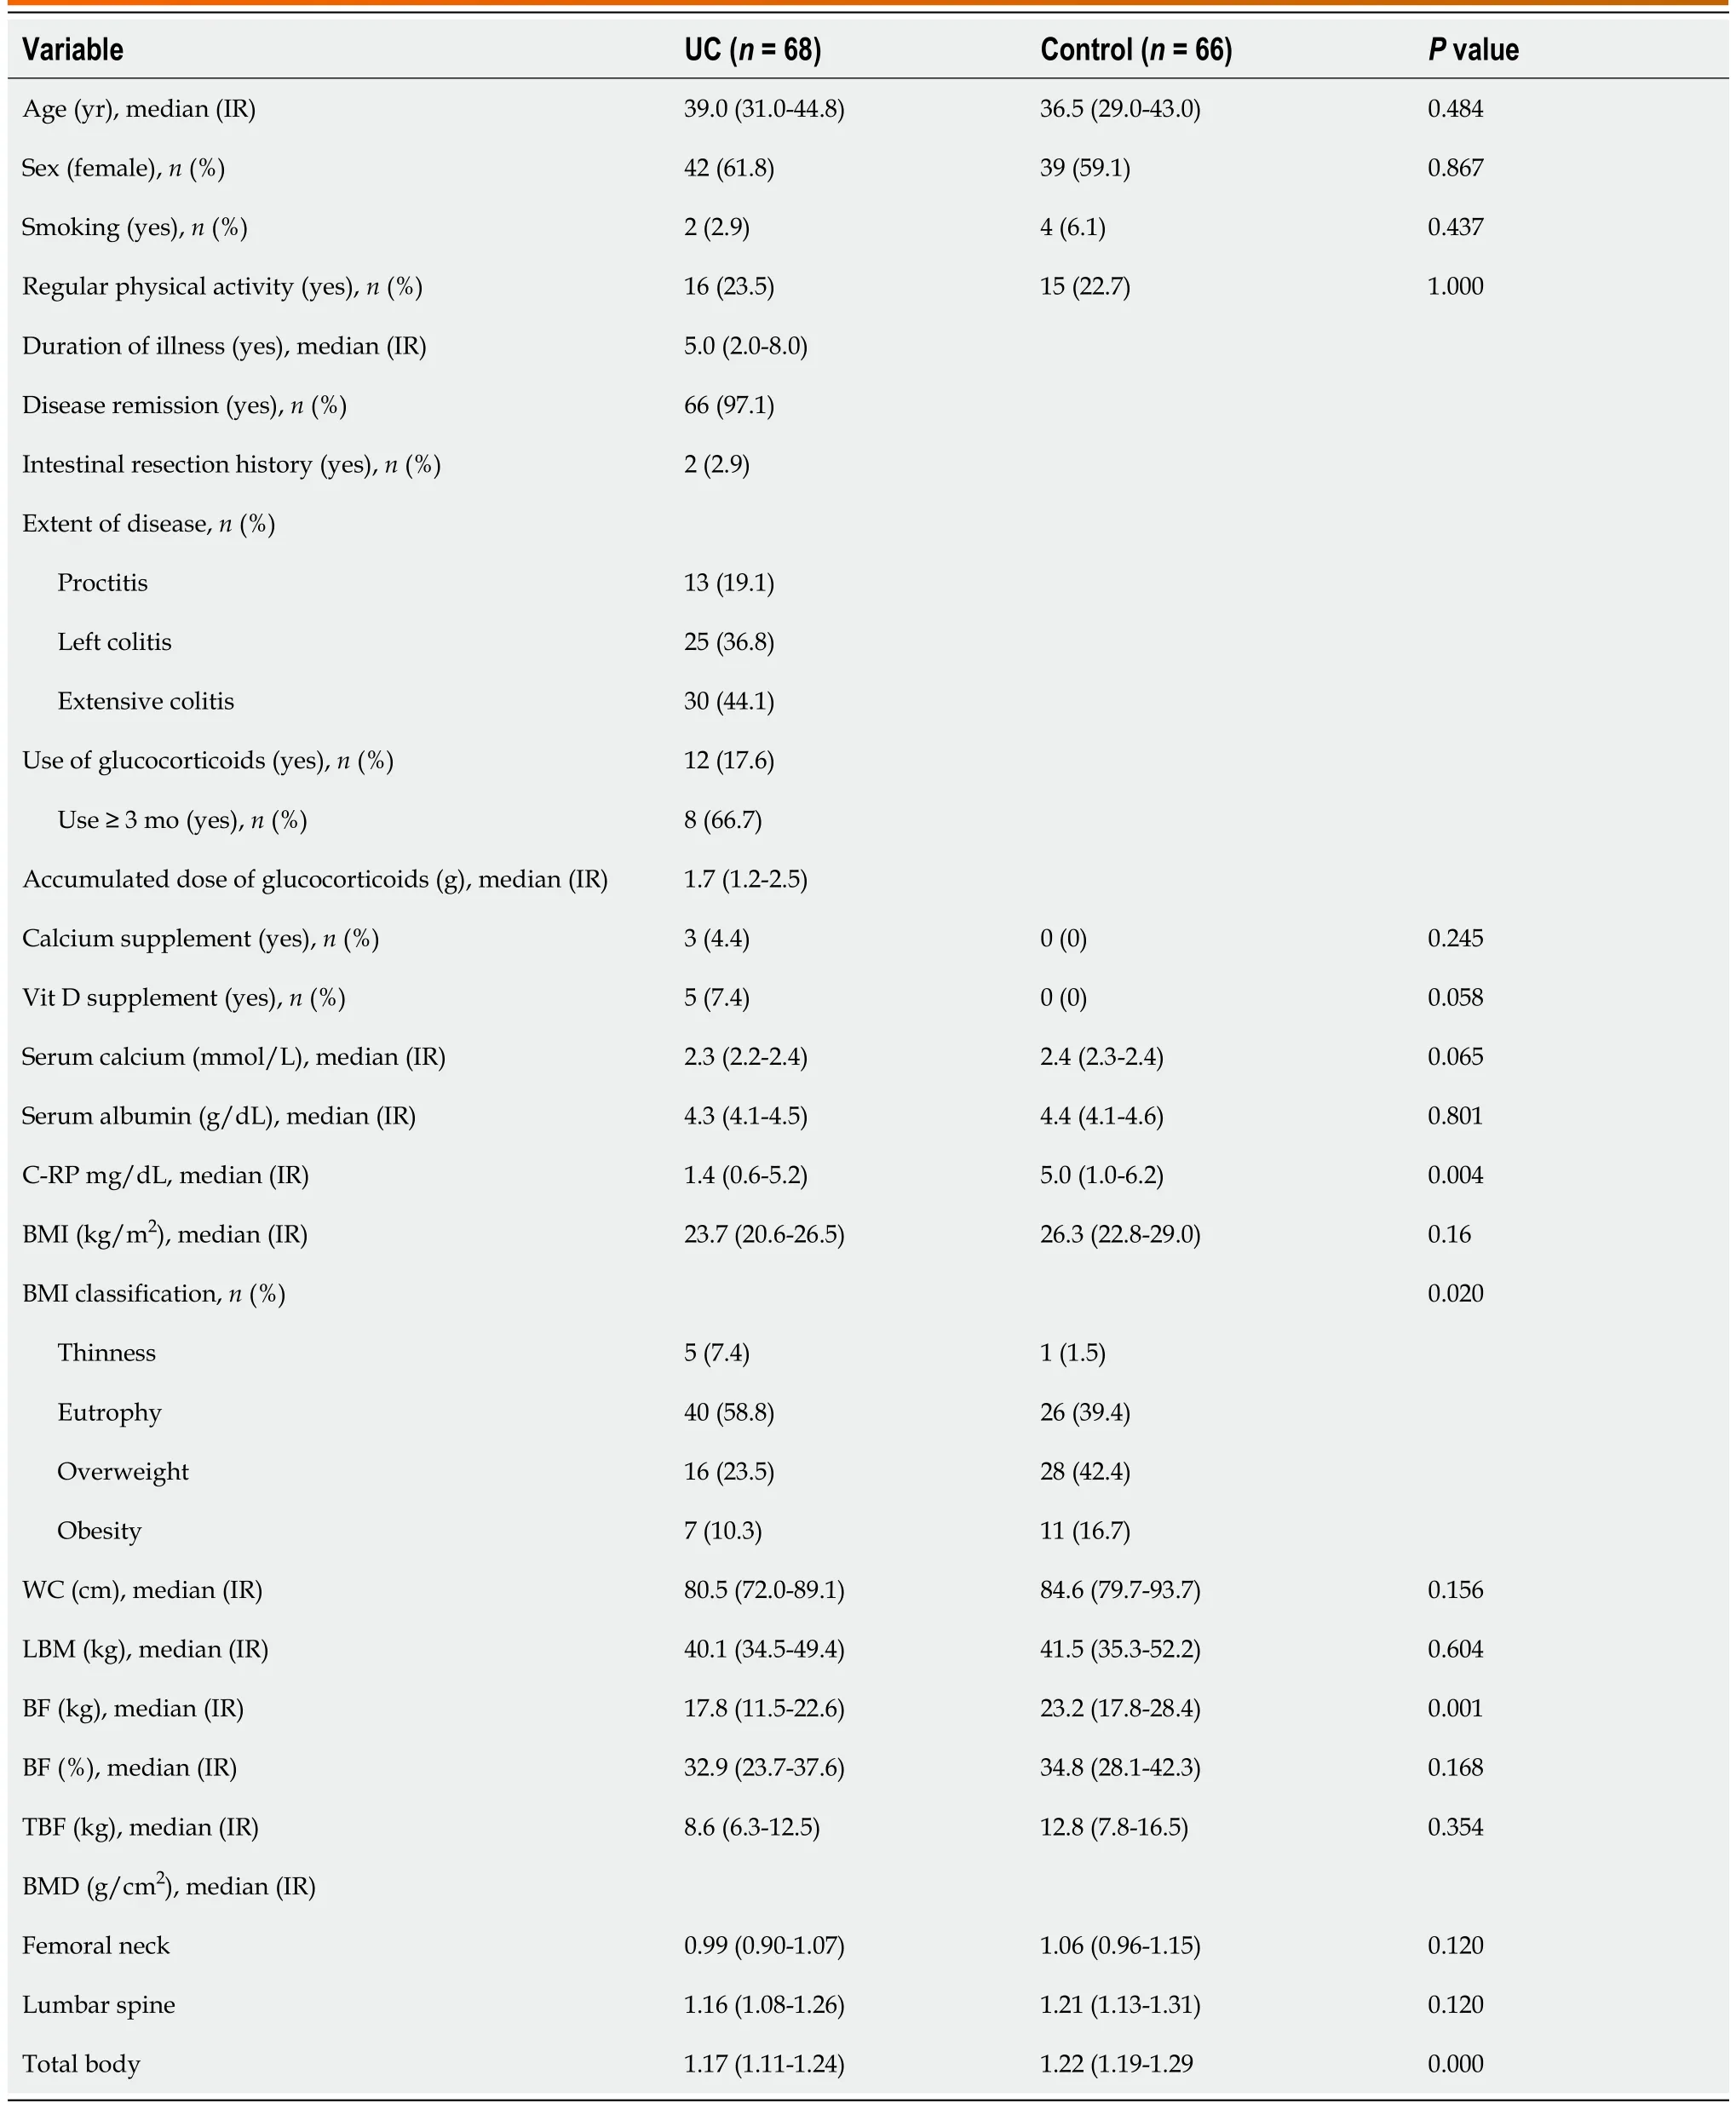
Table 1 Demographic, clinical, nutritional, and bone density characteristics of patients with ulcerative colitis
Most patients (97.0%) were in remission of the disease, only 2.9% had a previous history of intestinal resection, and extensive colitis was present in 44.1%. The use of steroids in the last year occurred in 17.6% of the patients, and of these, 66.7% used it for 3 mo or more (Table 1).
Regarding the anthropometric nutritional status, it was observed that the majority of UC patients had normal weight (58.8%); however, the frequency of overweight was high (33.8%), with six (8.8%) having grade I obesity and one (1.5%) having grade II. Women had higher BF% (37.3% vs 19.7%; P = 0.00), BFkg(22.5kg vs 12.7 kg; P = 0.00), and TBF (10.8kg vs 7.3 kg; P = 0.00) than men. BFkg and TBF of UC patients were statistically lower compared to those of the control group (P < 0.05) (Table 1).
BMD characteristics
Low BMD was present in 41.2% (n = 28) of patients with UC (38.2% with osteopenia and 2.9% with osteoporosis) and in 3.0% (n = 2) in the control group (P < 0.001). It was observed that UC patients had a 22.4 times greater chance of developing reduced BMD than healthy individuals (odds ratio = 22.4;95%CI: 5.06 – 99.19). The majority (71.4%; 20/28) of UC patients with low BMD were younger than 45 years of age. The BMD of total body in UC patients was statistically lower compared to that of the control group (P < 0.05) (Table 1).
UC patients who had low BMD were mostly male, without regular physical activity, and had left colitis compared to those with normal BMD (P < 0.05) (Table 2). Serum calcium had a lower concentration in those with low BMD, although with a clinically irrelevant difference (Table 2). Low BMD occurred equally at both sites, the spine and femur.
Individuals in the control group who had low BMD (3.0%; 2/66) had osteopenia located in the lumbar spine, and all were female and without regular physical activity.
Anthropometric indicators and body composition vs BMD
Male patients with UC were more likely to have low BMD (PR = 1.86; 95%CI: 1.07-3.26), and those with excess weight (prevalence ratio [PR] = 0.29; 95%CI: 0.13-0.66) and high WC (PR = 0.36; 95%CI = 0.17-0.75) were less likely to have low BMD (Table 3). Patients with UC with low BMD had a lower BMI value than those with normal BMD (22.8 [20.5-24.4] vs 25.6 [21.9-28.4] kg/m2; P = 0.02), TBM (58.5 [52.7-65.7] vs 67.4 [59.1-76.8] kg; P = 0.02), and BFkg (17.2 [9.9-21.3] vs 21.2 [15.4-28.4] kg; P = 0.01) (Figure 1).
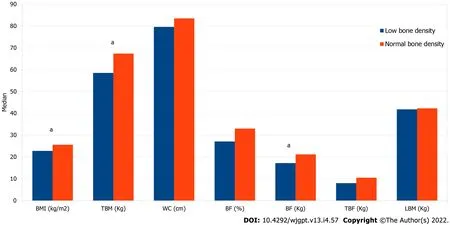
Figure 1 Anthropometry and body composition according to bone mineral density in patients with ulcerative colitis. aP < 0.05 (Mann-Whitney test). BMI: Body mass index; TBM: Total body mass; WC: Waist circumference; BF: Body fat; TBF: Trunk body fat; LBM: Lean body mass.

Table 2 Demographic and clinical characteristics according to normal and low bone mineral density of patients with ulcerative colitis
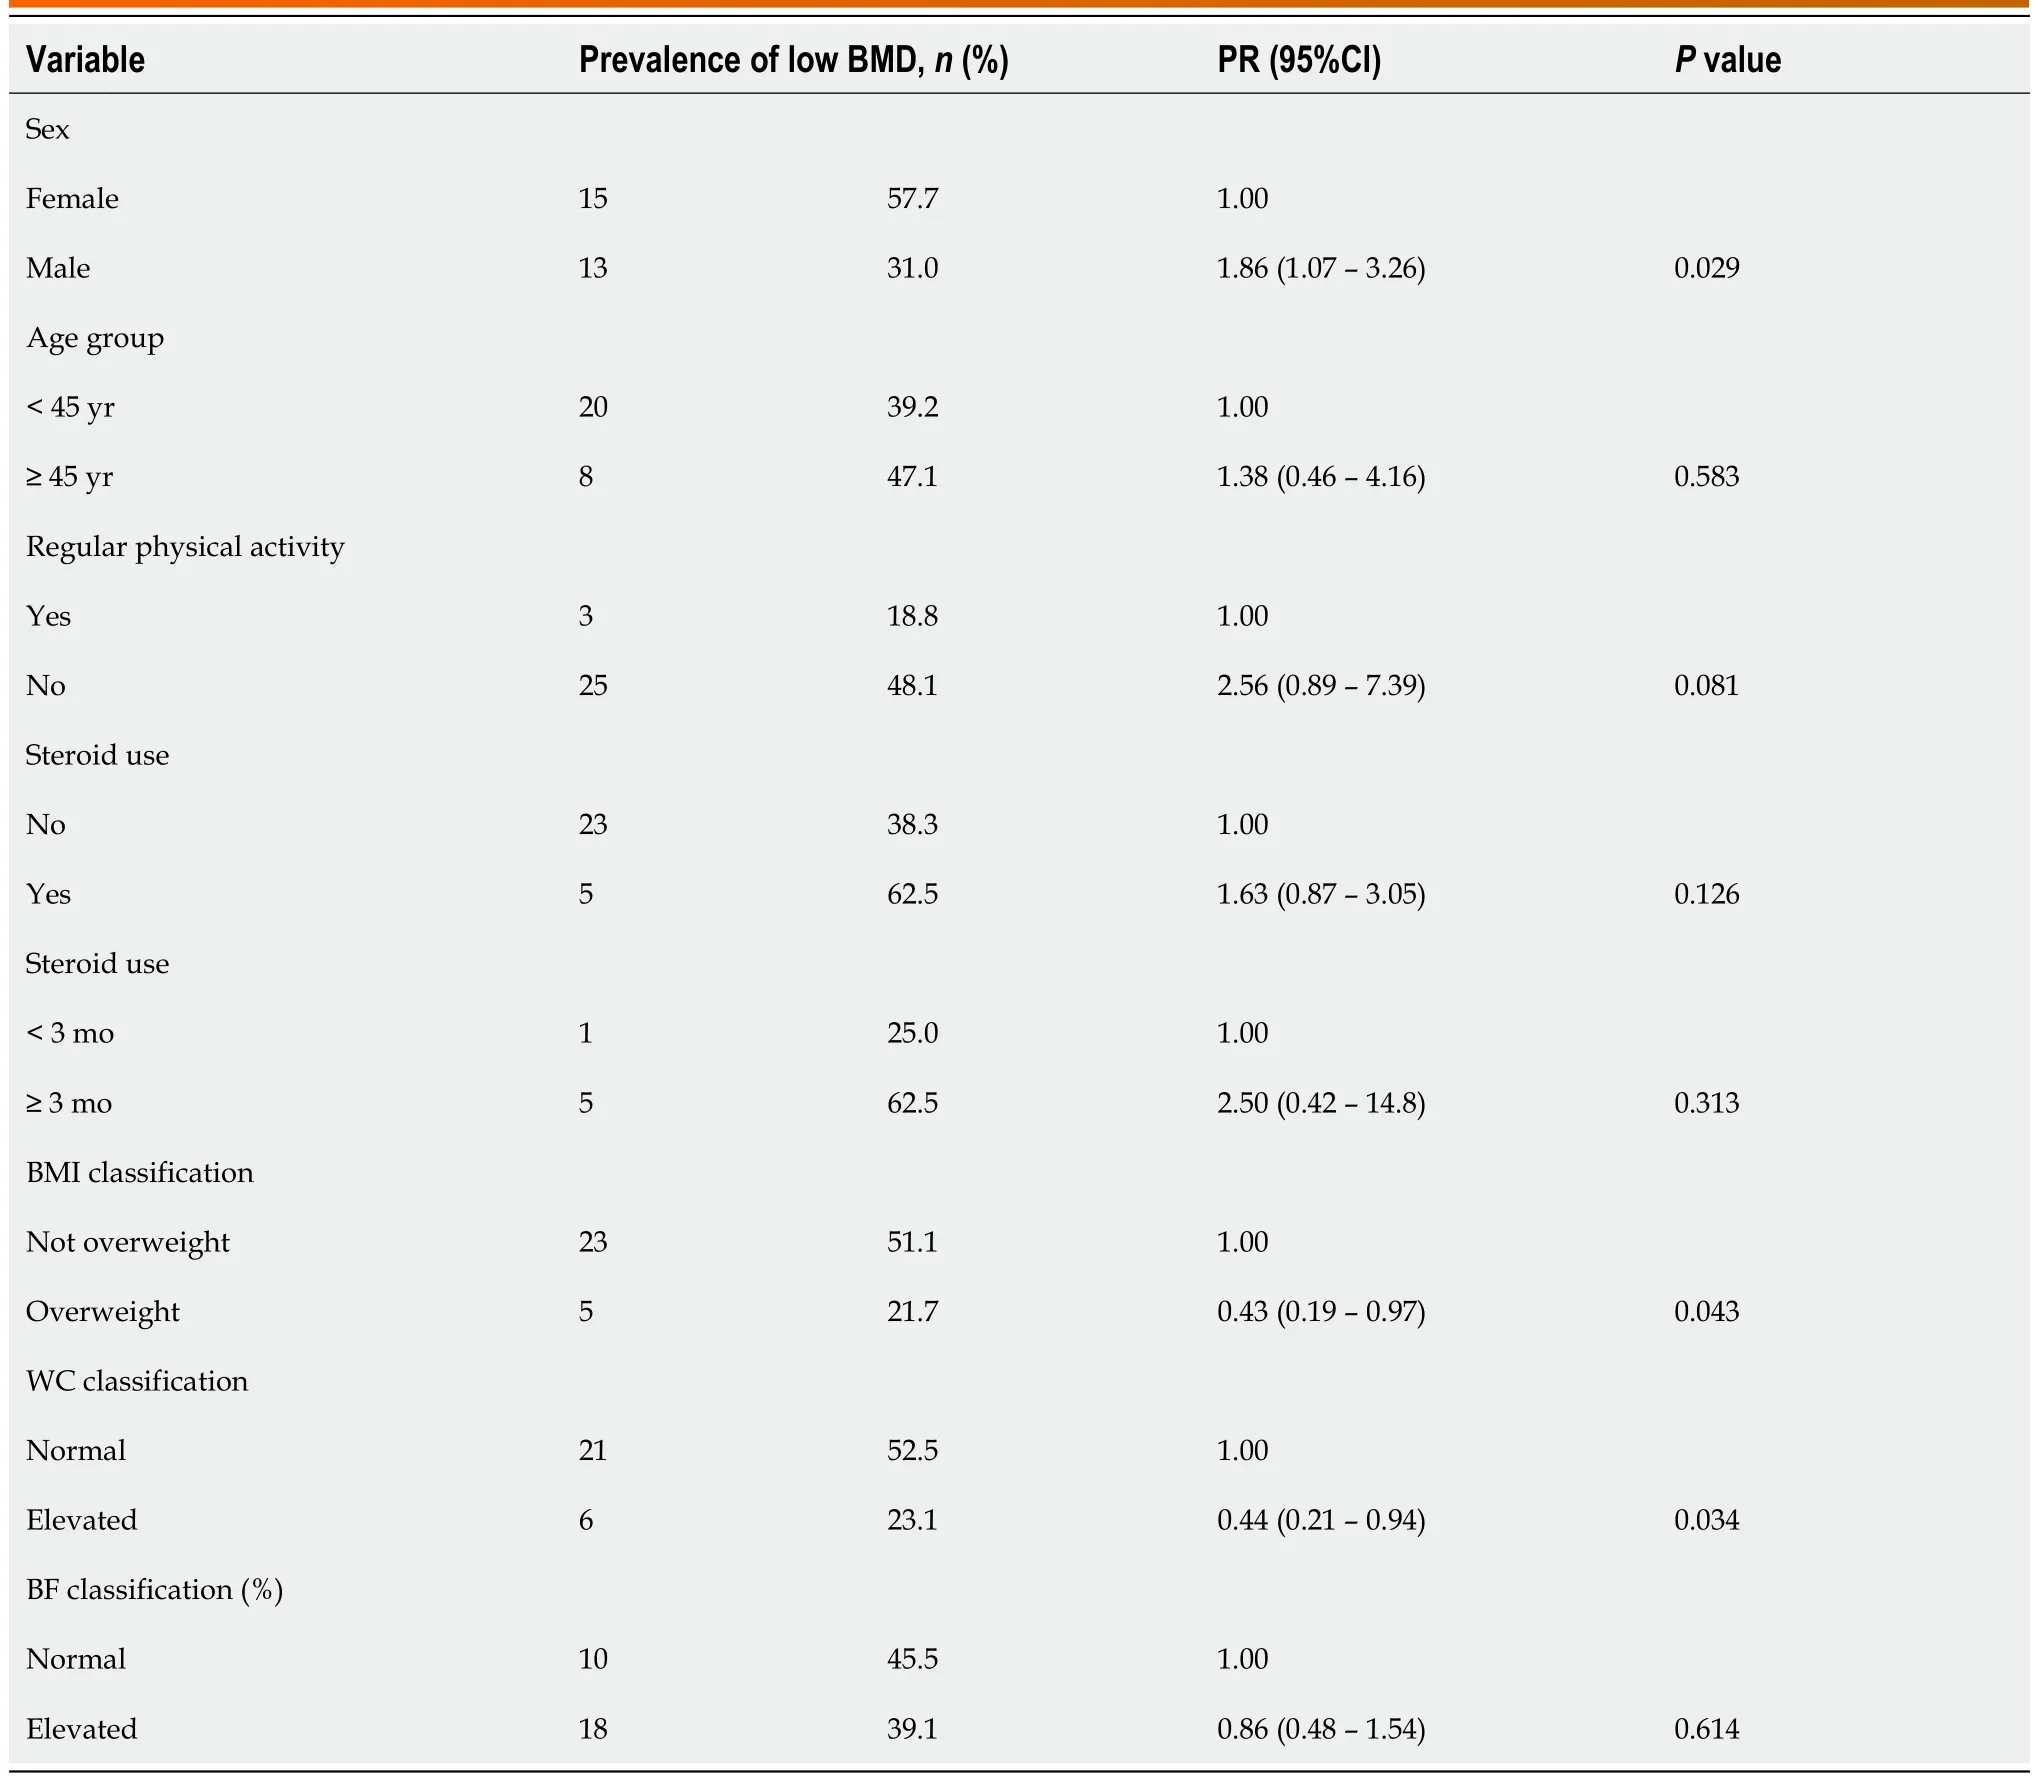
Table 3 Prevalence and prevalence ratio of low bone mineral density according to demographic, clinical, and nutritional characteristics of patients with ulcerative colitis
No significant differences were found in anthropometric nutritional characteristics or body composition between those with UC with low and normal BMD when stratified by sex.
DISCUSSION
Our data demonstrate that in a sample of patients with UC, predominantly in remission, with reduced frequency of glucocorticoid use and excess body fat, low BMD had a high prevalence, in patients under 45 years of age, being that excess weight and abdominal fat are associated with normal BMD.
It is recommended that patients with IBD be screened based on established guidelines for the general population (pre-existing fragility fracture, women aged 65 years and older and men aged 70 years and older, and those with risk factors that increase probability of detecting low bone mass)[21]. However,this is a matter of concern considering that in this sample the majority of patients with UC with reduced BMD were younger than 45 years of age, with reduced frequency of glucocorticoid use and in remission.
Bone mass loss is a frequent complication in patients with UC[22-24] and with a higher prevalence when compared to that in healthy controls[25]. Greater bone fragility increases the risk of fractures, and consequently morbidity and reduced quality of life for patients. The mechanisms reported in the literature associated with bone loss in UC patients are mainly related to the UC itself, the use of steroids,hospitalization[25-27], and low BMI values[28-31].
The role of obesity in patients with IBD is still uncertain, although initially it is believed that the greater inflammatory potential of adipose tissue could have a negative impact on the evolution of the disease in these patients[32,33]. The effect of body weight on bone mass can be attributed to the mechanical compression of weight on the skeleton, and in response, it increases bone mass to accommodate greater load[34]. In UC patients, obesity appears to be associated with a lower risk of low BMD[35], with a 5 kg/m2increase in BMI decreasing by 57% the chance of having low BMD in 327 patients with UC and ileo-anal anastomosis with pouch illegitimate[29].
The effects of body fat on BMD in patients with IBD have been discussed[36], considering the increase in the prevalence of overweight individuals diagnosed with UC[37,38]. Although there is no clear consensus in the literature, body fat seems to have a positive effect on bone mass, as a result of the anabolic effect of mechanical tension of the fat mass on bone, in addition to the action of hormonesreleased by adipocytes, which influence the activities of bone cells, both osteoblasts and osteoclasts[34].
The influence of gender on the BMD of patients with IBD is discordant[1,4]. In our study, male patients were more likely to have reduced BMD, which we suppose at the expense of lower body fat compared to females.
No studies were found evaluating the association between WC/abdominal fat and BMD in patients with IBD. It is known that the relationship between abdominal fat and BMD is quite complex and the results of studies in the general population are conflicting[39,40]. The two adipose tissues present in the abdominal region (subcutaneous and visceral) are highly metabolic, with the production of adipokines,estrogens, and metabolic factors derived from bones, with feedback mechanisms that affect bone remodeling and body composition[40].
Our study has some limitations. For example, serum levels of alkaline phosphatase, parathyroid hormone, and vitamin D were not measured in this study. On the other hand, it has the advantage of assessing body mass by DXA. More robust, prospective studies with larger samples and techniques for more accurate quantification of adipose tissues are needed to better explain the relationship between total and abdominal body fat and BMD.
CONCLUSION
In conclusion, we observed that male UC patients in remission have a high prevalence of metabolic bone diseases, and nutritional parameters related to body fat seem to protect against the development of low BMD. Understanding the protective effect that each nutritional component exerts on the bone mass of patients with IBD is important to assist in the development of strategies that can provide the control of metabolic bone diseases in these patients.
ARTICLE HIGHLIGHTS
FOOTNOTES
Author contributions: Lopes MB, Rocha R, Coqueiro FG, and Santana GO designed the research; Lopes MB, Coqueiro FG, and Lima CA performed the research; Lopes MB, Rocha R, and de Oliveira CC analyzed the data; Lopes MB,Lyra AC, Rocha R, and Santana GO wrote the paper.
Institutional review board statement: The Ethics Committee of the University Hospital Professor Edgar Santos approved the study protocol (nº117/2011).
Informed consent statement: All study participants, or their legal guardian, provided informed written consent prior to study enrollment.
Conflict-of-interest statement: All authors declare that they have no conflict of interest to disclose.
Data sharing statement: Technical appendix, statistical code, and dataset available from the corresponding author at raquelrocha2@yahoo.com.br. Participants gave informed consent for data sharing. No additional data are available.
STROBE statement: The authors have read the STROBE Statement—checklist of items, and the manuscript was prepared and revised according to the STROBE Statement—checklist of items.
Open-Access: This article is an open-access article that was selected by an in-house editor and fully peer-reviewed by external reviewers. It is distributed in accordance with the Creative Commons Attribution NonCommercial (CC BYNC 4.0) license, which permits others to distribute, remix, adapt, build upon this work non-commercially, and license their derivative works on different terms, provided the original work is properly cited and the use is noncommercial. See: https://creativecommons.org/Licenses/by-nc/4.0/
Country/Territory of origin: Brazil
ORCID number: Mirella Brasil Lopes 0000-0003-1393-8391; Andre Castro Lyra 0000-0001-9010-8645; Raquel Rocha 0000-0002-2687-2080; Fernanda Gomes Coqueiro 0000-0003-4405-218X; Carla Andrade Lima 0000-0002-3123-4665; Carolina Cunha de Oliveira 0000-0003-1196-0683; Genoile Oliveira Santana 0000-0001-5936-9791.
S-Editor: Wang LL
L-Editor: Wang TQ
P-Editor: Wang LL
 World Journal of Gastrointestinal Pharmacology and Therapeutics2022年4期
- World Journal of Gastrointestinal Pharmacology and Therapeutics的其它文章
- Biliary atresia and congenital disorders of the extrahepatic bile ducts
- Primary hyperparathyroidism presenting as acute pancreatitis: An institutional experience with review of the literature