
Evaluation of Tactile Comfort of Underwear Fabrics
2022-12-10 05:19WANGJingDUJianxia杜剑侠
关键词:剑侠
WANG Jing(王 静) , DU Jianxia(杜剑侠)
School of Fashion, Beijing Institute of Fashion Technology, Beijing 100105, China
Abstract: From the perspective of the tactile comfort of underwear fabrics, 179 kinds of underwear fabrics were selected to test tactile related performance indices using the fabric touch tester (FTT), and the relationship between physical indicators and tactile sensation of different fiber types of underwear fabrics was studied to establish a digital regression model by a stepwise regression method. The experimental results show that fabric fiber composition, compression characteristics, surface friction coefficient, surface roughness amplitude, bending characteristics, and maximum thermal conductivity significantly affect the level of tactile comfort of underwear fabrics, the composition of underwear fabrics has a significant effect on soft touch, and the clustering method and the grading method can effectively rate the level of tactile comfort of underwear fabrics.
Key words: underwear fabrics; tactile comfort; objective tactile classification; stepwise regression
Introduction
In the era of internet shopping, consumers’ demand for clothing has changed a lot, and health and comfort indicators have become important factors affecting clothing sales. Underwear fabrics are the second skin of the human body, and the requirements for tactile comfort of fabrics have become the common needs of consumers’ psychology and physiology[1-2]. The evaluation of tactile comfort of fabrics involves psychological, physical, and perceptual factors and requires extensive testing and research. At present, there is a lack of a unified standard for the evaluation of fabric haptics. The existing evaluation methods of fabric haptics mainly include subjective evaluation and objective evaluation. Subjective evaluation refers to feeling the tactile comfort degree of the fabric through the touch of the human hand,etc. The subjective score is based on personal feelings, which will be affected by different external conditions, such as touch modes, touch forces, and visual factors[3]. In order to ensure the accuracy of the experimental results, a large number of experimental personnel are required for testing or professional textile experimental personnel are required to perform testing. Subjective evaluation can be applied in the case of relatively few samples. However it will be time-consuming when there are many samples and there will be a large degree of subjective error[4-5]. Objective evaluation refers to using instruments to test the basic characteristics of fabrics related to tactile sensation[6], and then the instrument automatically analyzes the results according to the data. This method reduces the subjective experimental error, and characterizes the tactile properties of fabrics in a digital form, so as to form a scientific evaluation system.
Commonly used fabric tactile test instruments mainly include the Kawabata evaluation system fabric (KES-F) style instrument developed by Japanese scholars and fabric assurance by simple testing (FAST) style instrument developed by Australian scholars[7]. They all belong to multiple sets, multiple measurements, and multiple indicators, which are not conducive to industrial use due to high price and complicated operation. Based on this, a single multi-index instrument is designed, such as the PhabrOmeter fabric tactile instrument, comprehensive handle evaluation system for fabrics and yarns (CHES-FY), and the fabric touch tester (FTT)[8]. The PhabrOmeter fabric tactile instrument needs to select a suitable reference object during the test. CHES-FY obtains physical and mechanical parameters of the fabric through a single pull-out test. The advantages of FTT compared with other instruments are as follows. (1) FTT can test all types of fabrics. (2) FTT has a high degree of intelligence. It uses sensors to detect various properties of the fabric, and quickly detects the physical and mechanical properties of the tested fabric in a short time. (3) FTT can get more physical indicators about the fabric, and can test the heat flow performance indicators of the fabric.
In this paper, starting from the physical properties of underwear fabrics and the needs of human subjective tactile comfort, FTT is used to test the tactile-related physical and mechanical properties of underwear fabrics. The relationship between physical properties and tactile sensation, and the influence of fabric composition on tactile sensation are studied. Based on the tactile sensation level of the fabric obtained by FTT, the digital prediction model of smoothness, softness, warmth, and total touch only for underwear fabrics is reconstructed. The important physical indicators that affect the tactile comfort of underwear fabrics are found, and the evaluation standard of tactile comfort for underwear fabrics is formed in the form of digital quantitative grading.
1 Experiments
1.1 Specimen specifications
In this paper, 179 kinds of samples are all from “China Textile City” — Shaoxing, Zhejiang province, China, and can be divided into natural fiber fabrics and chemical fiber fabrics according to the main fiber components. Natural fiber fabrics include commonly used cotton fabrics, hemp fabrics, and silk fabrics. Synthetic fiber fabrics include polyester fabrics and nylon fabrics. Regenerated cellulose fiber fabrics include acetate fabrics, modal fabrics, viscose fabrics, tencel fabrics, cupro fabrics and bamboo pulp fabrics. According to the fabric weaving method, they are mainly divided into knitted fabrics and woven fabrics. The specifications of the fabrics are shown in Table 1.

Table 1 Sample specifications

(Table 1 continued)

(Table 1 continued)
1.2 Experimental instruments and methods
1.2.1Experimentalinstruments
The experiment uses FTT jointly developed by SDL ATLAS, China, and Hong Kong Polytechnic University. FTT could simultaneously measure physical indicators related to touch sensation of textiles such as knitted and woven fabrics in four modules. It can measure all these four modules including warp and weft directions as well as face and back sides within 5 min.
1.2.2Experimentalmethods
Each experimental fabric needs to be cut into 10 pieces of L-shaped samples with a length of 31 cm and a width of 11 cm. Before testing, the samples are placed flat in an environment at a temperature of (21±1)℃ and a humidity of (65±2)% for at least 24 h. And the surface of the tested fabric needs to be free of obvious creases. According to the requirements of FTT, the tests are carried out in the order of the front and the back of fabrics, in sequence. Bending average rigidityBAR, bending workBW, suface friction coefficientSFC, surface roughness amplitudeSRA, surface roughness wavelengthSRW, compression workCW, compression recovery rateCRR, compression average rigidityCAR, compression recovery average rigidityRAR, thermal conductivity compressionTCC, thermal conductivity recoveryTCR, and thermal maximum fluxQmaxof the fabric can be obtained after the test is completed (shown in Table 2). According to the underwear fabrics wearing requirements, the data from the reverse side of the fabric are used for analysis.
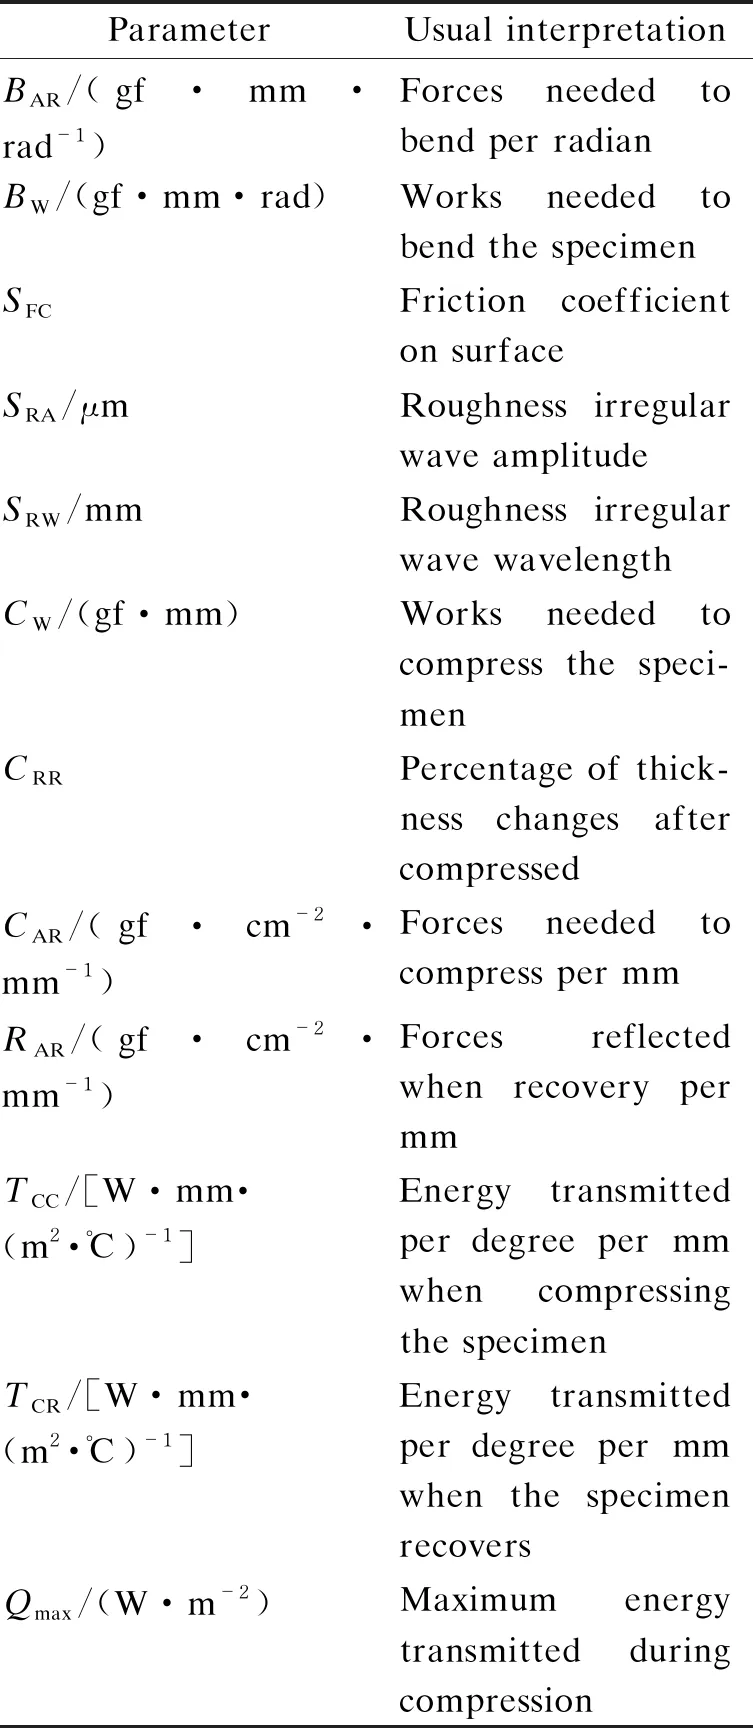
Table 2 Definitions of mechanical properties
2 Correlation Analysis
2.1 Correlation analysis between basic touch and physical indicators of underwears fabrics
By analyzing the correlation between the physical indicators of the underwear fabrics obtained by the FTT test and the scores of smoothness, softness, warmth, and total touch, the physical indicators that are highly correlated with the tactile sensation can be obtained[9]. The Pearson correlation coefficient can be used to represent the correlation between basic touch and physical indicators of underwear fabrics.
It can be seen from Table 3 that the smoothness of 179 kinds of underwear fabrics have significant negative correlations withW,BWa,T,CW,CRR,TCC,TCR,SFCa,SFCe,SRWa, andSRWe. And there are significant positive correlations withCAR,RAR, andQmax.

Table 3 Pearson correlation coefficients for basic touch and physical indicators of underwear fabrics
The softness of 179 kinds of underwear fabrics have significant negative correlations withW,T,Cw,TCC,TCR,SFCa,SFCe,SRAa,SRAe,SRWa, andSRWe. And there are significant positive correlations withCAR,RAR, andQmax.
The warmth of 179 kinds of underwear fabrics have significant positive correlations withW,T,CW,CRR,TCC,TCR,SFCa,SFCe,SRCa,SRCe,SRWa, andSRWe. And there are significant negative correlations withCAR,RAR, andQmax.
The total touch of 179 kinds of underwear fabrics have significant negative correlations withW,T,CW,CRR,TCC,TCR,SFCa,SFCe,SRAa,SRAe,SRWa, andSRWe. And there are significant positive correlations withCAR,RAR, andQmax.
2.2 Correlation analysis between total touch and basic touch indicators
The correlation analysis of the scores of smoothness, softness, warmth and total touch of 179 kinds of underwear fabrics shows that smoothness and softness have positive correlations with total touch, while warmth and total touch are negatively correlated. The results are shown in Table 4.

Table 4 Correlations between total touch and basic touch indicators
3 Construction of Tactile Prediction Model for Underwear Fabrics
When regression analysis was performed, although all physical properties of the fabric contributed differently, some of the attributes contributed more than others. Therefore by eliminating the attributes that contribute the least, the overall dimensionality of the data set can be reduced and variables that cause multicollinearity can be removed[10]. Because of the strong correlation among 19 haptic-related performance indicators obtained from the FTT test, a stepwise regression analysis was used to solve the covariance problem. Fiber compositionFCis also an important indicator that affects the tactile properties of fabrics. “1” represents natural fibers, “2” represents synthetic fibers, and “3” represents regenerated fibers. Andx1-x20are respectively indicated asW,BARa,BARe,BWa,BWe,T,CW,CRR,CAR,RAR,TCC,TCR,Qmax,SFCa,SFCe,SRAa,SRAe,SRWa,SRWe, andFC.
3.1 Basic touch prediction model
The linear fits of the regression models for the tactile-related physical indicators of the underwear fabrics and the smoothness, softness and warmth of touch are 0.884, 0.665 and 0.882, respectively, which show good model fits. The composition of the underwear fabrics can have an effect on the softness of the fabric. The linear fit of the softness prediction model is lower compared to the smoothness and warmth prediction models, indicating that the factors affecting softness need further research. The smoothness of the underwear fabrics is related to the compression properties, surface friction, roughness properties, and fabric thickness, indicating that the more easily the fabric is compressed and deformed, the better the level of smoothness is. Weight, compression work, recovery stiffness, warp and weft surface roughness wavelengths are positively related to smoothness, while weft surface friction coefficient is negatively related to smoothness. The higher the coefficient of friction of the weft surface is, the lower the smoothness score of the underwear fabrics is. The results are shown in Table 5.

Table 5 Physical indicators and basic touch regression models
Weight, warp and weft surface roughness amplitude have significant negative relationships on smoothness, while compression average rigidity, weft surface roughness wavelength and fiber type have a positive effect on warmth. This indicates that the fiber composition of the underwear fabrics affects the softness score. Softness indicates the light, soft, and sticky feeling felt when touching the fabric, and it is related to the surface characteristics and compression characteristics of the fabric. The lighter and thinner the fabric is, the better the surface flatness is, and the higher the level of softness is.
Compression work has a significant positive effect on warmth. Compression stiffness, recovery stiffness, thermal conductivity in compression, and maximum thermal conductivity have a significant negative effect on warmth[11]. Then the worse the thermal conductivity of the fabric is, the higher the warmth score is.
3.2 Total touch prediction model
Smoothness scores, softness scores and warmth score of 179 kinds of underwear fabrics were taken as independent variables, and the total touch score was taken as the dependent variable for linear regression analysis to study the relationship between basic touch and total touch of underwear fabrics[12]. When correlation analysis was carried out, it was found that warmth showed a negative correlation with overall touch, while the linear regression analysis showed a positive effect relationship, which was due to the interaction between the independent variables. Therefore, the higher the score for these three basic tactile sensations is, the higher the overall tactile score of the underwear fabric will be.
From Table 6, we can obtain that the adjustedR2is 0.989, indicating that smoothness, softness and warmth can explain 98.8% of the variation factors of the total touch sensation, and the linear fitting result is good. Therefore, the regression model equation of basic touch and total touch of underwear fabrics is
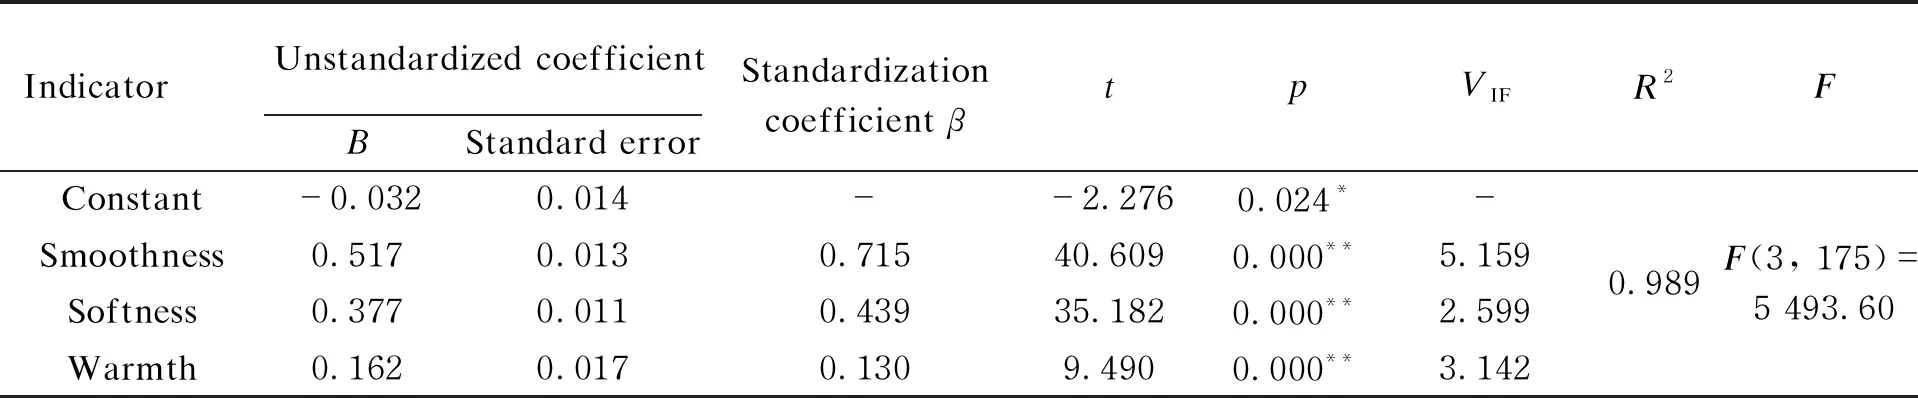
Table 6 Linear regression results of basic touch and total touch
F=-0.032+0.517y1+0.377y2+0.162y3.
3.3 Objective tactile classification
Smoothness, softness, warmth and total touch scores of the underwear fabrics obtained from the FTT were classified by an iterative solution algorithm usingK-means clustering analysis[13]. It was expected that the data would be divided into five categories, and the range of smoothness, softness, warmth and total touch scores from level 1 to level 5 was calculated. As shown in Tables 7-10, the grading of underwear fabrics for tactile sensation revealed that most of the tactile ratings for underwear fabrics were concentrated at the medium level.

Table 7 Smoothness grading of underwear fabrics
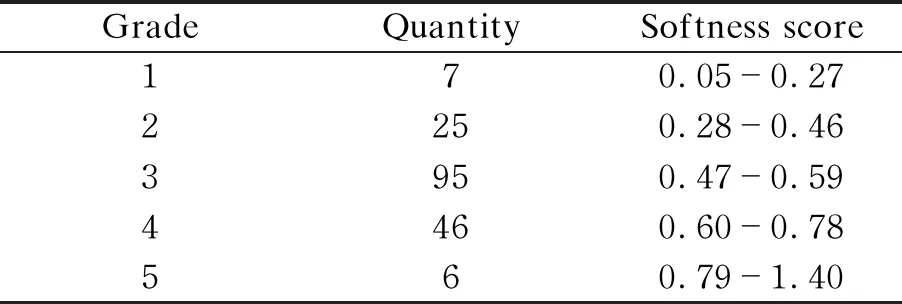
Table 8 Softness grading of underwear fabrics

Table 9 Warmth grading of underwear fabrics
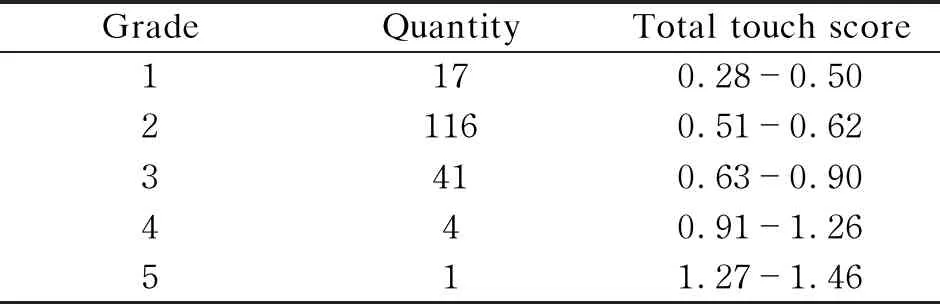
Table 10 Total touch grading of underwear fabrics
4 Subjective Experiments
4.1 Subjective experimental methods
The results of objective tests on underwear fabrics ultimately need to be characterised by the subjective feeling of the human body when wearing them, which can be further inferred from the objective testing of the instrument[14]. The subjective evaluation experiment used a 5-point Likert scale to evaluate the smoothness[3], softness, warmth and total touch of the underwear fabrics, ranging from 1 to 5 on a scale from uncomfortable to the most comfortable(shown in Fig. 1).

Fig. 1 Classification index of fabric tactile comfort
In order to ensure the accuracy of the experimental results, 11 students and teachers with a good understanding of fabrics were selected to conduct the subjective experiments, and the samples were cut to a shape of 30 cm ×21 cm, and equilibrated in a constant temperature room of (20±2)℃ and at a relative humidity of (65±4)% for 4 h. The first stage was the training phase, in which the subjects were given a full understanding of the meaning of smoothness, softness and warmth, as well as the experimental touch, to avoid subjective errors caused by different touching styles. The second stage was the formal experimental phase, where the vision could have a large impact on the results of the subjective haptic experiments[2, 15]. Therefore, the subjective experiments are conducted blindfolded in a room under constant conditions, and the samples are rated on a scale of 1 to 5 for smoothness, softness, warmth, and total touch according to the operational requirements[16]. The operator is responsible for switching the experimental samples and recording the data, and the test instructions are given in Table 11.

Table 11 Subjective experiment description
4.2 Analysis of subjective evaluation results
The results of the subjective experiment relied mainly on the subjective sensations of the subjects. In order to ensure the validity of the experimental data, the results of the subjective experiment were tested for consistency among 11 subjects. The results are shown in Table 12. The Kendall coordination coefficient test for smoothness, softness, warmth and total touch showed significance (p=0, <0.05), implying that the results of 11 subjects were consistent. Also the Kendall coordination coefficient were 0.693, 0.609, 0.689 and 0.572, respectively, indicating a strong degree of consistency in the evaluations.

Table 12 Consistency check
4.3 Comparison of subjective and objective ratings
Comparing the objective rating results of smoothness, softness, warmth and total touch of 179 kinds of underwear fabrics with the subjective rating results, we found that the degree of consistency of the subjective and objective ratings were 88.3%, 89.4%, 87.7% and 75.4%, respectively, which basically remained within the error range, indicating that the objective clustering grading results were good and could be applied to the grading of underwear fabrics.
5 Conclusions
The relevant physical indicators affecting the tactile comfort of underwear fabrics were obtained through FTT, and correlation analysis was conducted between each physical indicators and tactile indicators. The regression equations between smoothness, softness, warmth, total touch and physical indicators were obtained by the stepwise regression method, and the three basic touch were graded by clustering analysis.
(1) There was a significant correlation between compression, bending, heat flow, and surface friction properties of the underwear fabrics and the tactile indexes, and warmth was negatively correlated with smoothness, softness and overall tactile sensation.
(2) The linear fits of the regression models for the tactile-related physical indicators of underwear fabrics and smoothness, softness and warmth can reach 0.884, 0.665 and 0.882, respectively. The linear fits of basic touch and total touch are 0.989, which is a good fit and can be used to predict the tactile performance of underwear fabrics. The type of underwear fabrics will affect the softness of the fabric. In the future, we should continue to study the physical indicators that affect the softness, and improve the accuracy of the softness prediction model.
(3) TheK-means clustering method was found to be effective in grading the tactile properties of underwear fabrics, and the tactile properties of underwear fabrics could be characterized in a quantitative manner. In order to improve the accuracy of digital tactile rating of underwear fabrics, we will build a database of underwear fabrics, expand fabric types and collect consumer tactile rating feedback.
猜你喜欢
金秋(2020年3期)2020-08-19
紫禁城(2020年1期)2020-08-13
民间故事选刊·上(2019年6期)2019-06-18
小小说月刊·下半月(2018年10期)2018-11-10
金山(2018年5期)2018-06-20
北京广播电视报(2017年28期)2018-02-24
小小说月刊·下半月(2015年6期)2015-05-14
故事会(2015年5期)2015-05-08
 Journal of Donghua University(English Edition)2022年5期
- Journal of Donghua University(English Edition)的其它文章
- Finite-Time Stability for Nonlinear Fractional Differential Equations with Time Delay
- Adaptive Single Piecewise Interpolation Reproducing Kernel Method for Solving Fractional Partial Differential Equation
- Adaptive Neural Network Control for Euler-Lagrangian Systems with Uncertainties
- Electromagnetic Transmission Characteristics of Y-Shaped and Y-Ring-Shaped Frequency Selective Fabrics
- Property of Polyimide/Flame-Retardant Viscose Blended Fabrics
- Classification of Young Females’ Body Shape in Jiaodong Area Based on 3D Morphological Characteristics