
Multiple collisions in crystal high-order harmonic generation
2022-12-28 09:53DongTang唐栋andXueBinBian卞学滨
Chinese Physics B 2022年12期
Dong Tang(唐栋) and Xue-Bin Bian(卞学滨)
1State Key Laboratory of Magnetic Resonance and Atomic and Molecular Physics,Wuhan Institute of Physics and Mathematics,Innovation Academy for Precision Measurement Science and Technology,Chinese Academy of Sciences,Wuhan 430071,China
2School of Physical Sciences,University of Chinese Academy of Sciences,Beijing 100049,China
Keywords: high-order harmonic generation,ultrafast optics,Bloch electron dynamics
1. Introduction
The study of high-order harmonic generation (HHG)induced by intense laser fields in atomic and molecular systems[1–8]has attracted a lot of attention over the past several decades, and the underlying mechanisms have been well understood.[1,2,5]Since the experimental observation of nonperturbative HHG in crystal systems,[9]the solid-state HHG process has been studied extensively.[10–14]The conversion efficiency of the solid-state HHG is expected to be higher than that of the atomic system due to the high density of condensed materials. The solid-state HHG can be used to reconstruct the band structure of crystals in an all-optical manner,[15]to produce novel light sources such as extreme ultraviolet pulses,[11,16]and to probe the dynamics of electrons and holes in solids.[17,18]To further investigate and make use of the HHG from solids, the mechanism of the harmonic radiation[10,11,19–26]is always the research hotspot. The HHG is dominated by the intraband currents and interband polarizations. The harmonics below the minimum band gap mainly come from the intraband oscillations of the electrons and holes, while the above-band-gap harmonics mainly originate from the interband transitions. Since the energy of the harmonics discussed in this paper is bigger than the minimum band gap,we focus on the interband transitions.
Quantum computing methods such as semiconductor Bloch equations (SBEs),[15,21,23]time-dependent densityfunctional theory (TDDFT),[27–29]and the time-dependent Schr¨odinger equation(TDSE)[30,31]are usually used to be the numerical experiments to simulate the solid-state HHG process.Since quantum calculations contain all the relevant physical processes, it is difficult to extract the intuitive picture of the underlying mechanisms. To reveal the physical origin of the harmonic dynamics,the semiclassical calculation methods are usually adopted.
For interband HHG, there are two common analysis methods: reciprocal-space semiclassical model[25,29,32–35]and semiclassical recollision model.[23,26,36–42]By analyzing the semiclassical reciprocal-space trajectory, the essential contributions to the HHG yields from the electrons with nonzero crystal momenta are revealed,[25,34]and the multiple plateau spectral feature of the HHG in solids is elucidated by taking into account the multiple conduction bands.[29,32,33]As for the semiclassical recollision analysis of the interband emission mechanism,[23,26,36–42]it is useful to predict the maximum harmonic energy,[23]and it is also helpful for exploring the effect of electron dynamics in the HHG process.[36–39]
The semiclassical recollision model[23]is an instrumental tool in the fundamental research of HHG in solids. It has been generalized from the gas-phase three-step model and has provided an intuitive understanding of the interband harmonics:the electron tunnels from the valence band (VB) to the conduction band (CB) with its associate hole staying in the VB,and the electron and hole are born at the same position in real space;the electron and hole move under the driving of the laser field; when the spatial distance between the electron and its associate hole becomes zero,the electron–hole pair recollides,and the harmonic photon is emitted.Previously,the recollision only happen between the electron and hole which are born at the same time and the same spatial position,and they must exactly meet again in real space. However,the wave packets of the electron and hole are spatially delocalized,they can overlap even if their centers do not completely coincide. So, in some research,imperfect recollisions[37,38,43]are allowed,and the distance used to judge whether the electron and hole can recollide is consistent with the size of the delocalized quantum wave packet. Moreover,we discuss the multiple collisions between the electrons and holes born at different times and the collisions between the electrons and holes generated at different positions in this paper, and we also show the harmonic suppression phenomenon in our calculation.
The interference phenomena in molecular HHG have been studied, such as the interference between the harmonics contributed from different nuclei. The harmonic spectra exhibit minima which are related to the angle between the molecular axis and the laser polarization direction.[44]The quantum interference in solid HHG has also been investigated,such as the Michelson interferometry of the Bloch electrons[45]and the subcycle interference induced by two adjacent Zener tunneling events.[46]
In this paper, HHG from ZnO crystals induced by linearly polarized fields is theoretically studied by solving the SBEs. We analyze the simulation results with the semiclassical reciprocal-space model, the recollision model, and the multiple collision model,respectively.As the reciprocal-space semiclassical model is rough to analyze the quantum calculation results, the semiclassical recollision results agree well with the high-order region of the quantum results,and the multiple collision results agree well with the low-order region of the quantum results. Then, we focus on the multiple collisions between the electron and hole which are born at different times, and we find that the collision trajectories may overlap in some energy regions and produce harmonic suppression. In addition, we also study the collisions between the electrons and holes which are born at different initial positions,and we find that adopting this type of collisions can improve the agreement with the quantum results.
This paper is organized as follows. In Section 2,the theoretical models and methods used in this work are introduced.In Section 3,we present and discuss the simulation results.We give our main conclusions in Section 4.Atomic units(a.u.)are used unless stated otherwise in this paper.
2. Theoretical methods
2.1. Semiconductor Bloch equation
In this work, we solve the one-dimensional two-band SBEs to simulate the interaction between the lasers and crystals. The SBEs[15,21,23]can be expressed by:


wherep(K,t)=d(K+A(t))π(K,t)eiS(K,t)+c.c.is the interband polarization.vm(k(t))=∇kEmis the group velocity of electrons and holes in bandm.
2.2. Reciprocal-space semiclassical model
The reciprocal-space semiclassical model in solid HHG is similar to the three-step model in atomic and molecular HHG:the electron–hole pairs are generated when the electrons tunnel from the top of the VB to the CB;the electrons and holes are accelerated by the laser field in their respective bands;the electrons and holes recombine in reciprocal space instantaneously with emissions of high-harmonic photons. However,different from the atomic and molecular case,the wave packets of the electron and hole are totally delocalized in solid systems. The electron–hole pairs can recombine in the case of the imperfect overlaps of the electron and hole wave packets in real space. Therefore, the reciprocal-space semiclassical model does not require the distance between the electrons and holes in real space to be 0,which is reasonable. The electron–hole pair oscillates with the time-dependent crystal momentumk(t)=k0+A(t)in reciprocal space and the photon is emitted with energyεg[k(tr)]at the recombination timetrwhich can be arbitrary.[25,29,32–34]
2.3. Semiclassical recollision model
The interband harmonic spectra can be expressed analytically with the Keldysh approximation[47]in Eqs. (1) and(2), and the main contributions of the interband harmonics are around the saddle points.[23]Therefore, the semiclassical recollision model is chosen to intuitively explain the physical origin of the interband harmonic dynamics. The electron tunnels from the VB to the CB at the minimum band gapεg[k(tb)=0]in reciprocal space and the electron and hole are assumed to be born at the same position in real space. Then,the electron and hole oscillate with the time-dependent momentumk(t)=k0+A(t)−A(tb)in their respective bands in reciprocal space and recombine when the distance between the electron–hole pair in real space becomes 0.The high harmonic photon, whose energy is equal to the band gap at the time of recombination, is emitted. The distance between the electron and hole in real space is expressed by

wheretbis the birth time of the pair andtis the observation time,EcandEvare the energies of CB and VB,respectively.In the semiclassical recollision model,when the electron tunnels from the top of VB to CB in reciprocal space, the electron–hole pair is born at the same time and born at the same position in real space,and the electron can only recombine with its associated hole in this model.
2.4. Multiple collision model
A Bloch electron with a certain initial crystal momentumk0which is driven by the laser field and oscillates in the Brillouin zone can pass the top of the VB several times. In quantum calculations, every time the electron passes through the positionk=0 a.u., the electron has a certain probability to tunnel to CB. Figure 1 shows that the electron with the initial crystal momentumk0=−0.0564 a.u. passes through the top of the VB when the vector potential of the laser equals 0.0564 a.u. attb1,tb2,andtb3. The electron has certain probabilities to tunnel to CB at these times,then the electron oscillates in the CB. The vector potential of the laser field can be written as
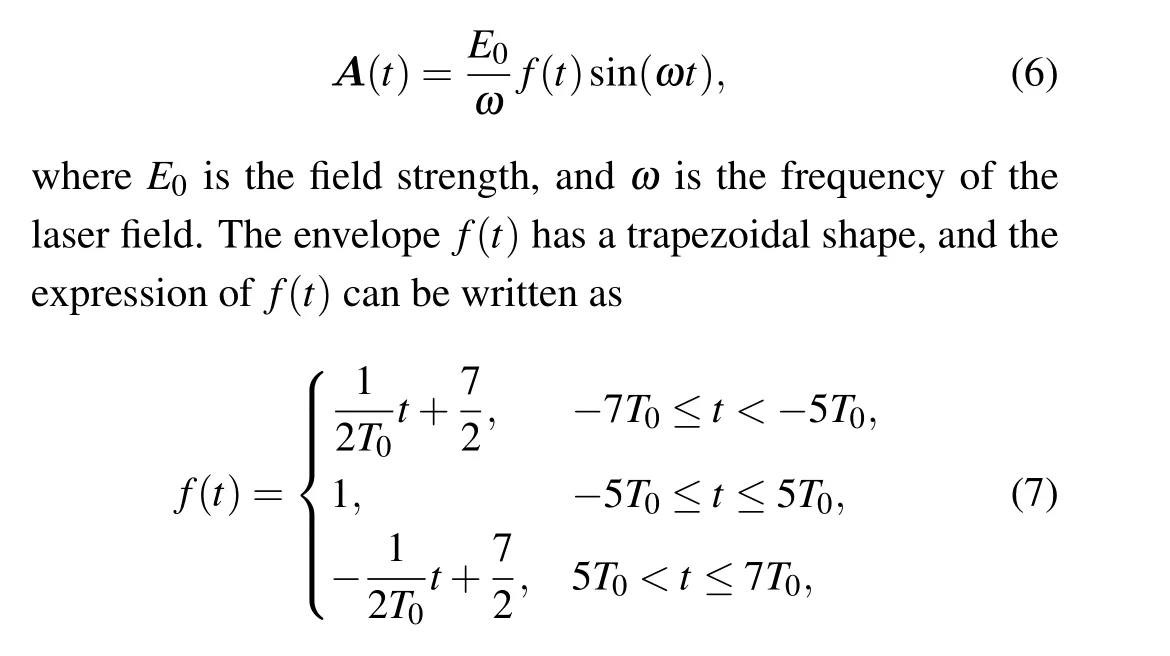
whereT0is the period of the driving laser field.
In Figs.1(a)–1(c),the vector potentials of the laser field attb1,tb2,andtb3 are marked by the black square,green circle,and magenta asterisk,respectively. The vector potentials after the tunnel times are marked with dashed lines. Figures 1(d)–1(f) show the trajectory sketches after the electron tunnels attb1,tb2,andtb3,respectively. While the electron and hole oscillate in their respective bands in reciprocal space, they also oscillate in real space.

Fig.1.(a)–(c)The vector potential of the platform part of a trapezoidal laser field.The vector potentials at the tunneling times tb1,tb2,and tb3 are marked by the black square, green circle, and magenta asterisk. The vector potentials after the relevant tunneling times are marked by the black dashed line,green dashed line,and magenta dashed line,respectively. The trajectory sketches of the electron with the initial crystal momentum k0=−0.0564 a.u.,which tunnels to CB in reciprocal space at tb1,tb2,and tb3,and oscillates in the CB until t=0.5 o.c.(The unit o.c.is short for optical cycle)are shown in panels(d),(e),and(f),respectively.
To gain closer insight,the dynamics of the electrons and holes driven by the laser field should be studied both in reciprocal and real spaces. Figure 2(a)exhibits the time-dependent momentums of the electrons and holes with the same initial momentumk0=−0.0564 a.u.but born at different times.The black line, green line, and magenta line represent the timedependent crystal momentums of the electron–hole pairs born attb1,tb2,andtb3,respectively.The velocities of the electrons(solid lines) and holes (dashed lines) are shown in Fig. 2(b).Figure 2(c)plots the real-space trajectories of electrons(solid lines) and holes (dashed lines) for three different birth times.Here,we suppose that the electron and hole with the same initial momentum are born at the same position in real space.The blue circles mark the recollision positions of the electrons and holes,which are born at the same time. The red dots mark the collision positions of the electrons and holes,which are born at different times. Similar to the recollision case,the harmonics emit when the collision happens. For the existence of the dephasing process,we assume that the collision may occur only if the time interval between the birth times of the electron and hole is no more than one optical cycle (o.c.). The collisions are divided into two types in the following. The first type of collision requires that the time interval between the generation times of the electron and hole equals one optical cycle, such as the collisions between the electron generated attb1 and the hole generated attb3 in Fig.2(c). The second type of collision requires that the time interval between the generation times of the electron and hole is less than one optical cycle,such as the collisions between the electron generated attb1 and the hole generated attb2 in Fig.2(c).
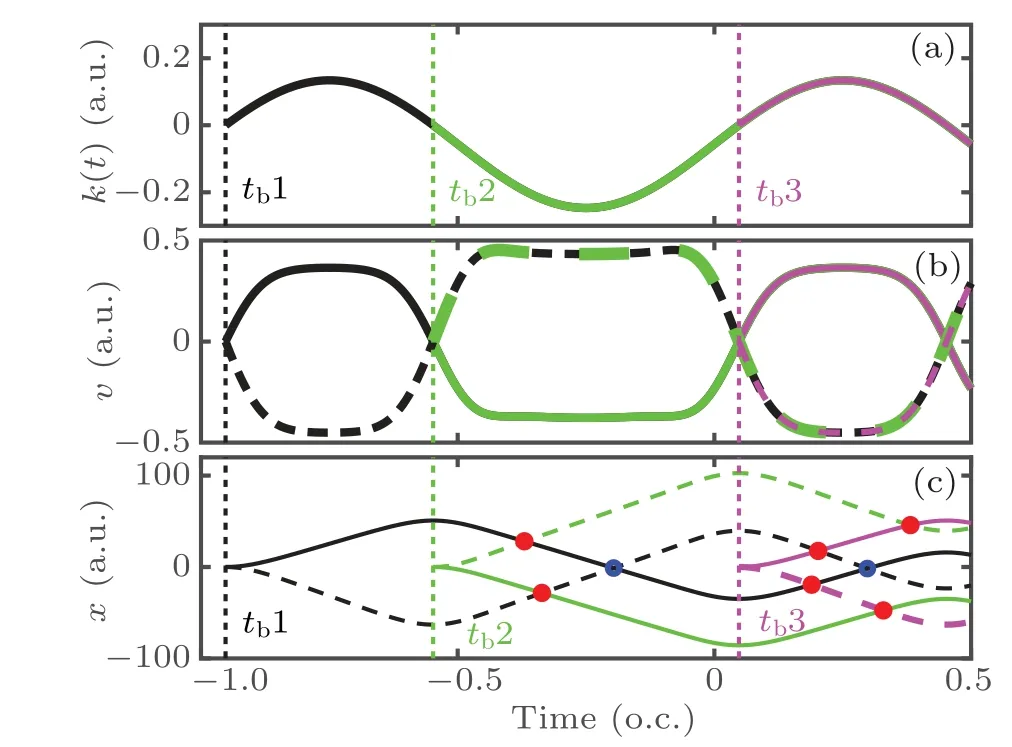
Fig.2.(a)The time-dependent momentum of the electron and hole born at tb1(black solid line),tb2(green solid line),and tb3(magenta solid line). (b)The velocities of the corresponding electrons(solid lines)and holes(dashed lines)in real space. (c)The positions of the electrons(solid lines)and holes(dashed lines)after their creation in real space. The collision positions are marked by red dots and blue circles. The birth times tb1,tb2,and tb3 are marked by the vertical black dotted lines, vertical green dotted lines, and vertical magenta dotted lines in panels(a)–(c).
Moreover, we also consider the collision between the electron and hole, which are born at the same time but different positions in real space. Due to the periodic structure of crystal materials,the primitive cells on different spatial lattice points are equivalent. As a result,the atoms separated by integer multiples of lattice constants in real space are equivalent.Therefore,it is reasonable for us to consider the collisions between the electrons and holes generated at positions separated by integral multiples of the lattice constant in real space. Figure 3 plots the real-space trajectories of electrons(solid lines)and holes(dashed lines)which are born at positions−ax(blue lines), 0 (black lines), andax(green lines). And the red dots indicate where the collisions occur.
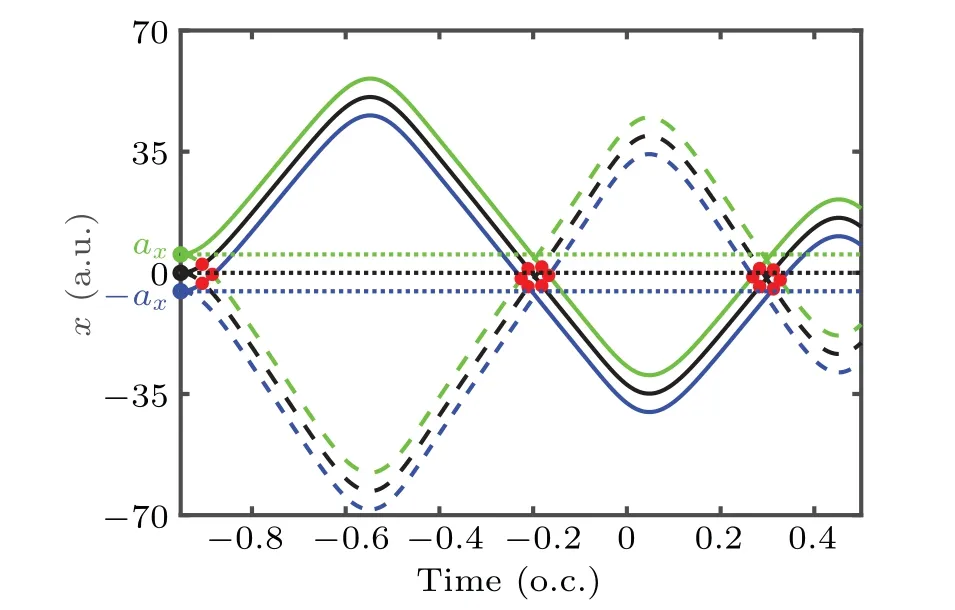
Fig. 3. In real space, the position of the electrons (solid lines) and holes(dashed lines) after their creation at positions −ax (blue lines), 0 (black lines),and ax (green lines),respectively. The collision positions are marked by red dots.
3. Results and discussion
In this paper, the laser polarization is parallel to theΓ–Mdirection of a wurtzite ZnO crystal. Figure 4(a)shows the electric field (red dotted line) and the vector potential (blue solid line)of the trapezoidal laser field. The central frequency equals 0.014 a.u.,and the field strength is 0.0027 a.u. The interband harmonic spectrum is exhibited in Fig. 4(b), and the results in Fig. 4(c) are obtained from reciprocal-space semiclassical trajectory analysis.In Fig.4(c),we consider the electrons which can pass theΓpoint driven by the laser field with the initial crystal momentumk0in an interval[−A0,A0].In addition,the ionization timetbof the electron requires the timedependent crystal momentumk(tb)=k0+A(tb)=0 a.u.,and the electron–hole pairs can recombine at arbitrary times after their generation. The V-shaped solid black line indicates the cutoff energy of each channel. As we can see, the spectral range of the interband harmonics obtained by the reciprocalspace semiclassical trajectory analysis in Fig.4(c)agrees well with the quantum calculation result in Fig.4(b).Therefore,the semiclassical reciprocal-space trajectory analysis can be used to estimate the cutoff energy of the HHG roughly.
To gain insight into the quantum path, we analyze the harmonic spectra by using the Gabor transform in the time–frequency domain.[48]The Gabor transform is defined as

where the parameterσsets the balance between the frequency and temporal domains. We setσ=18 a.u. in all the calculations.
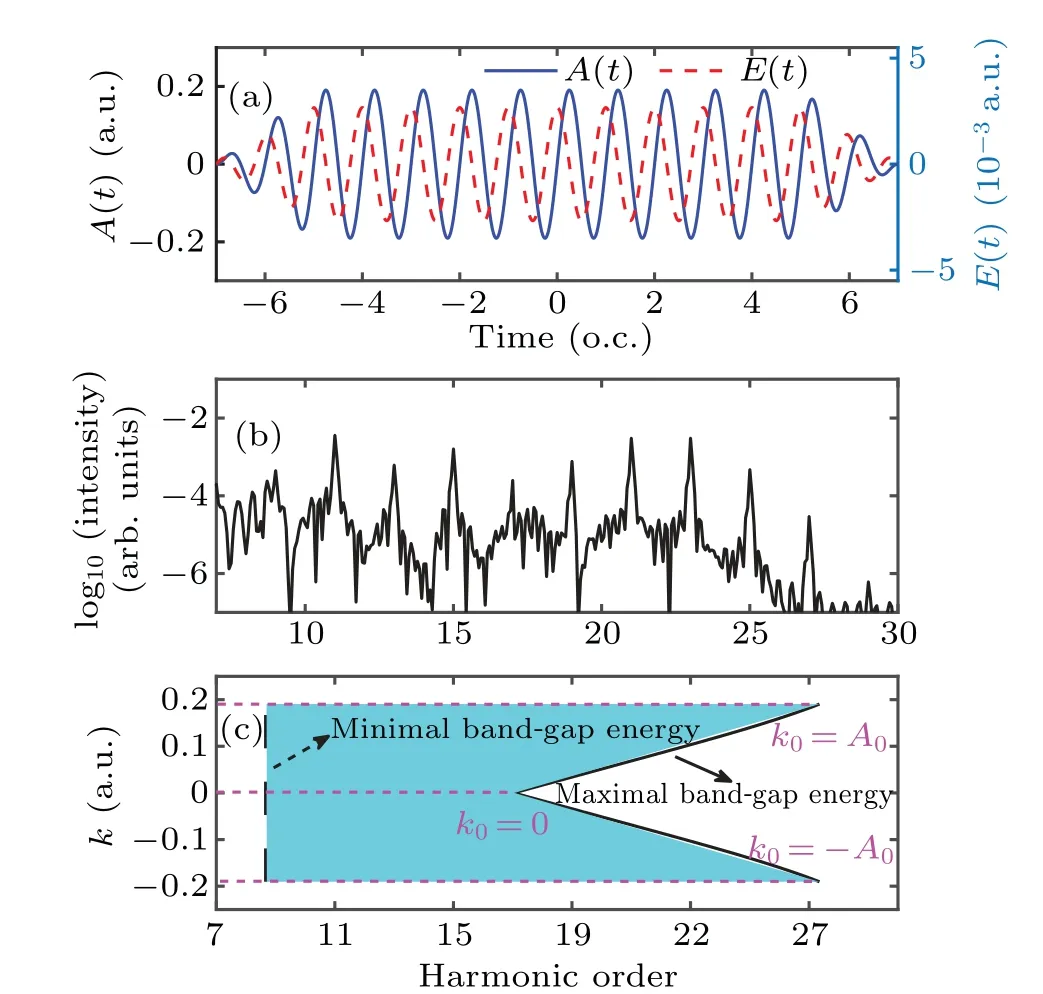
Fig. 4. (a) The electric field (red dotted line) and vector potential (blue solid line) of the laser field. (b) The interband harmonic spectrum simulated by SBEs. (c) The energy range of the interband HHG obtained by the reciprocal-space semiclassical model. The Y-axis represents the initial crystal momentums of the electrons which can pass by the Γ point. The V-shaped black line shows the cutoff energy of each k channel. The vertical black dashed line indicates the harmonic order corresponding to the minimum band-gap energy of the channels. The magenta dashed lines indicate the maximal cutoff energy and the minimal cutoff energy,respectively. The central frequency of the driving laser field is equal to 0.014 a.u.,and the field strength is 0.0027 a.u.

Fig. 5. The time–frequency analysis of the interband current generated by the linearly polarized laser field shown in Fig. 4(a). The gray dots on the top are obtained from the reciprocal-space semiclassical trajectory analysis.Panel(b)is an enlarged part of panel(a).
Figure 5(a)shows the time–frequency analysis of the interband current and the reciprocal-space trajectories which are obtained by using the same parameters as those in Fig.4. Figure 5(b) is an enlarged part of Fig. 5(a). The gray dotted lines represent the reciprocal-space trajectories. At a quick glance, the semiclassical trajectories basically cover all the strong parts of the time–frequency analysis in Fig. 5(a). In Fig.5(b),one may find that the trajectories also cover the very weak signal.For example,there are many reciprocal-space trajectories covering the time–frequency analysis of the 17th harmonic. So, when we further study the dynamics of the HHG process,the semiclassical reciprocal-space trajectory analysis is not sufficient, and we have to find other methods that can better analyze the interband HHG.
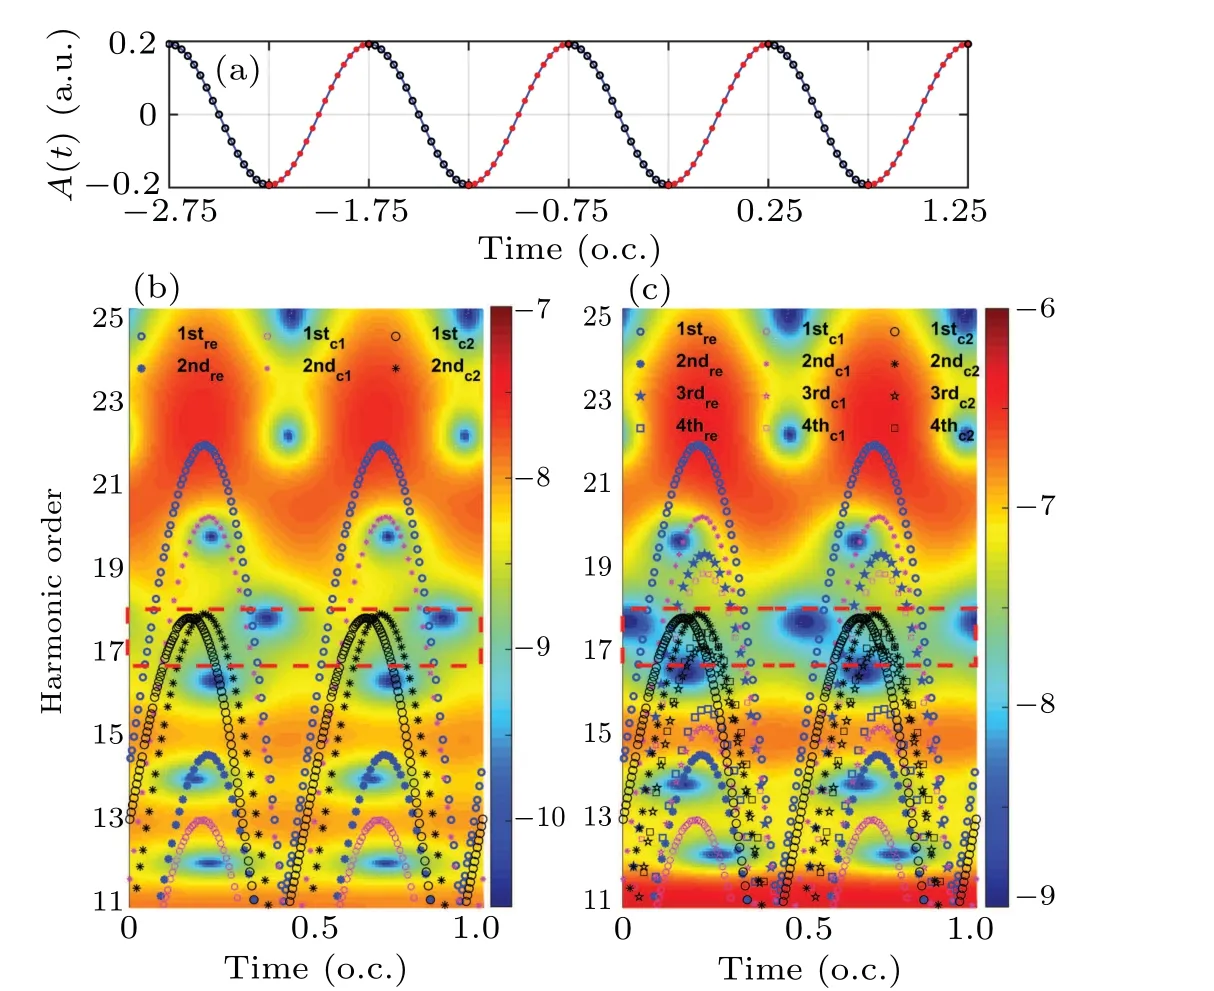
Fig.6. (a)The blue line shows the vector potential of the laser field. Each half cycle of the vector potential is marked alternately with black circles and red dots. [(b), (c)] The time–frequency analysis of the interband harmonic spectrum calculated with T2=2.7 fs and T2=5.4 fs,respectively. The recollision trajectories and collision trajectories are plotted on the top of the time–frequency analysis. The red dashed rectangle marks the overlap position of the collision trajectories. The recollision and collision events are numbered sequentially and coded in shape as follows: first (circles), second(asterisks), third(five-pointed stars), fourth(squares). The recollision,the first type of collision, and the second type of collision trajectories are exhibited in blue,magenta,and black respectively.
To deeply study the radiation mechanism of the interband HHG,we discuss the behaviors of the electrons and holes both in real space and reciprocal space by employing the multiple collision model and the semiclassical recollision model. The recollision and the multiple collision trajectories are compared with the quantum results in Fig. 6. The multiple collisions are divided into two types, which we introduced earlier. In Fig. 6(a), the vector potential of the laser field is alternately marked by black circles and red dots every half cycle.The first type of collisions occurs between the electrons(holes)generated in the interval marked by the black circles(red dots)and the holes(electrons)generated in the next interval marked by black circles (red dots). The second type of collisions happens between the electrons (holes) generated in the interval marked by the black circles (red dots) and the holes (electrons) generated in the adjacent interval marked by red dots(black circles). The time–frequency analysis of the interband harmonics shown in Figs. 6(b) and 6(c) are calculated withT2=2.7 fs andT2=5.4 fs,respectively. As we all know that the shorter dephasing time will lead to the weaker high order recollision and collision trajectories. So,we only consider the first (circles) and second (asterisks) recollision and collision events in Fig.6(b),while the third(five-pointed stars)and fourth (squares) recollision and collision events are additionally added in Fig.6(c). Here, the recollision, the first type of collision, and the second type of collision are shown in blue,magenta, and black, respectively. In Figs. 6(b) and 6(c), it is clear that the recollision trajectories and the first type of collision trajectories are in better agreement with the quantum calculations than the reciprocal-space trajectories shown in Fig.5 both in time domain and frequency domain.
In Figs.6(b)and 6(c),we consider the second type of collision trajectories with different dephasing timeT2. There is a harmonic suppression at the 17th harmonic,and the first(black circles)and second(black asterisks)collision trajectories overlapping at around the harmonic suppression in Fig. 6(b). In addition, the suppression of the time–frequency analysis at around the 17th harmonic marked by the red dashed rectangle in Fig. 6(c) is more obvious than that in Fig. 6(b), and there are four collision trajectories overlap at around the 17th harmonic in Fig.6(c). Different trajectories with different phases overlap at the same time and energy range. The more trajectories in the overlapping region,the greater the disorder degree of the phase. As a result,the disordered phases reduce the coherence of the harmonic,and make the harmonic suppression.Therefore, the harmonic suppression seems more obvious in Fig.6(c)with longer dephasing time than that in Fig.6(b).
To gain closer insight, we chose the laser pulses with the field strengths equal to 0.0031 a.u. and 0.0035 a.u. The corresponding harmonic spectra are shown in Figs. 7(a) and 7(c), and there are two obvious suppressions at the 19th and 21st harmonics in the two harmonic spectra,respectively. The spectrum in black is calculated withT2=5.4 fs,and the spectrum in red is calculated withT2=2.7 fs. Figures 7(b) and 7(d) exhibit the second type of collision trajectories with the two different field strengths. Comparing Figs. 7(a) and 7(c)with Figs.7(b)and 7(d),we can also see that the longer the dephasing time,the more obvious the suppressions become,and the suppressions of the HHG yields correspond to the overlaps of the relevant collision trajectories with different phases.
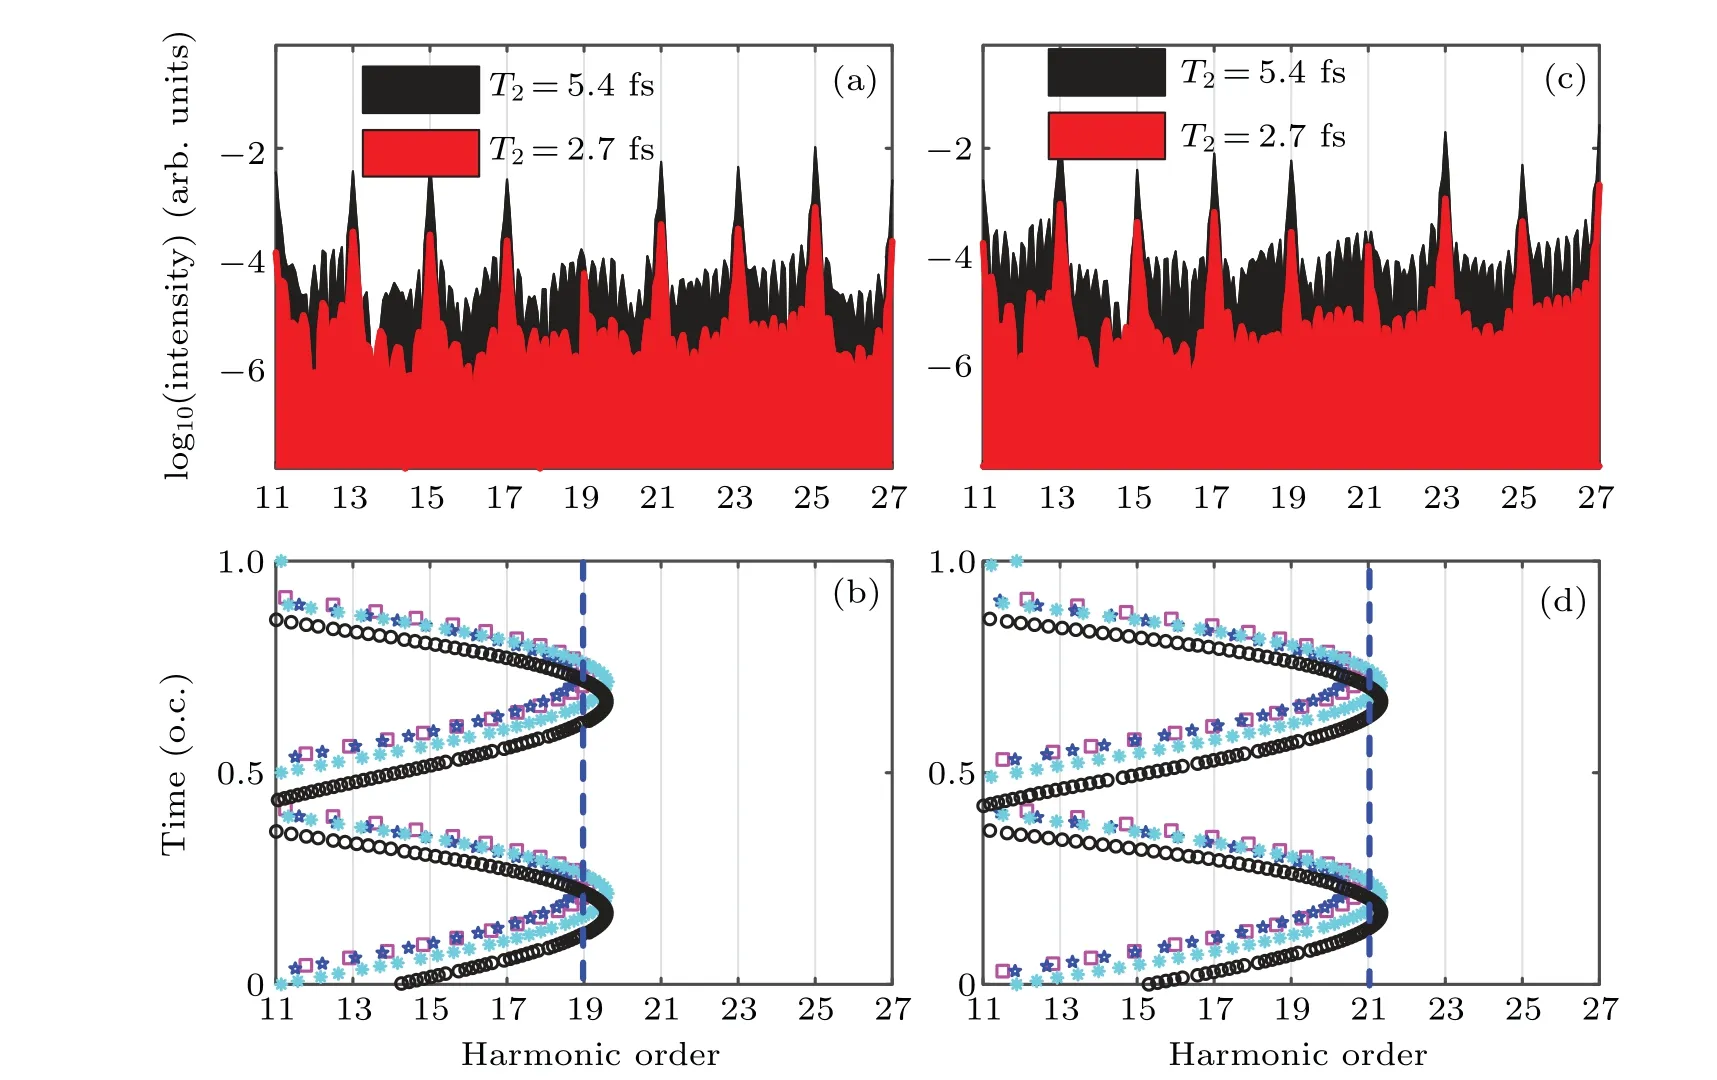
Fig.7.[(a),(b)]E0=0.0031 a.u.,[(c),(d)]E0=0.0035 a.u.[(a),(c)]The interband harmonic spectra calculated with T2=5.4 fs(black)and T2=2.7 fs(red),respectively. [(b),(d)]The collision energy as a function of the collision time. Only the second type of collision discussed in Fig.6 is shown. The blue dashed lines indicate the 19th harmonic in panel(b),and the 21st harmonic in panel(d). The collision events are numbered sequentially and coded in color and shape as follows: first(black circles),second(cyan asterisks),third(blue five-pointed stars),and fourth(magenta squares).
Figure 8 shows the phases of the collision trajectories shown in Figs. 7(b) and 7(d) as a function of the harmonic order. The phase of the trajectory is given by
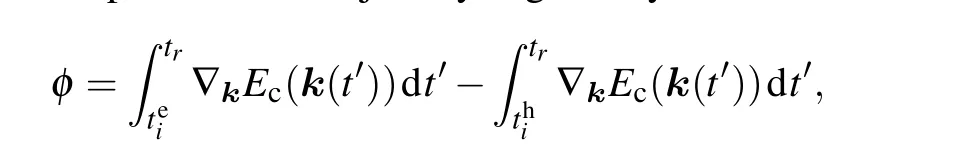
whereteiis the birth time of the electron,andthiis the birth time of the hole. It is clear that the phases of the four trajectories in Figs.8(a)–8(d)oscillate rapidly at around the 19th harmonic.Comparing with Fig. 7(b) the fast oscillation of these phases exactly corresponds to the overlap of the collision trajectories.In addition, the phases in Figs. 8(e)–8(h) oscillate rapidly at around the 21st harmonic,which also corresponds to the overlap of the trajectories in Fig.7(d). The disordered phases lead to the suppression of the relevant harmonics. Thus,taking into account the collisions between the electrons and holes born at different times but at the same position in real space, we can analyze the dynamics of the harmonic radiation comprehensively.
We consider the collisions between the electrons and holes which are born at the same time but at different positions in real space. The space intervals between the birth positions of the electrons and holes are−5 to 5 integral multiples of the lattice constant. Figure 9 exhibits the time–frequency analysis of the interband harmonic spectrum and the collision energy as a function of the collision time. The collisions shown in Fig. 9 have also been described in Fig. 3, and the laser field parameters are the same as those in Fig. 3. And the first(black circles), second(magenta asterisks), and third(blue five-pointed stars) collision events are considered. We can observe that the collision trajectories are in overall agreement with the quantum calculation results. For example, the collision trajectories coincide well with the regions where the intensity is high. Comparing with the recollision trajectories in Figs.6(b)and 6(c),these collision trajectories even perform better at the higher-order harmonic region. This finding has similar advantages to the extended method of imperfect recollision discussed in previous research.[43]
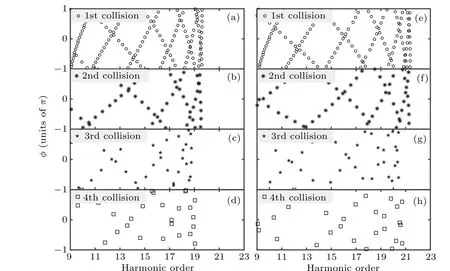
Fig.8. (a)–(b)E0=0.0031 a.u.,(e)–(h)E0=0.0035 a.u. (a)–(d)The phase of the collision trajectories which are shown in Fig.7(b)as a function of the harmonic order. (e)–(h)The phase of the collision trajectories which are shown in Fig.7(c)as a function of the harmonic order. The collision events are numbered sequentially and coded as follows: first(circles),second(asterisks),third(five-pointed stars),and fourth(squares).
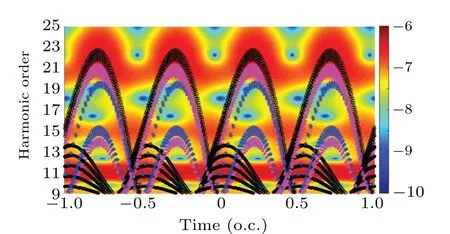
Fig. 9. Time–frequency analysis of the interband harmonic spectrum and the collision energy as a function of the collision time. The collisions occur between the electrons and the holes which are born at the same time but at different positions in real space. The initial spacing between the electrons and holes are all integer multiples of the lattice constant in[−5ax,5ax]. The collision events are numbered sequentially and coded in color and shape as follows: first (black circles), second (magenta asterisks), third (blue fivepointed stars). The laser parameters are the same as those in Fig.3.
From the above discussion, we can know that the multiple collision model plays an important role in analyzing the detailed results of quantum calculations. It is also a helpful supplement to the recollision model.
4. Conclusion
We investigated the interband harmonic radiation process of the crystal HHG by solving the one-dimensional SBEs in ZnO crystal. As the semiclassical reciprocal-space model and semiclassical recollision model cannot fully explain the quantum calculation results,we have discussed the contributions of the collisions between the electrons and holes which are born at different times. We found that considering both the recollision model and the multiple collision model is more consistent with the quantum calculation results. Moreover,the decoherence effect caused by the overlap of the multiple collision trajectories can make harmonic suppression. Based on the periodicity of solids, we also considered the collisions between the electrons and holes generated at the same time and at the positions spaced with integral multiples of the lattice constant.In this case, the collision trajectories show better agreement with the SBEs results than the recollision trajectories in highorder region. The multiple collision model can be used as a supplement to illustrate the details not reflected in the recollision model. All in all, the multiple collision model can help us comprehensively and better understand the interband harmonic radiation process in crystals.
Acknowledgements
Project supported by the National Natural Science Foundation of China (Grant No. 91850121) and the K. C. Wong Education Foundation(Grant No.GJTD-2019-15).

- Chinese Physics B的其它文章
- Editorial:Celebrating the 30 Wonderful Year Journey of Chinese Physics B
- Attosecond spectroscopy for filming the ultrafast movies of atoms,molecules and solids
- Advances of phononics in 20122022
- A sport and a pastime: Model design and computation in quantum many-body systems
- Molecular beam epitaxy growth of quantum devices
- Single-molecular methodologies for the physical biology of protein machines