
Assessment of Urban Climate Environment and Configuration of Ventilation Corridor:A Refined Study in Xi’an
2023-01-16 12:06BingDANGYonghongLIUHongliangLYUXiaZHOUWupengDUChunyiXUANPeiXINGRuoziYANGandFeilinXIONG
Bing DANG, Yonghong LIU, Hongliang LYU, Xia ZHOU, Wupeng DU, Chunyi XUAN, Pei XING,Ruozi YANG, and Feilin XIONG
1 Beijing Municipal Climate Centre, Beijing Meteorological Services, Beijing 100089
2 CMA Earth System Modeling and Prediction Centre, China Meteorological Administration (CMA), Beijing 100081
3 State Key Laboratory of Severe Weather, Chinese Academy of Meteorological Sciences, China Meteorological Administration, Beijing 100081
4 China Academy of Urban Planning and Design, Beijing 100044
ABSTRACT Integrating urban spatial landscape (USL) parameters into refined climate environment assessment is important. By taking the central urban area (CUA) of Xi’an, China as an example, this study develops an evaluation method based on Urban Climatic Map (UCMap) technology. We define surface urban heat island intensity (SUHI) and surface ventilation potential coefficient (VPC), which can effectively reflect local urban climate. Based on SUHI and VPC,we analyze the influences of seven typical USL metrics including building height (BH), building density (BD), floor area ratio (FAR), sky view factor (SVF), frontal area index (FAI), surface roughness length (RL), and vegetation cover (VC). Then, we construct a comprehensive evaluation model and create an urban climate zoning map on a 100-m resolution. The climate optimization on the map is performed for configuration of possible ventilation corridors and identification of associated control indicators. The results show that the main factors affecting SUHI in the CUA of Xi’an are VC and BD, which explain 87.9% of the variation in SUHI, while VPC explains 50% of the variation in SUHI. The main factors affecting VPC are BH, FAR, FAI, and RL, all of which contribute to more than 95% of the variation in VPC. The evaluation model constructed by SUHI, VPC, and VC can divide the CUA into climate resource spaces, climate preservation spaces, climate sensitive spaces, and climate restoration spaces. On this basis, a ventilation corridor network of 3 level-1 corridors (each over 500 m wide), 6 level-2 corridors (each over 500 m wide) and 13 level-3 corridors (each over 50 m wide) is established. Meanwhile, the main quantitative control indicators selected from the USL metrics are proved to be capable of ensuring smooth implementation of the planned corridors at different levels.
Key words: urban climatic map, ventilation corridor planning, urban spatial landscape metric, urban heat island, surface ventilation potential
1. Introduction
As of the end of 2020, China’s urbanization rate had reached 63.9%, and according to the United Nations estimate, China’s urbanization rate will reach 71.2% by 2050. While urbanization drives rapid economic and social development, it also breaks the constraints of the natural environment, so urban climate problems have become increasingly prominent (Kalnay and Cai, 2003;Haas and Ban, 2014). Some 40% of global warming since the late 1970s has been caused by rapid urbanization (Yang et al., 2011), and China’s urbanization contributes up to one-third of the warming (Sun et al., 2016)and about 69% of the weakening of near-surface wind speed (Zhao et al., 2016). The increase in temperature and the weakening of wind speed in urban areas are not conducive to heat diffusion or air flow, which in turn aggravates the urban heat island (UHI) effect and air pollution and ultimately affects the livability and sustainable development of cities. How to meet the demand for urban expansion while alleviating or even avoiding the adverse climatic impact caused by construction is a key issue facing urban planning in China in recent years. Scientific evaluation of urban climate and application of climate information in urban planning and construction can effectively improve the urban climate (Yuan, 2010; Ren et al.,2011). In particular, urban climatic maps (UCMaps), as an auxiliary information system tool for sustainable urban planning (Ren et al., 2012), have been widely used in urban climate assessment in the past two decades (Hong Kong Planning Department, 2009;Ren et al., 2013a,b;Yuan et al., 2016;Liu et al., 2017). The UCMaps are mainly composed of two parts: an urban climate analysis map (UCAnMap) and an urban climate planning recommendation map (UC-ReMap). The currently common urban climate zoning maps, UHI distribution maps,air pollution distribution maps, and urban meteorological disaster risk maps can each be regarded as UCAnMaps.Ventilation corridor planning maps are typical UCReMaps and are an energy-saving ecological approach to achieve local climate improvement in urban planning(Dang et al., 2017), with the aim of enhancing urban air mobility and promoting suburban air exchange, thereby alleviating UHI effects, reducing building energy consumption, and improving urban livability (Zhu et al.,2008;Zheng et al., 2012;Ren et al., 2014;Fang et al.,2015;Dang et al., 2021). Therefore, scientific and reasonable urban climate assessment is a prerequisite for urban ventilation corridor planning.
In terms of urban climate assessment, Germany was the first to conduct research on urban planning and the integration of climate factors. For the first time, existing climate problems were revealed through UCMaps, and climate factors were included in the initial stage of urban planning to ensure that land in climate-sensitive areas of cities could be built, used, and protected in a reasonable and legal manner. According to the local climatic conditions and urban spatial morphology characteristics, a cold source was made to communicate with the urban center,air ducts were set up, and construction suggestions were proposed. The relevant research results have been translated into planning guidelines and technical standards,which have been applied to urban planning and development and have been cited by countries around the world(Gal et al., 2009; Ren et al., 2012; Liu et al., 2015). In 2006, Hong Kong began to explore the preparation and reference of UCMaps. Through the use of more accurate digital geographic information data in combination with a series of field measurements and simulation experiments, the interactions and connections between highdensity urban morphology and the climate have become better understood, and nine urban ventilation zones were delimited according to the type and spatial distribution of the local ventilation system (Ren et al., 2007, 2014). In recent years, cities in China have started to carry out related research based on the advanced experiences of Germany and Hong Kong. He et al. (2014) preliminarily established a UCMap of Beijing based on its urban thermal pressure and ventilation potential. Du W. P. et al. (2016)further investigated the background wind environment,ventilation potential, and the influence of ventilation corridors on local microclimate in Beijing and designed a ventilation corridor system for the central urban area of Beijing in the context of future planning. Based on the relationship between urban morphology and climate in Nanshan District, Shenzhen, Yuan et al. (2016) constructed a high-resolution UCMap and used it to provide specialized planning recommendations in terms of a green space system and a ventilation corridor system. Jia(2018) proposed urban climate zoning planning strategies and guidelines based on the quantitative relationship between the urban environment and cooling/heating load in the main urban area of Tianjin. Zhao et al. (2019) classified Guangzhou’s climate into seven types based on the air quality, thermal load, and ventilation potential, and proposed brief planning measures for each type. Zhang et al. (2020) drew a UCAnMap of the Dalian coastal scenic area based on the thermal load and ventilation potential and compared and corrected the results garnered by the climate map by means of climatic numerical simulation.
Evidently, thermal and wind environments are the core elements of urban climate assessment and have become the key considerations for climate adaptive urban planning. However, urban planning departments often need more than the main factors influencing the local climate and their influence thresholds as a reference. Although most of the previous studies have found many environmental factors to affect local climate and their climate zoning assessments, not much consideration has been given to whether these factors are the main climate-influencing factors and how their influence thresholds can be incorporated into urban planning. Therefore, how to identify the main factors or indicators influencing the urban thermal and wind environments and integrate them into urban climate assessment models and urban planning is a scientific problem facing refined urban climate assessment projects. The development of refined climate zoning optimization guidelines and the selection of control indicators after the construction of ventilation corridors also depend on these influencing factors or indicators (Liu et al., 2020a).
Urban climates are influenced not only by the main local climatic background/meteorological conditions (Cheval et al., 2009; Du H. Y. et al., 2016), geographic topography (Bokwa et al., 2015; Liu et al., 2020a), and vegetation phenology (Walawender et al., 2014) but also by vegetation cover (VC), impervious cover (Imhoff et al.,2010; Connors et al., 2013), urban spatial patterns(Scarano and Sobrino, 2015; Yin C. H. et al., 2018; Liu et al., 2020b, 2021), and socioeconomic factors such as anthropogenic heat (Wang et al., 2017), GDP, and population (Liu et al., 2018). Due to these factors and the different development characteristics of different cities (Oke et al., 2020), the spatial distribution of climate characteristics in each city may be unique, likely resulting in the inconsistency of factors influencing the local climate and their influence thresholds. Therefore, in addition to taking into account the climatic and geographic context of a city itself, it is also necessary to consider as many factors related to the local urban spatial landscape (USL) as possible when carrying out urban climate assessment. Since most urban climate assessment studies have difficulty obtaining refined meteorological observation data and highresolution USL parameters within cities (Liu et al.,2021), the factors influencing the local urban climate under consideration are limited or inadequate, which makes it difficult to quantify and refine some important influencing factors (e.g., building height and floor area ratio)and to apply them to refined urban climate assessment and urban ventilation corridor planning guidelines.
In addition, urban climate research has region–city,city–block, and block–building spatial scale requirements (Grimmond and Oke, 1999). Accordingly, there are graded requirements for urban ventilation corridors(Ren, 2016). For example, the level-2 ventilation corridors in Beijing, Wuhan, Fuzhou, and Guangzhou have a minimum requirement in the range of 80–150 m (Liang et al., 2014; Zhan et al., 2015; Du W. P. et al., 2016; Yin and Zhan, 2017). The conventional meteorological elements such as wind and temperature obtained so far have all come from station observations or numerical simulations at scales of kilometres or more. Therefore, it is important for urban ventilation corridor planning to combine climate elements and USL parameters to carry out refined urban climate assessment with a spatial resolution not greater than 100 m.
To address the above problem, this study attempts to develop a refined climate assessment method that incorporates multiple USL parameters by considering the relationship between multiple USL metrics and urban thermal and wind environments based on UCMap technology at the urban scale. It aims to consider the main spatial factors influencing the local urban climate in a quantitative rather than qualitative manner as well as to select quantifiable indicators from the perspective of practical application value and apply them to the optimization guidelines of refined climate zoning and the construction of urban ventilation corridors. Taking the Xi’an downtown as a case example, this study proposes introducing high-density automatic meteorological station data, satellite remote sensing data, and high-resolution basic urban geographic information to conduct research on factors influencing urban thermal and wind environments. Then, based on the extraction of high-resolution USL parameters, the climate assessment models is established to construct a 100-m-scale urban climate zoning map and form urban climate zone optimization guidelines. On this basis, multi-level urban ventilation corridors are constructed and quantitative corridor control indicators are established, taking into account the urban characteristics, background wind environment, and future planning of Xi’an, to ensure the smooth implementation of ventilation corridor construction. This study can be a reference for other regions carrying out refined urban climate assessment as well as ventilation corridor planning and construction.
2. Overview of the study area
Xi’an (34.27°N, 108.93°E) is located in the central Guanzhong Plain in the middle of the Wei River basin in China (Fig. 1a). It is an important fulcrum at the east–west convergence of the “Belt and Road” and the core city of the Guanzhong Plain national urban agglomeration. It is 204 km long from east to west and 116 km wide from north to south, bordered by the Wei River and the Loess Plateau to the north and the Qinling Mountains to the south, and it has a topography that is high in the south and low in the north, with a drop of more than 1500 m from south to north. According to China’s Standard of Climatic Regionalization for Architecture (The State Bureau of Quality and Technical Supervision and Ministry of Construction of the People’s Republic of China, 1993), Xi’an is in a “cold region” in terms of building climate zones. The study area is the central urban area (CUA) of Xi’an (including the six districts, namely,Beilin, Xincheng, Lianhu, Yanta, Weiyang, and Baqiao),with a built-up area of approximately 920 km2. The landuse types are shown in Fig. 1b.

Fig. 1. Distributions of (a) topography and meteorological stations in Xi’an and (b) land-use types in the CUA.
3. Data and methods
3.1 Data
(1) Meteorological data: The air temperature and wind speed data were obtained from the hourly meteorological observation data of 37 meteorological stations (including national meteorological stations and regional automatic stations) in Xi’an and its surrounding areas from 2010 to 2018. The prevailing wind direction statistics came from 14 meteorological stations (7 national stations and 7 regional automatic stations) in Xi’an. In accordance with the requirements of technical standards and specifications related to climate feasibility demonstration (China Meteorological Administration, 2018a; China National Standardization Administration and Standardization Administration, 2019), the meteorological data used were all subject to data quality control and can be used for refined urban climate analysis.
(2) Satellite remote sensing data: The clear sky Landsat-8 OLI and TIRS sensor satellite data at 30-m spatial resolution (acquired in orbit 127/036) passing over Xi’an at about 1100 LT 25 July 2018 were derived from the Open Spatial Data Sharing Project of the Aerospace Information Research Institute, Chinese Academy of Sciences (http://ids.ceode.ac.cn/). These data were mainly used for VC estimation and SUHI calculation.
(3) Basic geographic data: The 1 : 2000 topographic map of Xi’an from 2015 (including the layers of residents and buildings) were obtained from the China Academy of Urban Planning and Design. It was mainly used for the estimation of urban spatial morphological factors.
3.2 Method for extracting USL parameters
The urban greening rate can explain 50% of the variation in the UHI in Xi’an (Xu et al., 2019), and thermal and wind environments may be influenced more by urban spatial morphological parameters than land surface parameters (Liu et al., 2020a, 2021). Therefore, in addition to VC, which is an important land surface parameter, we studied six typical urban spatial morphological parameters, namely, building height (BH), building density (BD),floor area ratio (FAR), sky view factor (SVF), frontal area index (FAI), and roughness length (RL). The meaning and calculation method of each parameter are shown in Table 1.
Thus, according to the parameter calculation methods in Table 1, BH, BD, FAR, RL, FAI, and SVF in the CUA of Xi’an at 100-m spatial resolution were estimated based on a storey height of 3 m and using the building location and floor information in the 1 : 2000 topographic map. The VC at 100-m spatial resolution were estimated by using the Landsat-8 satellite remote sensing images of Xi’an.

Table 1. Meanings and calculation methods of USL parameters selected in this study
3.3 Method for determining thermal environment factors
The urban thermal environment is mainly characterized by meteorological observations of air temperature and satellite observations of surface urban heat island(SUHI) (Stewart, 2011; Martin et al., 2015). Based on Landsat-8 satellite images, land-surface temperature is retrieved by using the single-channel algorithm proposed by Jiménez-Muñoz and Sobrino (2003), and then SUHI is calculated and divided into seven grades using the urban–rural dichotomy (China Meteorological Administration, 2018b). On this basis, the relationships between SUHI and land-use types as well as between SUHI and each USL metric are analysed using statistical regression to determine the main factors by influencing the urban thermal environment.
3.4 Method for determining wind environment factors
The urban wind environment generally includes the background wind environment and the surface ventilation potential. The background wind environment is mainly influenced by the climatic background and geographical and topographic characteristics, and it is most often assessed by meteorological observations or numerical simulations. In this study, the background wind environment is assessed by using the spatial distribution of the prevailing wind direction of the average wind speed and soft and light breeze based on the meteorological observation data of the study area. Here, wind with a speed of 0.3–3.3 m s−1is defined as a soft and light breeze (effective wind), i.e., a wind section with a pronounced corridor ventilation effect after deducting the no-wind and strong wind (China Meteorological Administration,2018b).
The surface ventilation potential is mainly related to the roughness of the urban underlying surface and the degree of openness of the surroundings (Hong Kong Planning Departmen, 2009). This study introduces the surface ventilation potential coefficient (VPC) and different VPC levels (Liu et al., 2019) to characterize the surface ventilation potential. The VPC can be estimated from RL and SVF and is in the unit of meters. On this basis, the relationship between the VPC with a spatial resolution of 100 m and each USL parameter is analyzed by using statistical regression to determine the main factors influencing the wind environment within the city.
3.5 Urban climate assessment and climate zoning
SUHI mainly reflects the thermal load caused by urban development, the VPC reflects the surface ventilation barriers created by urban-space buildings, and the VC reflects the information of local cold sources such as urban ecological greening and the availability of fresh,cold air. Therefore, we comprehensively assess the urban climate in Xi’an in terms of SUHI, VPC, and VC. The weight of each indicator is determined by the expert scoring method based on the importance of the three indicators in the local climate, and a comprehensive climate assessment model for the central urban area of Xi’an is established:

where CI is the comprehensive index of climate assessment. To estimate CI, we need to normalize the SUHI,VPC, and VC layers and then estimate the spatial distribution of the CI layer according to Eq. (1). Further, the CI values are divided from low to high into four categories, namely, climate resource space, climate conservation space, climate-sensitive space, and climate restoration space, using the natural breakpoint method (Yin X.D. et al., 2018) to form an urban climate zoning map with a spatial resolution of 100 m. The urban climate conditions are summarized according to different climate zones, and in combination with the earlier analysis,a map of the spatial distribution of the main factors influencing urban thermal and wind environments is obtained.Then, the guidelines for urban climate zone control units are proposed to achieve the goal of optimizing urban morphology and ecological space.
3.6 Construction of urban ventilation corridors
On the basis of the urban climate zoning map, a threelevel urban ventilation corridor system is devised for Xi’an with the goal of improving the climate restoration spaces and climate-sensitive spaces and by making full use of climate resource spaces and climate preservation spaces.It is necessary to consider the urban topographic characteristics, background wind environment, and VPC and SUHI distribution maps in the process of designing the corridors. After the design of the ventilation corridors,the main factors influencing the thermal and wind environments derived from the earlier analysis are used to determine the main control indicators and corresponding thresholds of the ventilation corridors at different levels,from the perspective of practical application, to ensure the smooth implementation of the ventilation corridors.
4. Results
4.1 Urban spatial morphological parameters
Figure 2 shows the distribution of morphological parameters BH, BD, FAR, RL, FAI, and SVF with a 100-m spatial resolution in the CUA of Xi’an. It can be seen that BH is below 60 m in most parts of the CUA, and there are few high-rise buildings (≥ 20 stories). BD is high in three districts (Beilin, Xincheng, and Lianhu) of the CUA, with FAR above 3.0 in some parts. SVF is below 0.4 in many parts of CUA due to the high density of buildings and significant mutual shading. FAI is below 1.50 in most parts of the CUA but above 0.85 locally,which exceeds the restriction requirement of FAI ≤ 0.85 in cold regions in the Chinese industry standard Design Standard for Thermal Environment of Urban Residential Areas (Ministry of Housing and Urban‒Rural Development of China, 2013). In addition, there will generally be barriers to urban ventilation if the surface RL is greater than 1.0 m. The fact that RL is greater than 1.0 m in many areas indicates that there are large areas of ventilation obstacles in the CUA.
4.2 Urban thermal environment
4.2.1Heat island intensity assessment
Figure 3b shows the spatial distribution of the SUHI levels at 100-m resolution in the CUA. It can be seen that in the summer of 2018, the strong SUHI level in the CUA corresponds to a large contiguous area and a high degree of aggregation, with almost all of Beilin,Xincheng, and Lianhu districts and most of Weiyang and Yanta districts at the strong SUHI level, showing a significant UHI effect. No obvious SUHI occurs in rivers and areas with high VC such as the Weiyang Palace Heritage Park and the Daming Palace National Heritage Park,while cold islands appear in areas with high VC, such as mountainous areas and hills.
4.2.2Analysis of thermal environment factors
The layout of urban land functions is a key consideration in urban planning. The influence of land-use type on SUHI is analyzed based on the land-use types in Fig. 1b and the SUHI in Fig. 3b. The results show that the SUHIs of commercial land and industrial land in the CUA are the highest, at 6.7 and 6.4°C, respectively; the SUHIs of cultural and educational land, residential land, transportation land, and bare land all are above 4.0°C; the SUHI of farmland is approximately 3.0°C; and the SUHI of forestland is the lowest (−3.1°C), followed by that of water body (−0.4°C), both of which play a role in mitigating the UHI effect. The land-use types in the CUA are mainly residential land and less water body and woodland, with VC below 20%. Therefore, the UHI effect is pronounced in the CUA, where UHI areas are concentrated and contiguous. It can be seen that the land function types of Xi’an largely determine the level of UHI intensity, and the rational layout of urban land function types is also an important element of the guidelines for optimizing the climate of Xi’an.
As can be seen from the regression analysis of SUHI with different USL parameters (Fig. 4), SUHI shows increasing trends with the increase in BH, BD, FAR, FAI,and RL and the decrease in SVF and VC (all of which are significant at the 99% confidence level). The individual contribution of each parameter to the change in SUHI (coefficient of determinationR2) is in the range of 55.3% to 85.5%, and the top three contributors to the change in SUHI are VC (85.5%), BD (75.1%), and SVF(68.6%).
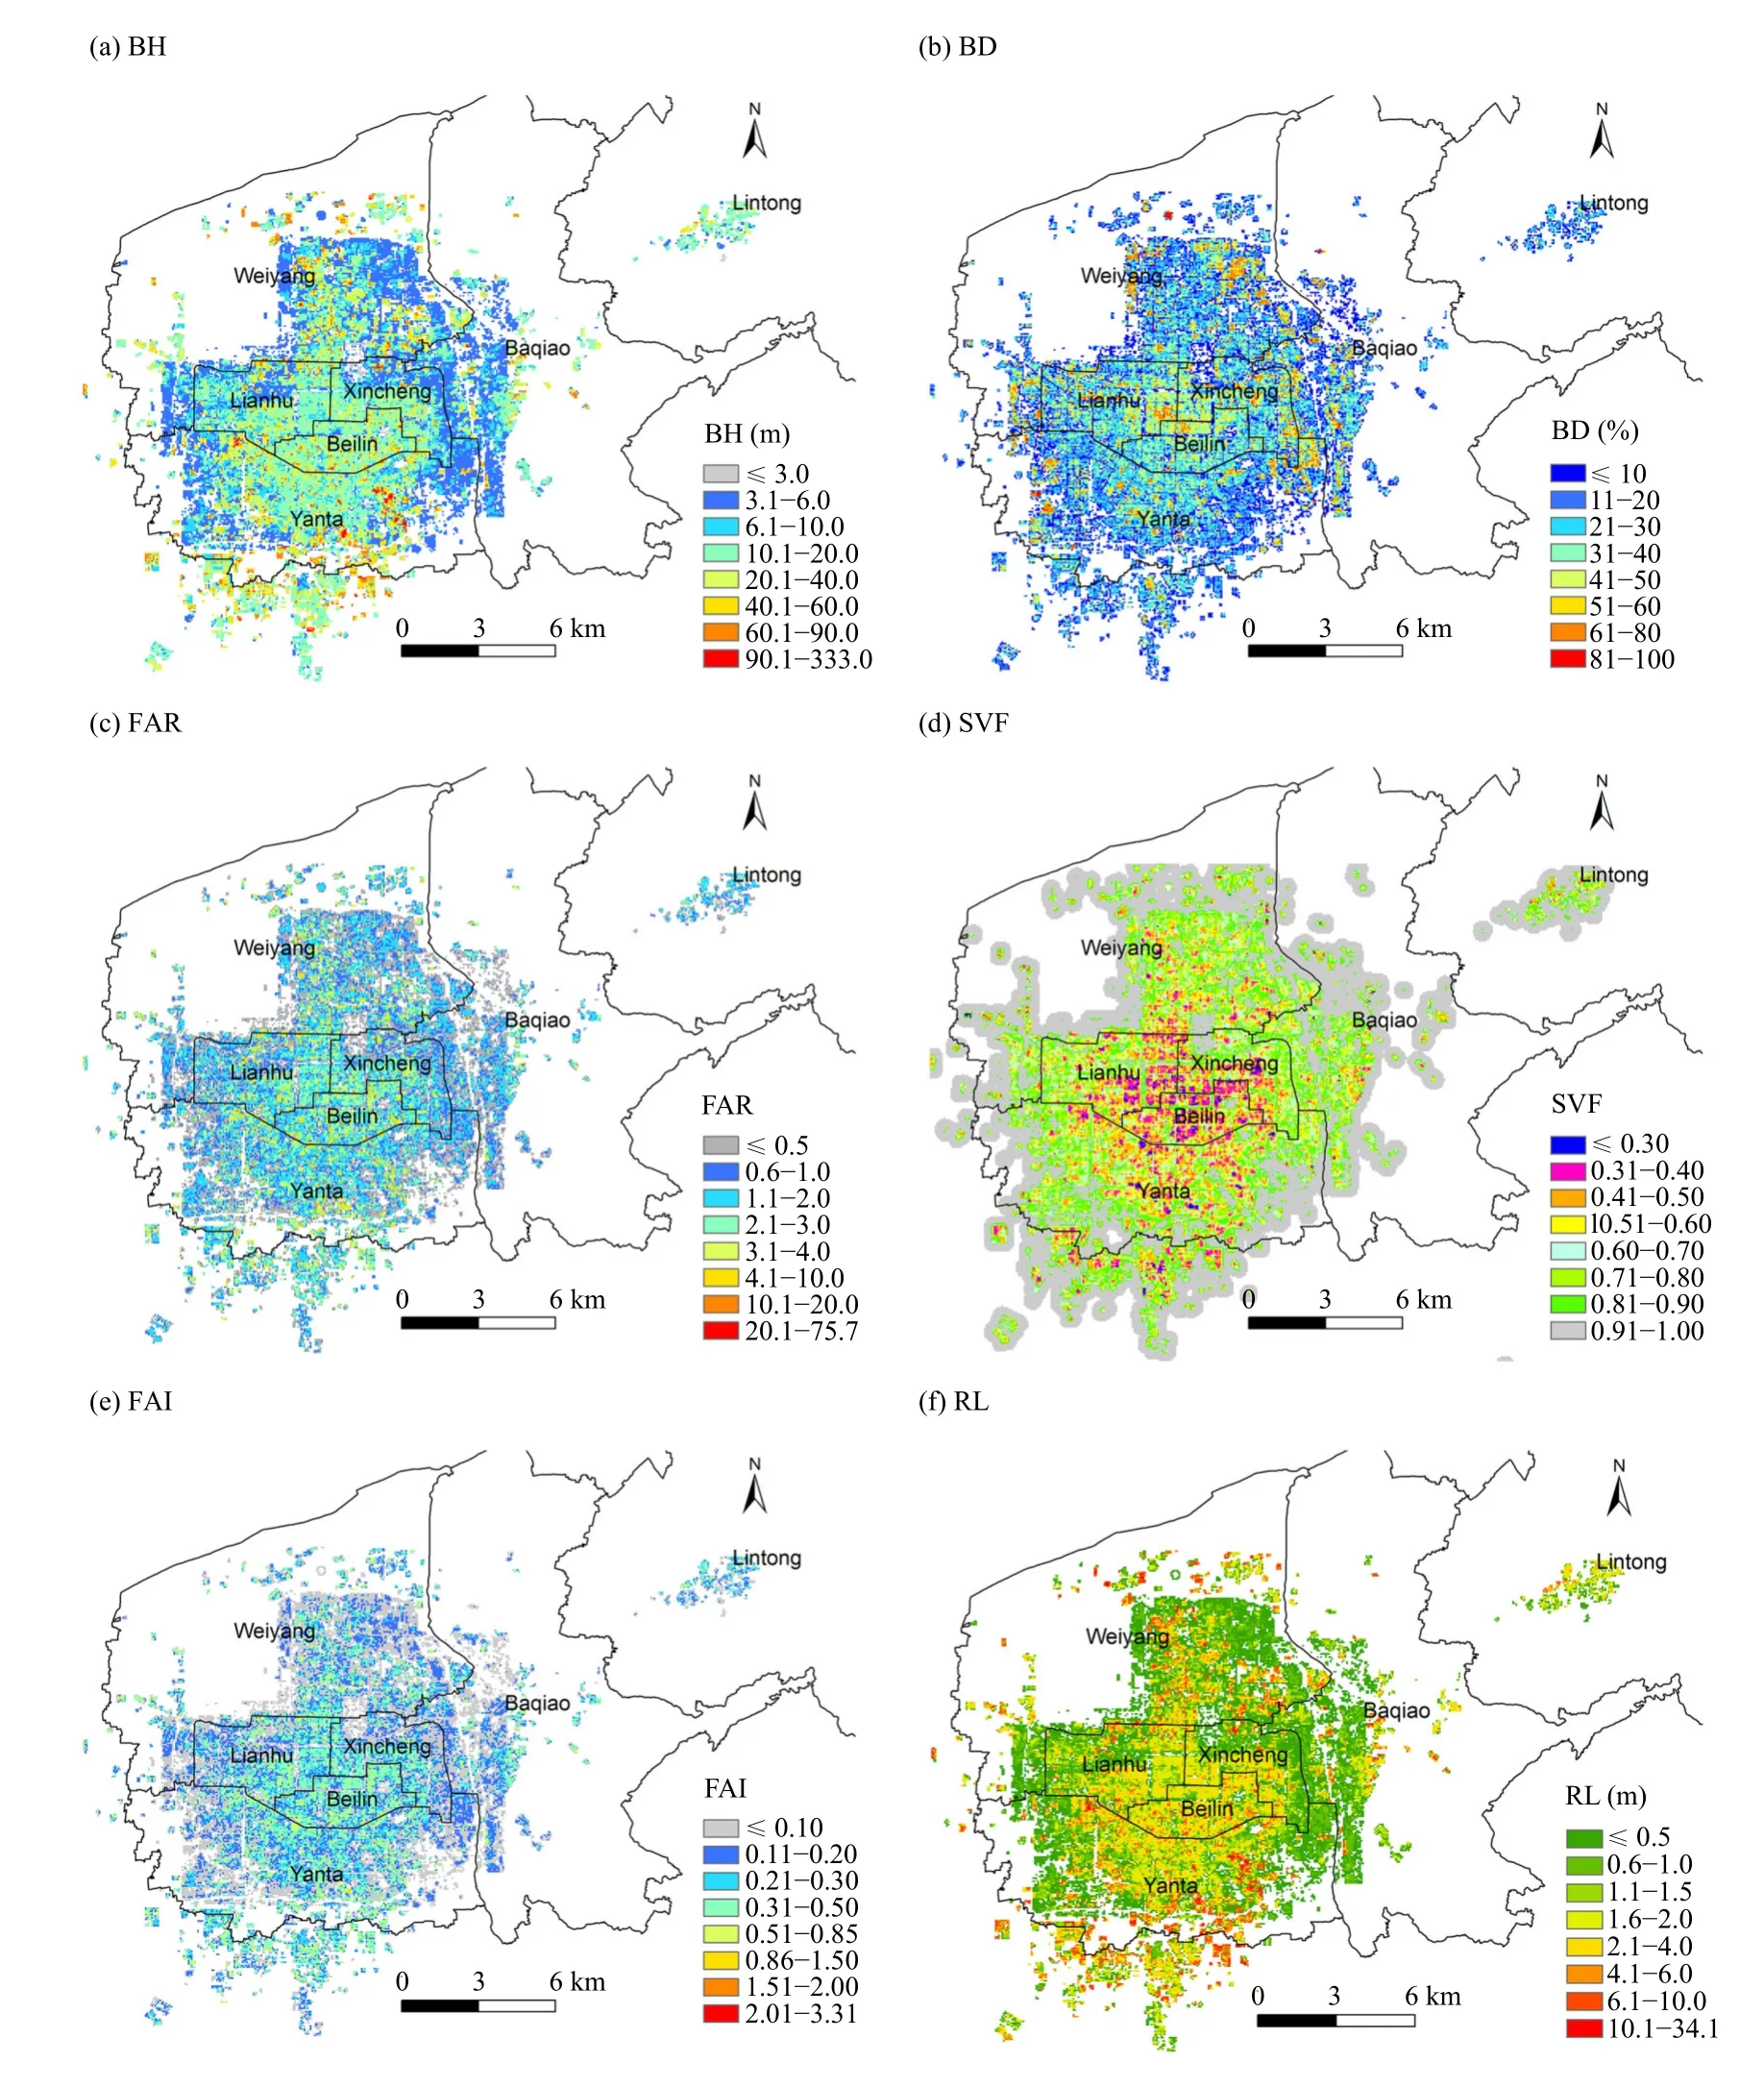
Fig. 2. Spatial distributions of main urban spatial morphological parameters at 100-m spatial resolution in the CUA of Xi’an in 2017.
Since the individual contribution of each factor to SUHI exceeds 50%, the threshold of the influence of each factor on SUHI is further determined. The factors corresponding to the states of weak UHI and below(SUHI ≤ 5°C) in Xi’an in summer need to satisfy BH ≤5 m, BD ≤ 14%, FAR ≤ 0.7, FAI ≤ 0.10, RL ≤ 0.46 m,SVF ≤ 0.8, and VC ≥ 0.30, i.e., no significant UHI effect will occur when these indicators meet the above conditions. The multiple stepwise regression model between the seven USL parameters and SUHI is:whereβrepresents the importance of each independent variable parameter to the change in SUHI. The greater the absolute value ofβ, the higher the importance.

It can be seen from the above equation that VC is the most important USL factor influencing the variation of SUHI in Xi’an in summer, followed by BD, and the two jointly can explain 87.9% of the variation in SUHI. The linear regression model shows that for every 10% increase in VC or 10% decrease in BD in summer, SUHI decreases by 2.0 and 1.5°C, respectively. The no-UHI effect (SUHI < 2°C) can be achieved when VC ≥ 50%, and the cold island effect (SUHI < −3°C) can be achieved when VC ≥ 70%. Therefore, VC and BD can be determined as the main reference indicators for UHI mitigation control in the urban planning of Xi’an.
4.3 Urban wind environment
4.3.1Background wind environment assessment
The assessment of the background wind environment shows that the topography is an important environmental factor influencing the local urban climate. Influenced by the topography of the Loess Plateau in the north and the Qinling Mountains in the south (Fig. 1a), the prevailing wind direction of soft breezes in each region of Xi’an mainly follows the topographic trend of the mountain range, with northeasterly wind dominating in the northeastern part of the city, easterly wind in the eastern part,westerly wind in the western part, and the intersection of northeasterly and westerly winds in the central urban area. The wind speed in the air inlet area in the northeast of Xi’an and the Wei River area in the north of the central urban area is high, while the wind speed in the central urban area is low. The average wind speed in Beilin District, Xincheng District, the eastern part of Lianhu District, and the central part of Yanta District is lower than 1.0 m s−1in the past decade, reflecting to a large extent that USL reduces the wind speed and produces a weak urban wind effect.
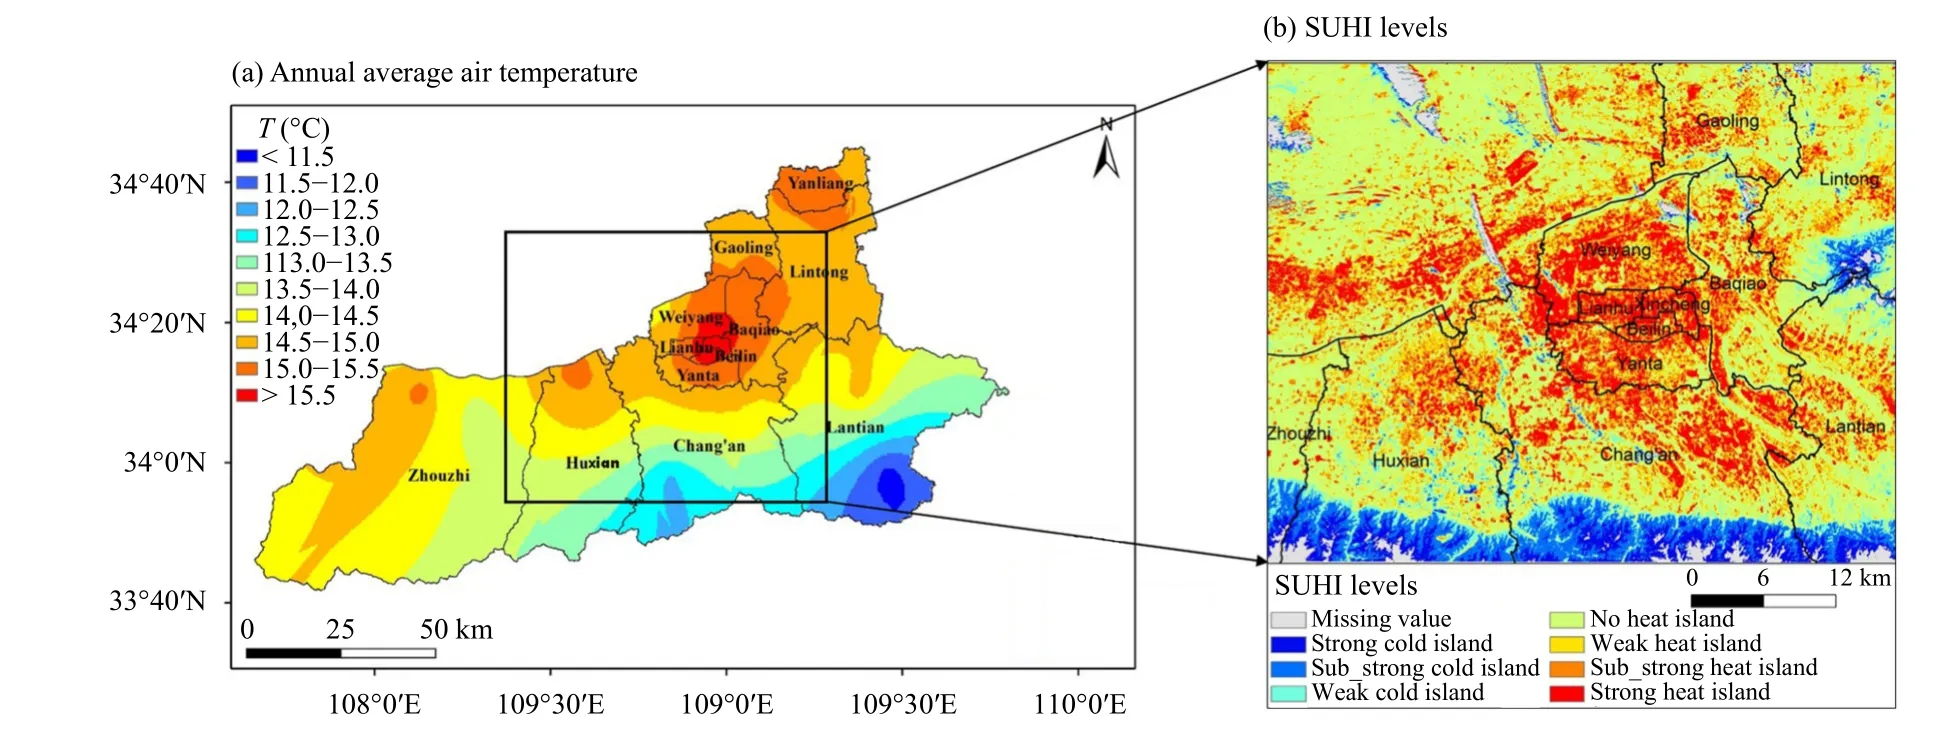
Fig. 3. Spatial distributions of (a) the annual average air temperature in Xi’an and (b) SUHI levels in the CUA.
4.3.2Assessment of surface ventilation potential
Figure 5a shows the VPC distribution in the CUA of Xi’an with a spatial resolution of 100 m. Most parts of the CUA have VPC above 1.5 m with poor surface ventilation potential. Especially in Beilin District, central Yanta District, southern and eastern Lianhu District, and western and southern Xincheng District, VPC is generally higher than 2.0 m and surface ventilation potential is very low, which is concentrated and contiguous. Considering the areas with high ventilation potential and connectivity, the least-cost path method, which advances along the grid areas with high ventilation potential (VPC≤ 0.5 m), can be used to identify multiple potential ventilation corridors. As shown in Fig. 5b, the areas with high ventilation potential in the CUA are mainly large parks or green spaces such as Ruins of Chang’an of Han Dynasty and the Baqiao Ecological Wetland as well as urban rivers such as the Wei River, Chan River, Ba River, and urban arterial roads. Whether these potential corridors can become the final ventilation corridors requires a consideration of their connectivity to adjacent areas, UHI mitigation needs, corridor construction/restoration costs,and other factors such as planning for green space (green corridor) planning.
4.3.3Factors influencing surface ventilation potential
The regression analysis of VPC with different influencing factors (Fig. 6) shows that VPC tends to increase with the increase in BH, BD, FAR, FAI, and RL and with the decrease in SVF and VC (all at a 99% confidence level). In particular, BH, FAR, FAI, and RL all individually contribute to more than 95% of the variation of VPC and significantly influence the urban surface ventilation potential. Since FAI and RL are rarely used indicators in urban planning, BH and FAR are identified as the main reference indicators for ventilation control in urban planning in Xi’an. The thresholds for the influence of BH and FAR on VPC are further determined. The indicator conditions corresponding to the states of high urban surface ventilation potential and above (VPC ≤ 0.5 m) in Xi’an are BH ≤ 2.5 m and FAR ≤ 0.35, i.e., an area with both indicators meeting these conditions has a high ventilation potential.
Further analysis of the influence of surface ventilation potential on UHI (Fig. 7) shows that there is a significant spatial correlation between VPC and SUHI and that the contribution of VPC to the variation of SUHI (coefficient of determinationR2) reaches 50%, indicating that the surface ventilation potential has a significant influence on UHI, with high urban ventilation facilitating UHI mitigation.
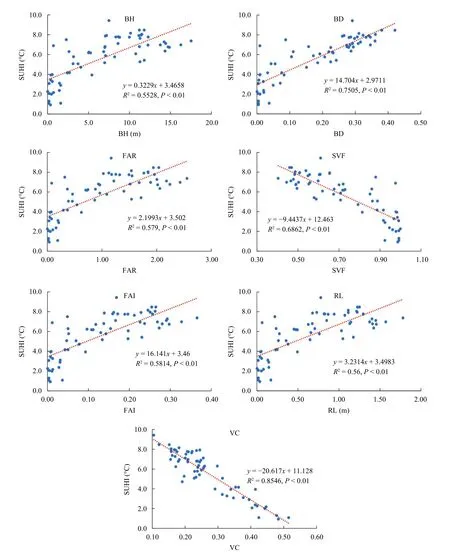
Fig. 4. Scatter plots and fitted regression models between SUHI and USL parameters (BH, BD, FAR, SVF, FAI, RL, and VC) in Xi’an (P <0.01 indicates that the fitted regression model is significant at the 99% confidence level).
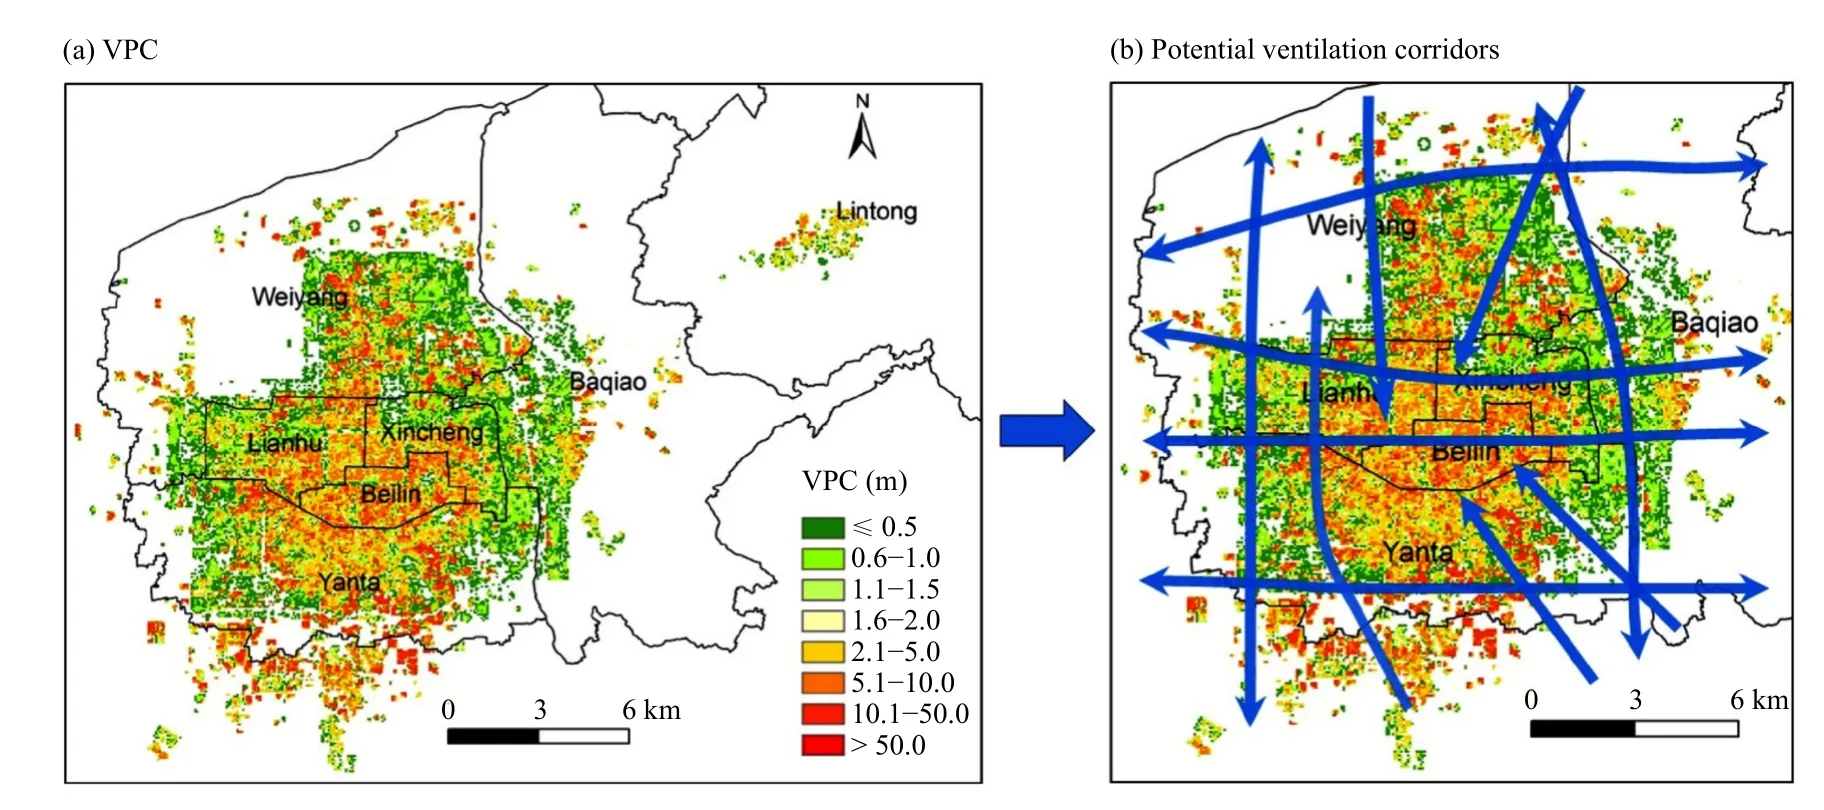
Fig. 5. Distribution characteristics of (a) surface ventilation potential in the CUA of Xi’an and identification of (b) potential ventilation corridors.
4.4 Urban climate zoning
Figure 8 shows the urban climate zoning map with a spatial resolution of 100 m for the CUA of Xi’an. According to the meaning of each category (climate resource spaces, climate preservation spaces, climate-sensitive spaces, and climate restoration spaces) classified by the comprehensive climate assessment index CI, the optimization guidelines for different climate zones are established by combining the urban planning with the values of the main indicators influencing the local climate obtained from the previous analysis, as shown in Table 2.There are many climate-sensitive spaces and climate restoration spaces distributed in the CUA. These spaces generally have strong UHIs and low ventilation potential,which need to be optimized and improved in the future urban planning and construction of ventilation corridors.In comparison, the climate resource spaces and climate preservation spaces are mainly located in the suburban and mountainous areas around the central urban area.These areas are generally the places where local cold air is generated or the cold air is introduced into the urban area, and they need to be fully protected and utilized in future urban planning and construction of ventilation corridors.
4.5 Urban ventilation corridors
4.5.1Design and selection
According to the climate zoning map of Xian (Fig. 8),with the goal of improving the climate restoration spaces and climate-sensitive spaces, and considering the background wind environment, the topographic characteristics of the mountains in the south and water in the north,and the future land use plan for 2020−2035, the following strategies are proposed for the construction of the ventilation corridor system in Xi’an: (1) Compliance with the prevailing wind from east to west: since the eastern part of the city is dominated by easterly winds,the western part by westerly winds, and the CUA by the intersection of easterly and westerly winds, the east–west corridor is designed to guide the fresh country air through the urban construction area. (2) Effective use of valley wind and water–land wind resources: the CUA and the mountainous areas in the south and the Wei River in the north give rise to valley wind and water–land wind due to thermal pressure, so a south–north corridor can be constructed to bring the cold source air from the mountainous areas and waters into the urban area,forming a grid corridor system with the east–west corridor to divide up the key climate-sensitive areas more effectively. (3) Reliance on road networks and rivers and the connection of urban ecological elements: rivers and streets that follow the corridor direction have good ventilation potential, and can effectively connect ecological cold sources within the urban area as corridor carriers to better channel the wind into the urban area to guide the wind and dissipate heat.
According to the above strategies, the “3 + 6 + 13”ventilation corridor system in Xi’an can be effectively constructed based on the urban climate zoning map, surface ventilation potential map, and topographic map in combination with the future land use planning map. As shown in Fig. 9 and Table 3, (1) relying on the areas with good natural conditions and high ventilation potential between the suburbs and the urban area, three regional Level One corridors (LOCs) are established between different areas in accordance with the prevailing wind, and six regional Level Two corridors (LTCs) are established between the suburbs and the CUA using the valley wind and water–land wind resources, forming a continuous,open, banded space with eco-environmental benefits,which can introduce much fresh air from the cold sources in the countryside to the CUA and meanwhile separate the contiguous construction of clusters in Xi’an. (2) Five east–west Level-Three corridors (LTHCs) within the CUA are established based on major roads, connecting ecological wetlands, country parks, and heritage parks on the east and west sides of the urban area. And eight north–south LTHCs are established within the CUA based on the Chan River, Ba River, Yu River, and urban roads,connecting the southern mountainous areas with the Wei River in the north, and using the tertiary ventilation corridors in the urban area to effectively connect the natural wind between the periphery and interior of the city.
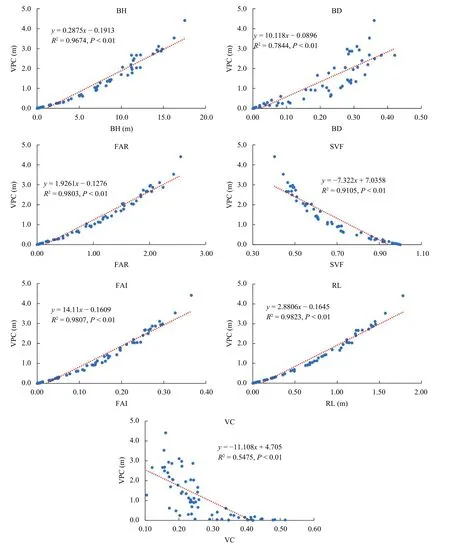
Fig. 6. Scatter plots and fitted regression models between VPC and USL parameters (BH, BD, FAR, SVF, FAI, RL, and VC) in Xi’an (P < 0.01 indicate that the fitted regression model is significant at the 99% confidence level).
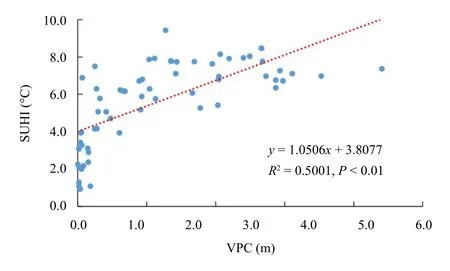
Fig. 7. Scatter plot and fitted regression model between VPC and SUHI in Xi’an (P < 0.01 indicates that the fitted regression model is significant at the 99% confidence level).
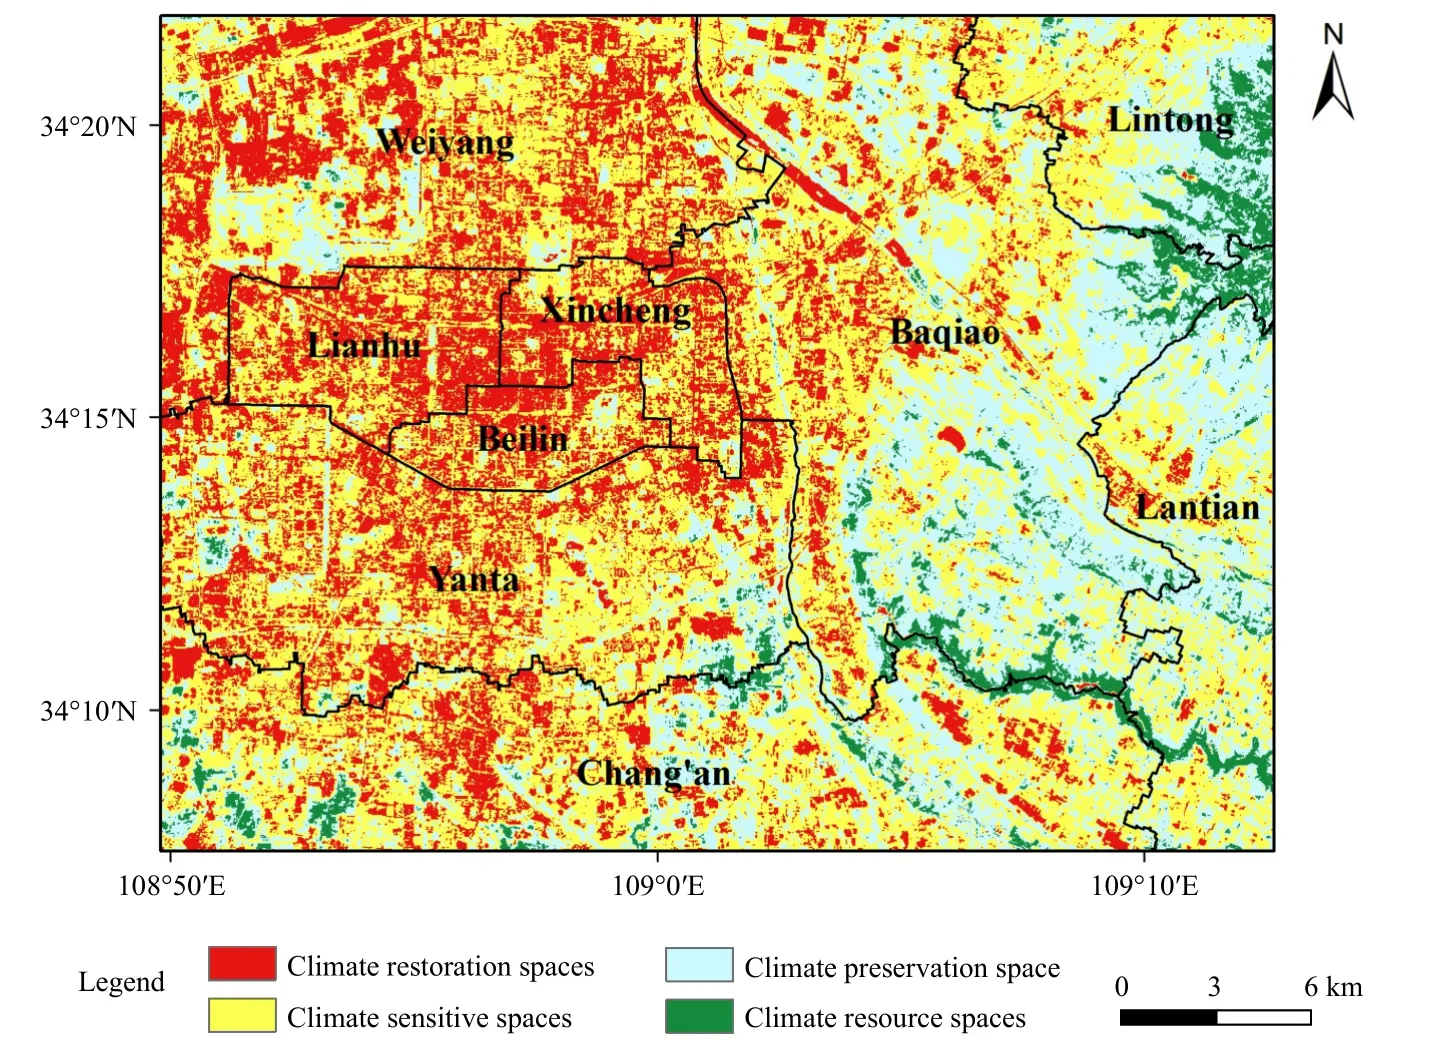
Fig. 8. Zoning map of urban climate in the CUA of Xi’an with a 100-m spatial resolution.

Fig. 9. The ventilation corridor system in the CUA of Xi’an (see Table 3 for the meaning of each ventilation corridor label).
To ensure the smooth implementation of this ventilation corridor system, the main control indicators and their thresholds for the corridor system at all levels can be determined (Table 3) considering practical applications based on the thresholds of the main factors influencing the urban climate of Xi’an obtained earlier and with reference to existing ventilation corridor construction indicators (Liu S. Y. et al., 2010;Li and Rong, 2014;Liang et al., 2014;Dang et al., 2017;Liu et al., 2020b).Therefore, by specifically implementing these control indicators in the future urban ecological restoration and corridor construction, we can effectively introduce natural wind into the high-density construction area, enhance air flow, and alleviate the local UHI environment, thus improving the current climate restoration spaces and climate-sensitive spaces. At the same time, the corridor land should be reasonably reserved in urban plans to prevent the UHIs from spreading into clusters and the ventilation capacity from decreasing due to intensive construction.
4.5.2Comparison with existing studies
Zhao and Liu (2014) calculated the construction width of the urban ventilation corridors based on the urban area and annual average wind speed of Xi’an. Based on the distribution of green space and rivers, they proposed five main ventilation corridors with ideal widths of 400–500 m, four of which correspond to combinations of LTCs and LTHCs of this study in Table 3: LTHC ⑦, LTC③–LTHC ⑨, LTC ④–LTHC ⑫, and LTC ⑥–LTHC⑬. Han (2021) preliminarily identified four main ventilation corridors in the CUA through the qualitative identification of potential urban ventilation areas and the simulation of the wind environment, which correspond to LTHCs ③, ④, ⑥, and ⑦ (Table 3) of this study. Compared with the above research methods and results of ventilation corridors in Xi’an, this study not only constructs a detailed three-level ventilation corridor system based on the refined climate zoning map on a 100-m scale but also plots intuitive and feasible wind corridor paths based on the actual situation, determines the implementable corridor widths, and calculates quantitative corridor control indicators according to the main influencing factors, indicating that the refined climate assessment method established in this study is more workable and practical for the construction of ventilation corridors,which has reference value and guiding significance for future urban planning.

Table 2. Climate zoning and optimization guidelines for the CUA of Xi’an

Table 3. Configuration information and control indicators of the ventilation corridor system in the CUA of Xi’an
5. Conclusions and discussion
5.1 Conclusions
(1) There are obvious UHIs in the CUA of Xi’an. The type of urban land function largely determines the UHI intensity (characterized by SUHI). The commercial land and industrial land have the highest SUHIs (6.7 and 6.4°C) in the CUA. The most important spatial factors influencing SUHI are VC and BD, which can explain 87.9% of the variation in SUHI. The urban ventilation potential has a significant influence on UHIs, and VPC can explain 50% of the variation in SUHI. There is no significant UHI effect when VC ≥ 0.30 and BD ≤ 14%.
(2) There is a significant low wind-speed area in the CUA of Xi’an. The main factors influencing the urban ventilation potential (characterized by VPC) are BH,FAR, and FAI, all of which contribute more than 95% to the variation in VPC. BH and FAR can be selected as control indicators in urban planning, and a high ventilation potential can be achieved when BH ≤ 2.5 m and FAR ≤ 0.35.
(3) According to the comprehensive index CI for urban climate assessment, made up of SUHI, VPC, and VC, the CUA of Xi’an can be divided into four categories,namely, climate resource spaces, climate preservation spaces, climate-sensitive spaces, and climate restoration spaces. Optimization guidelines for different climate zones can be established by using the main factors influencing the local climate derived from the earlier analysis.
(4) Based on refined climate zoning, a three-level ventilation corridor network system of 3 LOCs + 6 LTCs+ 13 LTHCs in Xi’an can be effectively constructed by taking into account urban topography and future planning. The main factors influencing the local climate can be used to determine the values of the control indicators of the corridors at different levels from the perspective of practical application, which is conducive to the smoothimplementation of ventilation corridor construction.
5.2 Discussion
This study develops a refined urban climate assessment method incorporating multiple USL parameters based on UCMap technology. The SUHI from satellite observations and the VPC indicator estimated from urban spatial morphological parameters are introduced into the urban climate assessment to carry out refined thermal environment assessment and surface ventilation potential assessment, respectively, and then a comprehensive urban climate assessment model is constructed by using the important surface parameter VC. Using this model, a climate zoning map with a spatial resolution of 100 m is established. On this basis, a three-level ventilation corridor system is constructed by combining the urban topographic characteristics and the background wind environment.Several typical high-resolution urban spatial morphological parameters are incorporated into the urban climate assessment to analyse the main factors influencing the urban thermal and wind environments, so as to provide quantitative references for the optimization guidelines of urban climate zones and the selection of ventilation corridor control indicators. These are the significant novelties of this study. Nevertheless, this study has the following limitations:
(1) Thermal environment assessment: This study only uses a Landsat image of a summer clear sky to estimate the SUHI, which cannot fully represent the average condition of UHIs throughout the whole summer. However,since the thermal environment assessment in urban planning pays more attention to the high thermal load, the SUHI observed by satellites under clear weather conditions can still truly reflect the climatic effect of the refined local thermal load caused by the changes in the urban underlying surface, but there is still a gap between this and the real thermal load perceived by the human body, such as human physiological equivalent temperature and human thermal comfort. In the future, it is necessary to include “people-oriented” thermal load indicators related to human perception, so as to reflect the urban thermal load more realistically and reasonably.
(2) Ventilation potential assessment: The assessment of surface ventilation potential is the focus of comprehensive assessments of the urban climate, and there is still some uncertainty in our estimate of urban surface ventilation potential using RL and SVF. This is because the current estimation of RL in urban areas generally considers only buildings and ignores the influence of urban vegetation. Therefore, a more scientific method for urban ventilation potential assessment needs to be developed.
(3) Urban climate zoning: This study mainly carries out urban climate zoning in terms of thermal environment, wind environment, and urban VC, which are not fully representative of urban climate conditions such as air quality and meteorological disaster risk. Therefore, it is necessary to consider more urban climate factors to devise a more scientific spatial classification of the urban climate. In addition, there is a certain degree of subjective uncertainty in the classification of the comprehensive climate assessment index CI, and whether the meaning of each climate space category matches the comfort level of local residents needs to be verified by field measurements and questionnaire surveys. It will be necessary to conduct detailed technical assessment and verification of these climate spatial categories to obtain more representative results.
(4) Verification of the performance of ventilation corridors: The local climate effects (ventilation effect and UHI mitigation effect) of urban ventilation corridors are also the focus of local urban climate research. This study has not yet verified the performance of ventilation corridors after their implementation. The use of field observation tests and numerical simulation techniques to verify and simulate the performance of corridor ventilation and UHI mitigation needs to be carried out after the planning of urban ventilation corridors.
 Journal of Meteorological Research2022年6期
- Journal of Meteorological Research的其它文章
- Record Flood-Producing Rainstorms of July 2021 and August 1975 in Henan of China:Comparative Synoptic Analysis Using ERA5
- Interdecadal Variability of Summer Precipitation in Northwest China and Associated Atmospheric Circulation Changes
- A New Hybrid Machine Learning Model for Short-Term Climate Prediction by Performing Classification Prediction and Regression Prediction Simultaneously
- Surface Weather Parameters Forecasting Using Analog Ensemble Method over the Main Airports of Morocco
- Impacts of the Urban Spatial Landscape in Beijing on Surface and Canopy Urban Heat Islands
- Effect of Using Land Use Data with Building Characteristics on Urban Weather Simulations: A High Temperature Event in Shanghai