
Neuronal nitric oxide synthase/reactive oxygen species pathway is involved in apoptosis and pyroptosis in epilepsy
2023-01-21 04:42XiaoXueXuRuiXueShiYuFuJiaLuWangXinTongShiQiZhangNaWangMeiXuanLiYuTongWeiWangMiaoHeBingYangLiuGuiLanChenFengGuo
中国神经再生研究(英文版) 2023年6期
Xiao-Xue Xu,Rui-Xue Shi,Yu Fu,Jia-Lu Wang,Xin Tong,Shi-Qi Zhang,Na Wang,Mei-Xuan Li,Yu Tong,Wei Wang,Miao He,Bing-Yang Liu,Gui-Lan Chen,,Feng Guo,
Abstract Dysfunction of neuronal nitric oxide synthase contributes to neurotoxicity,which triggers cell death in various neuropathological diseases,including epilepsy.Studies have shown that inhibition of neuronal nitric oxide synthase activity increases the epilepsy threshold,that is,has an anticonvulsant effect.However,the exact role and potential mechanism of neuronal nitric oxide synthase in seizures are still unclear.In this study,we performed RNA sequencing,functional enrichment analysis,and weighted gene coexpression network analysis of the hippocampus of tremor rats,a rat model of genetic epilepsy.We found damaged hippocampal mitochondria and abnormal succinate dehydrogenase level and Na+-K+-ATPase activity.In addition,we used a pilocarpine-induced N2a cell model to mimic epileptic injury.After application of neuronal nitric oxide synthase inhibitor 7-nitroindazole,changes in malondialdehyde,lactate dehydrogenase and superoxide dismutase,which are associated with oxidative stress,were reversed,and the increase in reactive oxygen species level was reversed by 7-nitroindazole or reactive oxygen species inhibitor N-acetylcysteine.Application of 7-nitroindazole or N-acetylcysteine downregulated the expression of caspase-3 and cytochrome c and reversed the apoptosis of epileptic cells.Furthermore,7-nitroindazole or N-acetylcysteine downregulated the abnormally high expression of NLRP3,gasdermin-D,interleukin-1β and interleukin-18.This indicated that 7-nitroindazole and N-acetylcysteine each reversed epileptic cell death.Taken together,our findings suggest that the neuronal nitric oxide synthase/reactive oxygen species pathway is involved in pyroptosis of epileptic cells,and inhibiting neuronal nitric oxide synthase activity or its induced oxidative stress may play a neuroprotective role in epilepsy.
Key Words: apoptosis;bioinformatics analysis;cell death;epilepsy;nitric oxide synthase;oxidative stress;pyroptosis;RNA sequencing;Tremor rat;weighted gene co-expression network analysis
From the Contents
Introduction 1277
Methods 1278
Results 1279
Discussion 1281
Introduction
Epilepsy is a neurological disease that causes abnormal neuronal discharge and affects approximately 0.5–1% of the population worldwide (Chen et al.,2020a;Singh et al.,2020;Bandopadhyay et al.,2021).It is characterized by spontaneous recurrent seizures,which contribute to damage in various brain regions.Currently,the knowledge gap in epilepsy pathogenesis remains wide owing to the diverse processes involved.Therefore,investigating the underlying mechanism of epileptogenesis is of great importance for disorder management and therapeutic strategy development.
Nitric oxide (NO) affects numerous pleiotropic functions in pathological and physiological processes.The role of NO depends on many factors,and the initiation and progression of neuronal cell death caused by oxidative stress is a cytotoxic effect of NO in numerous neurological pathologies (Sharma et al.,2019;Sadaf et al.,2020).Neuronal NO synthase (nNOS) is abundant in the central nervous system (Zhu et al.,2016).It colocalizes with Ca2+/calmodulin-dependent protein kinase II (CaMKII) and switches NO generation to superoxide production through CaMKII-catalyzed phosphorylation (Araki et al.,2020;Wang et al.,2021a).The distribution of nNOS is also associated with epilepsy-related alterations,such as neural cell apoptosis,neurotoxicity,and synaptic flexibility (Dreyer et al.,2004;Rajasekaran,2005;Wang et al.,2019).Evidence suggests that nNOS participates in epileptogenesis.An increase in nNOS levels was reported in an electrical stimulation-induced status epilepticus mouse model and kainic acid-induced seizure rat models(Catania et al.,2003;Cosgrave et al.,2008).Blocking nNOS activity increases the epileptic threshold,which suggests an anticonvulsant effect of nNOS inhibition (Akyuz et al.,2021).However,the precise roles and underlying mechanisms of nNOS in seizures remain unclear.
Dysfunctional NOS enables the overproduction of reactive oxygen species(ROS) and reactive nitrogen species,leading to excess oxidative stress.Mitochondrial oxidative stress disturbs redox homeostasis and triggers cell death,such as apoptosis and pyroptosis,thereby implicating neuronal cell loss in epilepsy (Mao et al.,2019;Yang et al.,2020;Shi et al.,2021).The longlasting opening of the mitochondrial transition pores facilitates the release of cytochrome c into the cytoplasm,subsequently activating the caspasedependent apoptotic pathway.Cellular apoptosis has been widely observed in epileptic animal and cellular models (Chen et al.,2019;Liu et al.,2019;Zhu et al.,2021b).Unlike apoptosis,pyroptosis is mainly mediated by inflammatory caspases.Canonical pyroptosis includes caspase-1 cleavage,gasdermin-D(GSDMD) activation,and nucleotide-binding oligomerization domain-like receptor family pyrin domain-containing 3 (NLRP3) inflammasome formation(Shi et al.,2015;Nozaki et al.,2022).In patients with medial temporal lobe epilepsy,an activated nucleotide-binding oligomerization domain-like receptor family pyrin domain-containing 1/caspase-1 cascade implies a vital role for pyroptosis in seizure-induced degenerative processes (Tan et al.,2015).Moreover,a recent bioinformatic analysis identified a correlation between neural pyroptosis and epileptiform activity,which was validated by an increase in GSDMD expression in a kainic acid-induced seizure mouse model (Xia et al.,2021a;Du et al.,2022).Nevertheless,the function of nNOS and nNOS-related pathways in apoptosis or pyroptosis in epilepsy has not been demonstrated.
The tremor rat (TRM;tm/tm) is an epilepsy model cultivated in a Wistar Kyoto colony.The TRM exhibits absence-like seizures without external stimuli,similar to human epilepsy.This model has been used in several seizure-related studies (Xu et al.,2014;Lv et al.,2015;Serikawa et al.,2015;Xu et al.,2016).Altered expression and distribution of phosphorylated CaMKII in different brain subareas of the TRM were also previously reported.In the present study,we aimed to further explore the role of nNOS and nNOS-dependent pathways in epileptic modelsin vivoandin vitroby combining bioinformatics analysis and laboratory experimentation.
Methods
Animals and ethics statement
All animal experimental protocols were approved by the Institutional Animal Care and Use Committee of China Medical University (approval No.CMU2 021303;approval date: May 14,2021).Healthy Wistar rats (n=25,male and female,9–12 weeks,250–300 g,specific pathogen-free level)were obtained from the Center for Experimental Animals of China Medical University (Shenyang,China;license No.SYXK (Liao) 2018-0008).TRMs(RRID: RGD_1302702) were gifted by Kyoto University and were raised at China Medical University.All animals were maintained in individual cages in a controlled environment (12/12-hour light/dark cycle,50–70% humidity,24°C).Food and water were provided ad libitum.Identification of TRM was determined using polymerase chain reaction with designed primers.TRMs and control ratswere randomly selected as experimental animals (Xu et al.,2013,2014).Suffering or distress was minimized to the greatest extent possible without affecting the experiment.All experiments were designed and reported according to the Animal Research: Reporting ofIn VivoExperiments(ARRIVE) guidelines (Kilkenny et al.,2010).A flowchart of the experimental design is shown inAdditional Figure 1.
Animal tissue collection
TRMs (n=4) and control rats (n=4) were deeply anesthetized by sodium pentobarbital (45 mg/kg,intraperitoneal injection (Takehana et al.,2017),Xiya Reagent,Linyi,China).The hippocampus was separated from the brain and collected for RNA sequencing and analysis of succinate dehydrogenase(SDH) and Na+-K+-ATPase activities.
To observe the mitochondrial structure,TRMs and control rats were deeply anesthetized by sodium pentobarbital and transcardially perfused with 4%paraformaldehyde and 2% glutaraldehyde.The hippocampus was obtained.
RNA sequencing
Total RNA was extracted using the TRIzol reagent (Invitrogen,Carlsbad,CA,USA).After RNA purification and quality control,RNA sequencing was performed using a Hiseq X 10 sequencer (Illumina,San Diego,CA,USA) by Wuhan SeqHealth Technology Company (Wuhan,China).The gene expression matrices of the TRM and controls were then obtained.
Weighted gene coexpression network analysis and functional enrichment analysis of key modules
The full gene expression profile was analyzed using the weighted gene coexpression network analysis (WGCNA) R package (R version 4.0.3,the R foundation,Vienna,Austria) (R Core Team,2021) to identify the key module highly associated with TRM epileptogenesis.Initially,a soft threshold,which is the lowest value for obtaining a relatively high scale-free network without batch effects when the degree of independence is greater than 0.9,was determined.The weighted adjacency matrix was then transformed into a topological overlap measure matrix to measure the connectivity of a gene in the network.Finally,according to the topological overlap measure dissimilarity,genes with similar expression profiles were grouped into different modules to generate a clustering dendrogram through linkage hierarchical clustering.Gene Ontology (GO) enrichment analyses of genes in key modules were performed using the Database for Annotation,Visualization,and Integration Discovery (DAVID,https://david.ncifcrf.gov) (Huang et al.,2009;Sherman et al.,2022).APvalue of < 0.05 was set as the cutoff criterion in each category.The top ten records for each category (biological process,cellular component,and molecular function) were visualized using the“ggplot2” package (Hao et al.,2022;Wu et al.,2022).
Transmission electron microscopy
To observe mitochondrial ultrastructure,the hippocampus was fixed in precooled 2.5% glutaraldehyde for at least 3 hours.After three washes with phosphate-buffered saline (PBS),the tissue samples were treated with 1% osmium tetroxide and 1% uranyl acetate.Following dehydration with different concentrations of ethanol (50%,60%,70%,80%,90%,and 100%)and acetone,the tissue slices were embedded in Durcupan resin for 3 days.The cornu ammonis (CA)3 subfield was then trimmed,and ultrathin sections of 60–70 nm thickness were placed on a grid coated with Pioloform.The sections were counterstained with 1% uranyl acetate and 0.3% lead citrate.Serial images were captured using a transmission electron microscope (H-7650,Hitachi,Tokyo,Japan) for further analysis.
Measurement of SDH and Na+-K+-ATPase activities
The hippocampus was rinsed with cold saline.The tissue was homogenized in prechilled Mito-Cyto solution (Mitochondria Isolation Kit,C0010-50,Applygen Technologies Inc.,Shenzhen,China) for mitochondrial extraction.The homogenate was then centrifuged at 800 ×gfor 10 minutes at 4°C,and the supernatant was collected and re-centrifuged at 12,000 ×gfor 10 minutes at 4°C.The pellet was then resuspended in Mito-Cyto solution.The procedures for the quantitative detection of SDH (A022-1-1,Nanjing Jiancheng Bioengineering Institute,Succinate Dehydrogenase Assay Kit,Nanjing,China) and Na+-K+-ATPase activity (Nanjing Jiancheng Bioengineering Institute,Na+-K+-ATPase assay kit,A070-2-2) were in strict accordance with the manufacturer’s instructions.
Cell culture and drug treatment
Dulbecco’s modified Eagle medium/nutrient mixture F-12 (Gibco,Shanghai,China) supplemented with 10% fetal bovine serum (Cat# 04-001-1A,Biological Industries,Kibbutz Beit-Haemek,Israel),100 U/mL penicillin(MRC,Changzhou,China),and 100 μg/mL streptomycin (MRC) were used for the maintenance of Neuro-2A (N2a) cells (Cat# CL0383,Hunan Fenghui Biotechnology Co.,Ltd.,Changsha,China) at 37°C and in a 5% CO2incubator(SANYO,Fuji,Japan).To perform cell counting assays,N2a cells were seeded at 2.1 × 10⁴cells/cm2,and 24 hours later,the culture medium was supplemented with 0.001,0.01,0.1,1,10,100 μM and 1 mM 7-nitroindazole (7-NI;Cat#638854,Sigma-Aldrich,St.Louis,MO,USA) or vehicle control for 24 hours.To induce epilepsy-like damage,12 mM pilocarpine (PILO;Cat# B1816,APExBIO,Houston,TX,USA) was added to the cell medium for 24 hours.To inhibit nNOS activity,N2a cells were pretreated with 100 μM 7-NI for 2 hours and then cultured in medium containing PILO.To inhibit ROS activity,N2a cells were pretreated with 2.5 mM acetylcysteine (NAC;Cat# HY-B0215,MCE,St.Louis,MO,USA) for 2 hours and then cultured in medium containing PILO.To block both nNOS and ROS activity,N2a cells were pretreated with 100 μM 7-NI and 2.5 mM NAC for 2 hours and then cultured in medium containing PILO.
Cell counting kit-8 assay
Cell viability was analyzed using the cell counting kit-8 (CCK8) assay (Beyotime Institute of Biotechnology,C0038),according to the manufacturer’s instructions.The N2a cells were seeded in a 96-well plate,and 10 μL CCK8 reagent was added to each well.An absorbance at 450 nm,indicating cell viability,was measured using a microplate reader (BioTek,Burlingdon,VT,USA).
Malondialdehyde,lactate dehydrogenase,and superoxide dismutase contents
To measure the levels of malondialdehyde (MDA),lactate dehydrogenase(LDH) and superoxide dismutase (SOD),hippocampal homogenates from the TRM and control rats were prepared.The N2a cell lysates from different groups (dimethyl sulfoxide [DMSO],PILO-treated,PILO and 7-NI co-treated)were collected in prechilled PBS after centrifugation for 10 minutes at 92×g.MDA,LDH,and SOD levels were measured using the corresponding commercial kits (Beyotime Institute of Biotechnology,Lipid Peroxidation MDA Assay Kit,S0131S;LDH Cytotoxicity Assay Kit,C0016;Total Superoxide Dismutase Assay Kit with WST-8,Haimen,China,S0101S) according to the manufacturer’s instructions.
ROS generation
ROS generation was detected using the ROS Assay Kit (Beyotime Institute of Biotechnology,S0033S) according to the manufacturer’s instructions.In brief,after removing the medium,the cells were loaded with 2′,7′-dichlorodihydrofluorescein diacetate (DCF-DA,10 μM) without serum and incubated for 20 minutes at 37°C.Each sample was subsequently analyzed using a fluorescence microscope (Olympus IX71,Tokyo,Japan).The relative ROS levels were then analyzed using ImageJ (1.37v,National Institutes of Health,Bethesda,MD,USA;Schneider et al.,2012).
TdT-mediated dUTP nick-end labeling staining
To investigate cell apoptosis,TdT-mediated dUTP nick-end labeling (TUNEL)staining was performed using the One-Step TUNEL Apoptosis Assay Kit(Beyotime Institute of Biotechnology,C1088) according to the manufacturer’s instructions.In brief,N2a cells were washed with PBS twice and then incubated in the TUNEL reaction mixture for 60 minutes at 37°C in the dark.Nuclei were stained with 4′,6-diamidino-2-phenylindole (DAPI;Beyotime Institute of Biotechnology,1:200,C1002) for 2 minutes.The cells were then observed using a confocal microscope (A1-R,Nikon,Tokyo,Japan).ImageJ was used to calculate the average fluorescence intensity.Apoptosis index was calculated as follows: the average fluorescence intensity of TUNEL-positive cells from different treatments/the average fluorescence intensity of TUNELpositive cells from untreated cells of controls × 100%.
Immunofluorescence
To observe the distribution of nNOS and NRLP3,morphological observations were performed according to a previously described process with several modifications (Xu et al.,2013).For tissue section analysis,the brains of the TRM and control rats were dissected and fixed in 4% paraformaldehyde.Serial coronal sections (20 μm thick) were cut using a cryostat.To observe the distribution of pyroptosis marker NLRP3,N2a cells plated on coverslips coated with poly-D-lysine (P6407,MilliporeSigma,St.Louis,MO,USA) were fixed with 4% paraformaldehyde.Tissue sections and coverslips were placed in blocking buffer containing 5% normal goat serum and 0.2% Triton X-100.Immunostaining was performed by incubation with primary antibodies (rabbit anti-nNOS,1:150,Signalway,College Park,MD,USA,Cat# Ab-852,RRID:AB_2 034417;rabbit anti-NRLP3,1:200,Bioss,Boston,MA,USA,Cat# bs-23722R) overnight at 4°C.After thorough rinsing with PBS,the sections and coverslips were incubated with a secondary antibody at room temperature(23–24°C) for 1 hour (donkey anti-rabbit IgG (H+L),Alexa Fluor Plus 555,1:1000,Invitrogen,Waltham,MA,USA,Cat# A32794,RRID: AB_2762834).Cell nuclei were labeled with DAPI (1:200;Beyotime Institute of Biotechnology,C1002).Negative controls were subjected to the same procedure but without primary antibodies.The sections were then mounted and observed under a fluorescence microscope.The percentage of positive signal areas was calculated using ImageJ software.
Western blot assay
To assess the expression level of apoptosis-and pyroptosis-related proteins,the hippocampus of rats was dissected from brain on ice.Total protein was then extracted for western blot analysis.After homogenization in lysis buffer containing a protease inhibitor cocktail,samples were centrifuged at 15 493×gfor 25 minutes at 4°C.The supernatant was then collected,and the total protein content was quantified using a bicinchoninic acid (BCA) assay kit(Beyotime Institute of Biotechnology,BCA Protein Assay Kit,P0012).After mixing the supernatant with the sample buffer and heating the contents to 100°C for 5 minutes,40 μg of protein was subjected to 12% sodium dodecyl sulfate-polyacrylamide gel electrophoresis analysis (Bio-Rad,Hercules,CA,USA).Separated proteins were transferred to a 0.2-μm polyvinylidene fluoride membrane (Millipore Corporation,St.Louis,MO,USA) for 1.5 hours at 100 V.The membranes were then blocked in 5% bovine serum albumin and incubated overnight at 4°C with the primary antibodies (rabbit anti-cytochrome c,apoptotic marker,1:600,Abcam,Cambridge,UK,Cat# ab133504,RRID:AB_2 802115;mouse anti-nNOS,1:600,Santa Cruz Biotechnology,Dallas,TX,USA,Cat# SC-5302,RRID: AB_ 626757;mouse anti-β-actin,internal reference,1:2000,Santa Cruz Biotechnology,Cat# SC-8432,RRID: AB_ 626630;rabbit anti-caspase 3,apoptotic marker,1:1000,Proteintech,Wuhan,China,Cat#19677-1-AP,RRID: AB_10 733244;rabbit anti-GSDMD,pyroptosis marker,1:1000,Abcam,Cat# ab219800,RRID: AB_2 888940;rabbit anti-IL-18,pyroptosis marker,1:1000,Proteintech,10663-1-AP,RRID: AB_2 123636;rabbit anti-interleukin-1 beta [IL-1β],pyroptosis marker,1:1000,ABBKINE,Wuhan,China,Cat# ABP52932;mouse anti-glyceraldehyde-3-phosphate dehydrogenase [GAPDH],internal reference,1:1500,Santa Cruz Biotechnology,SC365062,RRID: AB_10847862).After washing with Tris-buffered saline and Tween 20,the membranes were incubated with secondary antibodies(goat anti-rabbit IgG (H+L),horseradish peroxidase conjugate,1:5000,Proteintech,Cat# SA00001-2,RRID: AB_2 722564;goat anti-mouse IgG (H+L),horseradish peroxidase conjugate,1:5000,Proteintech,Cat# SA00001-1,RRID:AB_2722565) for 1 hour at 37°C.Immunoreactive bands were visualized using an enhanced chemiluminescence kit (Thermofisher,Waltham,MA,USA) and analyzed by densitometry using ImageJ.The optical density of each protein band was normalized to either GAPDH or β-actin.
Statistical analysis
No statistical methods were used to predetermine the sample sizes.However,the sample size for this study was similar to previous publications (Zhu et al.,2021a;Xu et al.,2022).No animals or data points were excluded from the analysis.The raters were blind to the experimental assignments.Statistical analyses were performed using GraphPad Prism version 7.00 for Windows(GraphPad Software,San Diego,CA,USA,www.graphpad.com).All values are presented as mean ± standard error of the mean.Unpaired Student’st-test or one-way analysis of variance followed by Tukey’spost hoctest was used to evaluate differences between the groups.
Results
Identification of the key module associated with TRM epilepsy using WGCNA
To determine the gene cluster closely associated with TRM epileptogenesis,we conducted RNA sequencing and WGCNA.The functional assessment of the key gene module was then analyzed to preliminarily explore the potential mechanism,which was confirmed by the subsequent lab work.After data preprocessing,WGCNA was conducted using 15,340 genes from the RNA sequence to construct coexpression networks.A power of β=5 was selected as the soft threshold to create a scale-free network with an independence degree of up to 0.9 (Figure 1AandB).The dark-red module had the highest correlation (R2=0.88,P=0.004) with seizures (Figure 1C).We obtained 59 coexpression modules using the average linkage hierarchical clustering algorithm (Figure 1D).The module-trait relationship depicts the correlation between the TRM and each module by calculating the module significance value (Figure 1E).The heat map shows adjacencies in the eigengene network,which also indicates the level of independence among the modules(Figure 2A).The scatter plot demonstrates the correlation between module membership and gene significance in TRM epilepsy in the dark-red module(Figure 2B).In addition,we conducted GO analysis using DAVID,an online tool,to investigate the function of the key module.The 286 genes in the darkred module were mainly gathered in multiple GO terms of biological process(BP),cellular component (CC),and molecular function (MF),including “positive regulations of nitric oxide synthase biosynthetic process” (GO: 0051770,P=0.00167,Figure 2CandAdditional Table 1).Therefore,the results of our bioinformatics analyses suggest that NOS is likely to be involved in TRM epileptogenesis.
Elevated expression of nNOS in the TRM hippocampus
Next,we detected nNOS expression and distribution in the hippocampus of the TRMs and controls.According to the western blot,the hippocampal nNOS expression level was significantly higher in the TRM group (n=3) than in the control group (n=3,P=0.0055;Figure 3AandB),which supported our bioinformatics analysis results.Immunofluorescence analysis showed that nNOS was widely distributed in the control and TRM hippocampal regions,including the CA1,CA3,and dentate gyrus (DG) regions (Figure 3C).The relative fluorescence intensity of nNOS was increased in the hippocampal CA1(n=6,Controlvs.TRM,P=0.0298;Figure 3D),CA3 (n=6,Controlvs.TRM,P=0.0152;Figure 3E),and DG regions (n=6,Controlvs.TRM,P< 0.0001;Figure 3F) of the TRMs compared with that in the controls,in accordance with our western blot results.These findings indicate that nNOS is localized in the TRM hippocampus and may be involved in TRM epileptogenesis.
Abnormal mitochondrial structure and oxidative stress levels in the TRM hippocampus
NO,which is synthesized by NOS,contributes to mitochondrial damage through electron transport chain inhibition and oxidative or nitrosative stress induction (Tengan and Moraes,2017).Increasing evidence has indicated that oxidative stress caused by mitochondrial disorders may increase susceptibility to epilepsy (Yang et al.,2020).Given the vital role of mitochondria in both NO synthesis and seizure generation,we used transmission electron microscopy to observe the ultrastructural features of this organelle in epileptic animals.Mitochondria in the TRM hippocampus (n=3) were damaged to different degrees compared with those in normal controls (n=3),and presented with swelling and disrupted cristae (Figure 4A).Next,we analyzed whether the morphological changes contributed to abnormal mitochondrial function.We measured the activities of SDH and Na+-K+-ATPase,which are representative enzymes for metabolic processes when evaluating mitochondrial activity (Tian et al.,2015).The activity of each enzyme was markedly reduced (SDH,n=6,Controlvs.TRM,P< 0.0001,Figure 4B;Na+-K+-ATPase,n=6,Controlvs.TRM,P< 0.0001,Figure 4C) in the TRM group compared with that in the control group.Moreover,the secondary outcome of mitochondrial impairment usually includes an oxidase imbalance accompanied by abnormal levels of downstream enzymes,so we also determined the MDA,LDH,and SOD levels in the different groups.MDA and LDH levels were both increased (MDA,n=3,Controlvs.TRM,P=0.0055,Figure 4D;LDH,n=3,Controlvs.TRM,P=0.0491,Figure 4E) in the TRM group compared with those in the control group.However,the SOD level was not significantly altered (n=3,Controlvs.TRM,P=0.1045,Figure 4F).Thus,our data demonstrated abnormal mitochondrial structure and elevated levels of oxidative stress markers in the TRM hippocampus.
Reverse effect of the nNOS inhibitor 7-NI on increased levels of MDA and LDH in PILO-treated N2a cells
On the basis of the results above,which indicated that nNOS and oxidative stress were involved in the TRM,we speculated that blocking nNOS function might improve epilepsy-induced oxidative stress.Therefore,the nNOS inhibitor 7-NI was used to evaluate the potential influence of nNOS suppression.We initially performed a CCK8 assay using different concentrations of 7-NI in N2a cells to determine the optimal concentration(Figure 5A).We chose 100 μM as the appropriate working concentration because it was the highest concentration at which cell vitality was not affected in the N2a cells.PILO increased the relative content of MDA (n=3,DMSOvs.PILO,P=0.0011;Figure 5B) and LDH (n=3,DMSOvs.PILO,P=0.0003;Figure5C) and decreased the level of SOD (n=3,DMSOvs.PILO,P=0.0052;Figure 5D).Application of 7-NI restored these abnormal oxidative stress index levels(MDA:n=3,PILOvs.PILO+7-NI,P=0.0292;Figure 5B;LDH:n=3,PILOvs.PILO+7-NI,P=0.0072;Figure 5C;SOD,n=3,PILOvs.PILO+7-NI,P=0.0268;Figure 5D).Taken together,these results suggest nNOS inhibition with 7-NI had a neuroprotective effect against epilepsy-induced increases in MDA,LDH,and SOD levels.
Reverse effect of 7-NI on increased ROS levels in PILO-treated N2a cells
We next assessed the effect of nNOS inhibitors on ROS levels in N2a cells treated with PILO.The ROS level was significantly increased in the presence of PILO compared with that in the control group (n=5,DMSOvs.PILO,P=0.0335;Figure 5EandF),and this effect was suppressed by blocking nNOS activity with 7-NI (n=5,PILOvs.PILO+7-NI,P=0.0214;Figure 5F).Moreover,a decrease in ROS generation was observed in cells incubated with the ROS inhibitor NAC (n=5,PILOvs.PILO+NAC,P=0.0260;Figure 5F).These data suggest that nNOS inhibition with 7-NI has a neuroprotective effect against PILO-induced increases in ROS level.
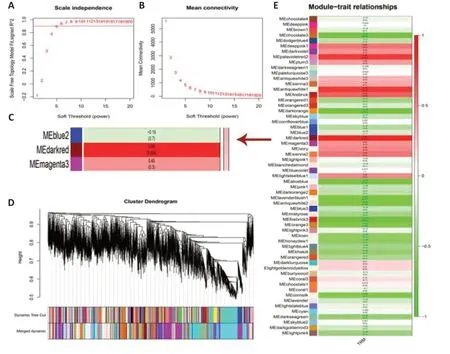
Figure 1|WGCNA using RNA sequencing of TRM.
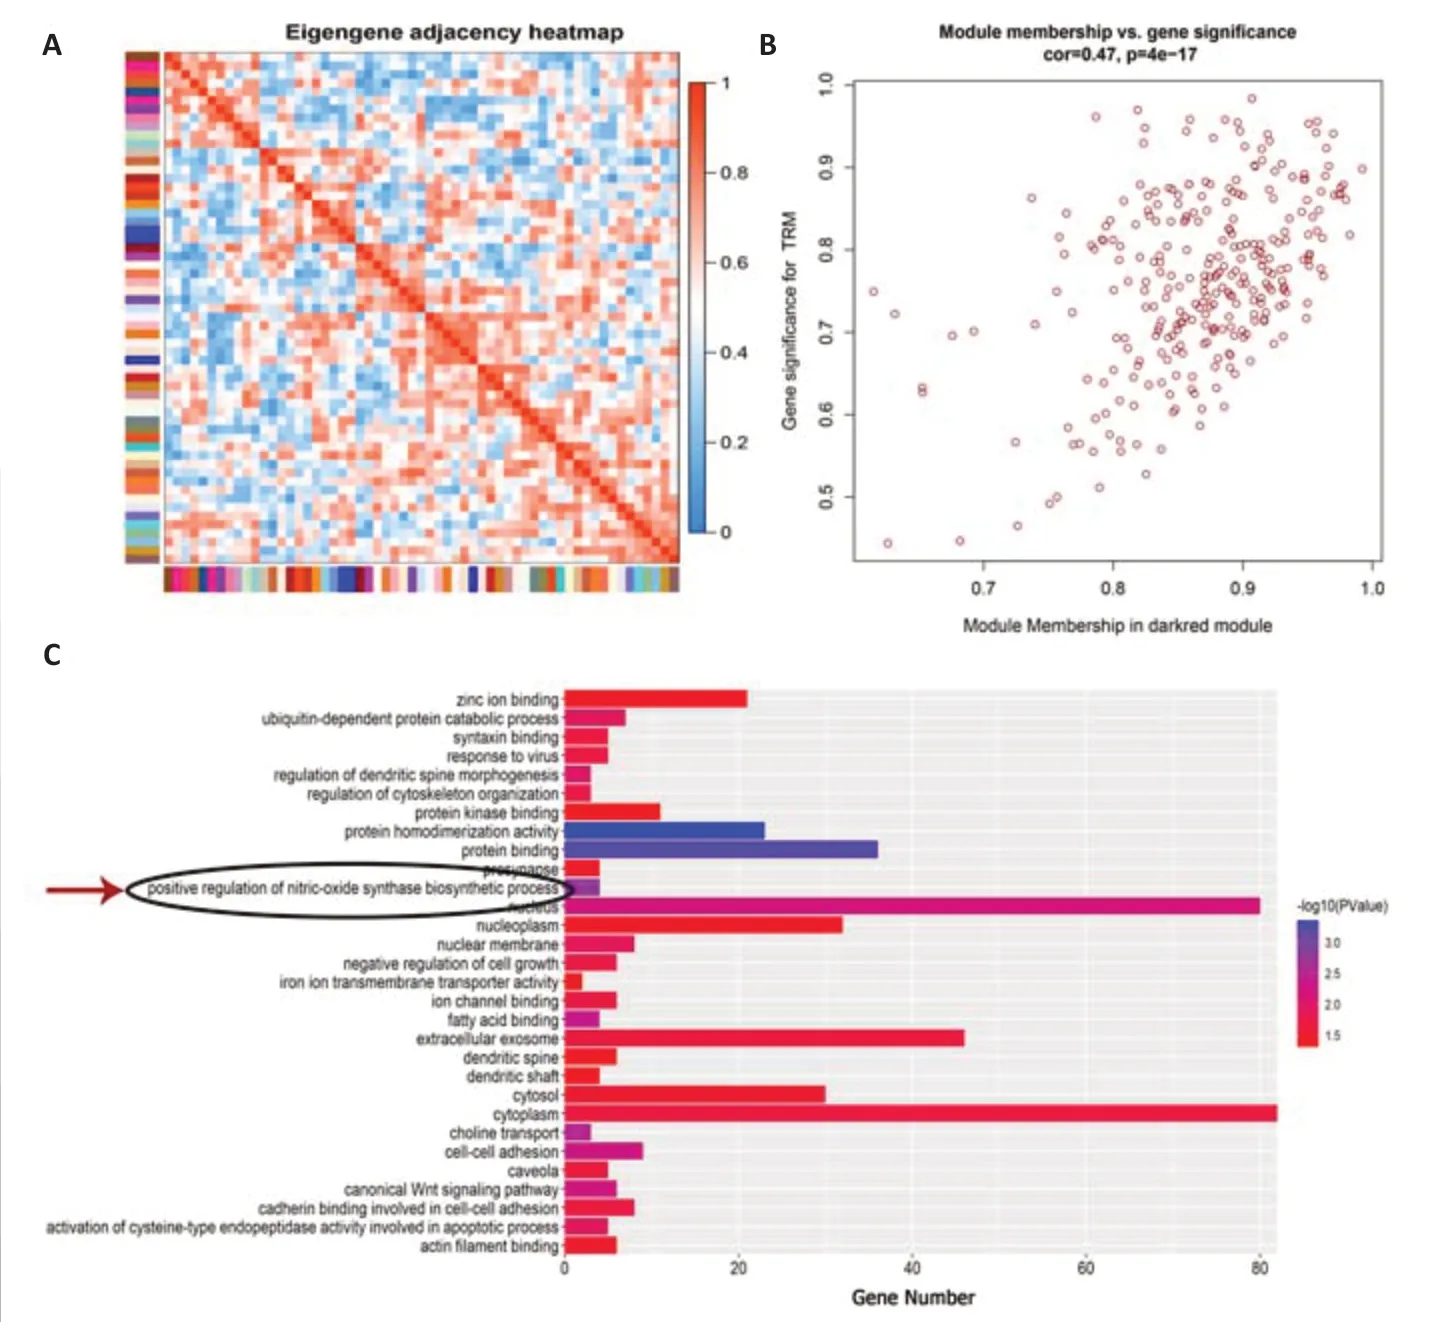
Figure 2|The function enrichment assessment highlights the vital role of nitric oxide synthase in TRM epileptogenesis.
nNOS/ROS pathway involved in PILO-induced apoptosis in N2a cells
To determine the molecular mechanisms of nNOS and ROS in epileptic cell death,we monitored cellular apoptosis in the presence of 7-NI and NAC.The TUNEL assay results showed that the increased apoptosis index in PILOtreated cells was significantly reduced after treatment with 7-NI or NAC alone,and after co-treatment using the two inhibitors (Figure 6AandB).The PILO treatment group showed an increased apoptosis index compared with the untreated group (n=3,DMSOvs.PILO,P=0.0327),and the 7-NI and NAC treatment groups showed reduced apoptosis indexes compared with the PILO treatment group (n=3,PILOvs.PILO+7-NI,P=0.0131;PILOvs.PILO+NAC,P=0.0356).Notably,the apoptosis index of 7-NI and NAC co-treatment was decreased by approximately 20% compared with that of treatment with NAC alone,suggesting that the altered ROS level might be the downstream effect of nNOS (n=3,PILO+7-NIvs.PILO+7-NI+NAC,P=0.1226;PILO+NACvs.PILO+7-NI+NAC,P=0.0387).Furthermore,caspase-3 and cytochrome c protein levels detected via western blotting confirmed the results described above.PILO upregulated the expression of caspase-3 (n=4,DMSOvs.PILO,P=0.0236;Figure 6C) and cytochrome c (n=4,DMSOvs.PILO,P=0.0051;Figure 6D).Additionally,7-NI or NAC treatment alone reversed the aberrant expression of the two proteins (caspase-3:n=4,PILOvs.PILO+7-NI,P=0.0266,PILOvs.PILO+NAC,P=0.0233,Figure 6C;cytochrome c:n=4,PILOvs.PILO+7-NI,P=0.0026,PILOvs.PILO+NAC,P=0.0320,Figure 6D),and co-treatment with the two inhibitors exhibited a significant decrease in the caspase-3 and cytochrome c levels compared with NAC treatment alone(caspase-3:n=4,PILO+7-NIvs.PILO+7-NI+NAC,P=0.3405,PILO+NACvs.PILO+7-NI+NAC,P=0.0237,Figure 6C;cytochrome c:n=4,PILO+7-NIvs.PILO+7-NI+NAC,P=0.0504,PILO+NACvs.PILO+7-NI+NAC,P=0.0173,Figure 6D).Hence,these data demonstrate that the nNOS/ROS pathway is involved in PILO-induced apoptosis in N2a cells.
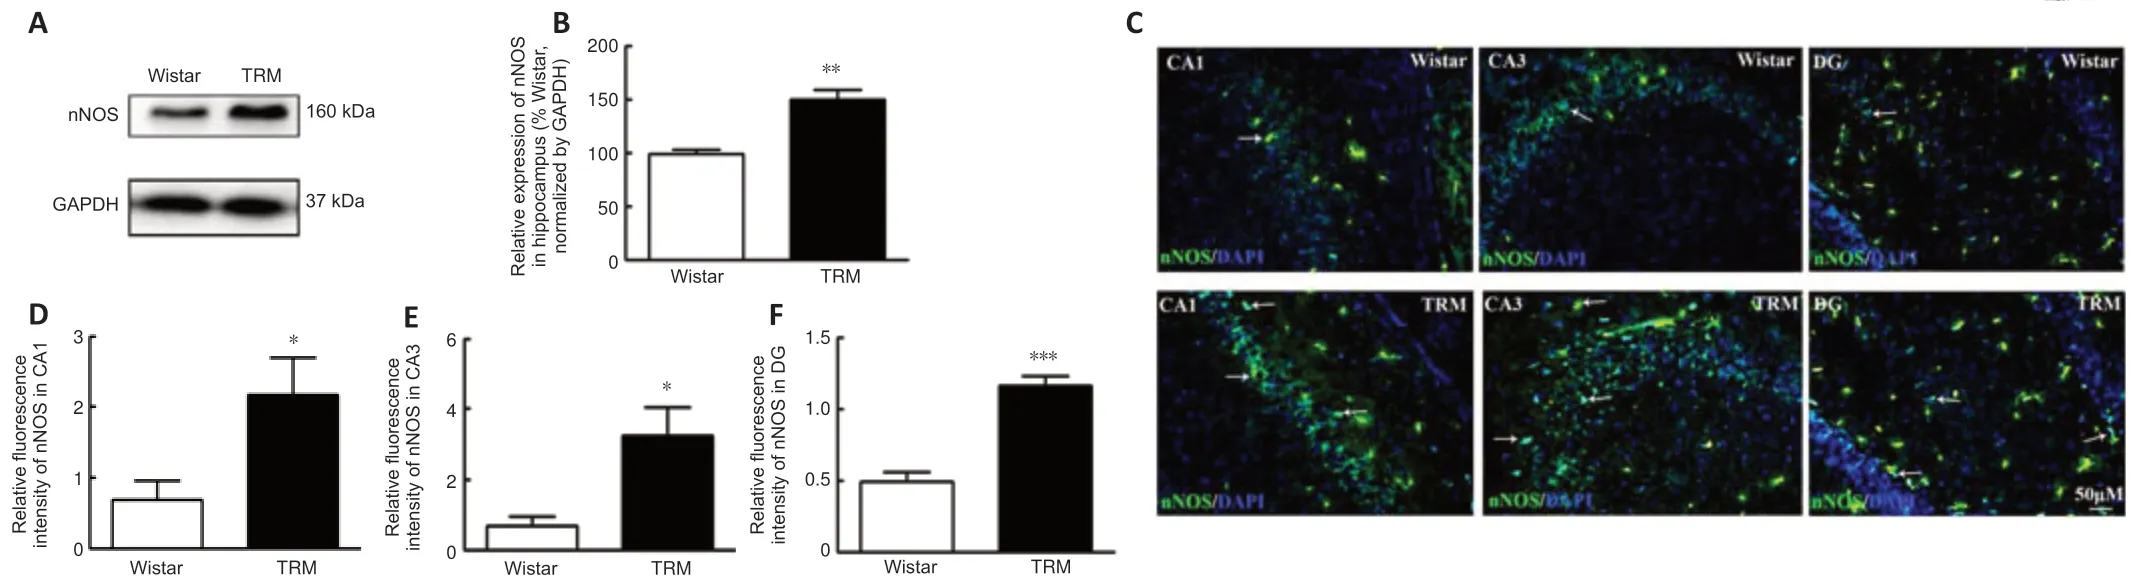
Figure 3|Expression and distribution of nNOS in the TRM.
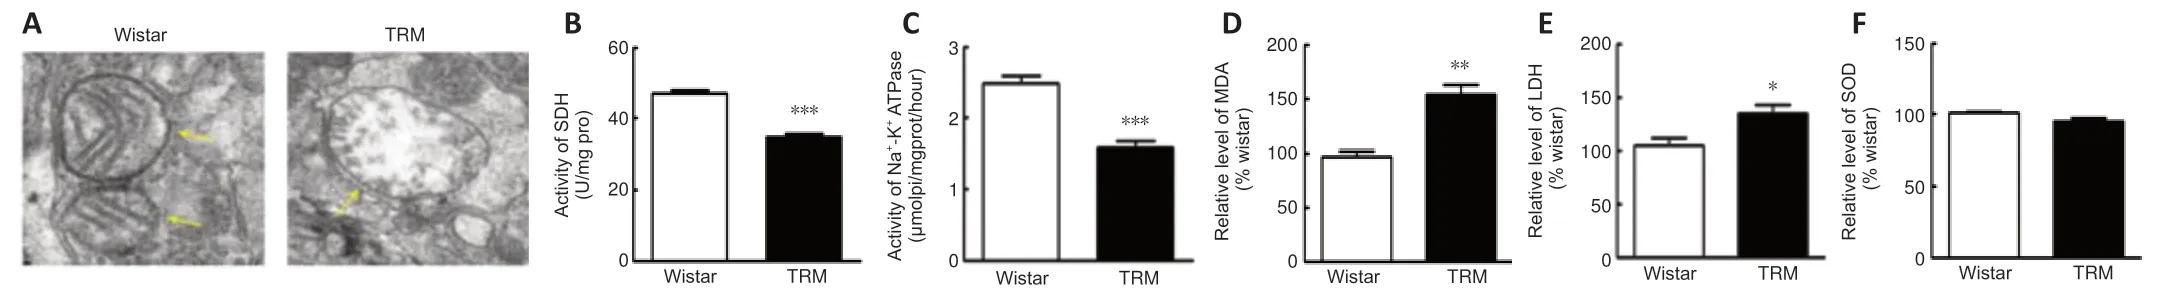
Figure 4|Mitochondrial dysfunction and enhanced MDA and LDH in the TRM hippocampus.
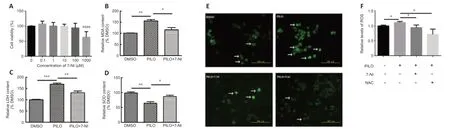
Figure 5|nNOS inhibitor 7-NI reverses effect on MDA and LDH levels and ROS generation in PILO-treated N2a cells.
nNOS/ROS pathway is involved in PILO-induced pyroptosis in N2a cells
We performed immunostaining to determine the distribution of NLRP3,which was used as a marker of pyroptosis in cells (Tao et al.,2021).Similar to the results of our apoptosis analyses,the enhanced fluorescence intensity of NLRP3 in the PILO-treated group was significantly reversed by 7-NI,NAC,and 7-NI combined with NAC (n=3,DMSOvs.PILO,P=0.0022;PILOvs.PILO +7-NI,P=0.0174;PILO vs.PILO+NAC,P=0.0468;PILO+7-NIvs.PILO+7-NI+NAC,P=0.0133;PILO+NACvs.PILO+7-NI+NAC,P< 0.0001;Figure 7AandB).Expression of the pyroptosis marker GSDMD was higher in the PILO group than in the control group,and 7-NI or NAC treatment reversed this effect (n=3,DMSOvs.PILO,P=0.0200;PILOvs.PILO+7-NI,P=0.0233;PILOvs.PILO+NAC,P=0.0298;Figure 7C).A notable reduction in GSDMD level was observed after 7-NI and NAC co-treatment compared with that after the NAC treatment alone (n=3,PILO+7-NIvs.PILO+7-NI+NAC,P=0.0545;PILO+NACvs.PILO+7-NI+NAC,P=0.0090,Figure 7C).Similar results were also found with other pyroptosis markers,including IL-1β and IL-18 (IL-1β:n=3,DMSOvs.PILO,P=0.0489,PILOvs.PILO+7-NI,P=0.0488,PILOvs.PILO+NAC,P=0.0202,PILO+7-NIvs.PILO+7-NI+NAC,P=0.2905,PILO+NACvs.PILO+7-NI+NAC,P=0.0246,Figure 7D;IL-18:n=4,DMSOvs.PILO,P=0.0422,PILOvs.PILO+7-NI,P=0.0314,PILOvs.PILO+NAC,P=0.0498,PILO+7-NIvs.PILO+7-NI+NAC,P=0.9711,PILO+NACvs.PILO+7-NI+NAC,P=0.0270,Figure 7E).Taken together,our data indicate that the nNOS/ROS pathway is involved in PILO-induced pyroptosis in N2a cells.
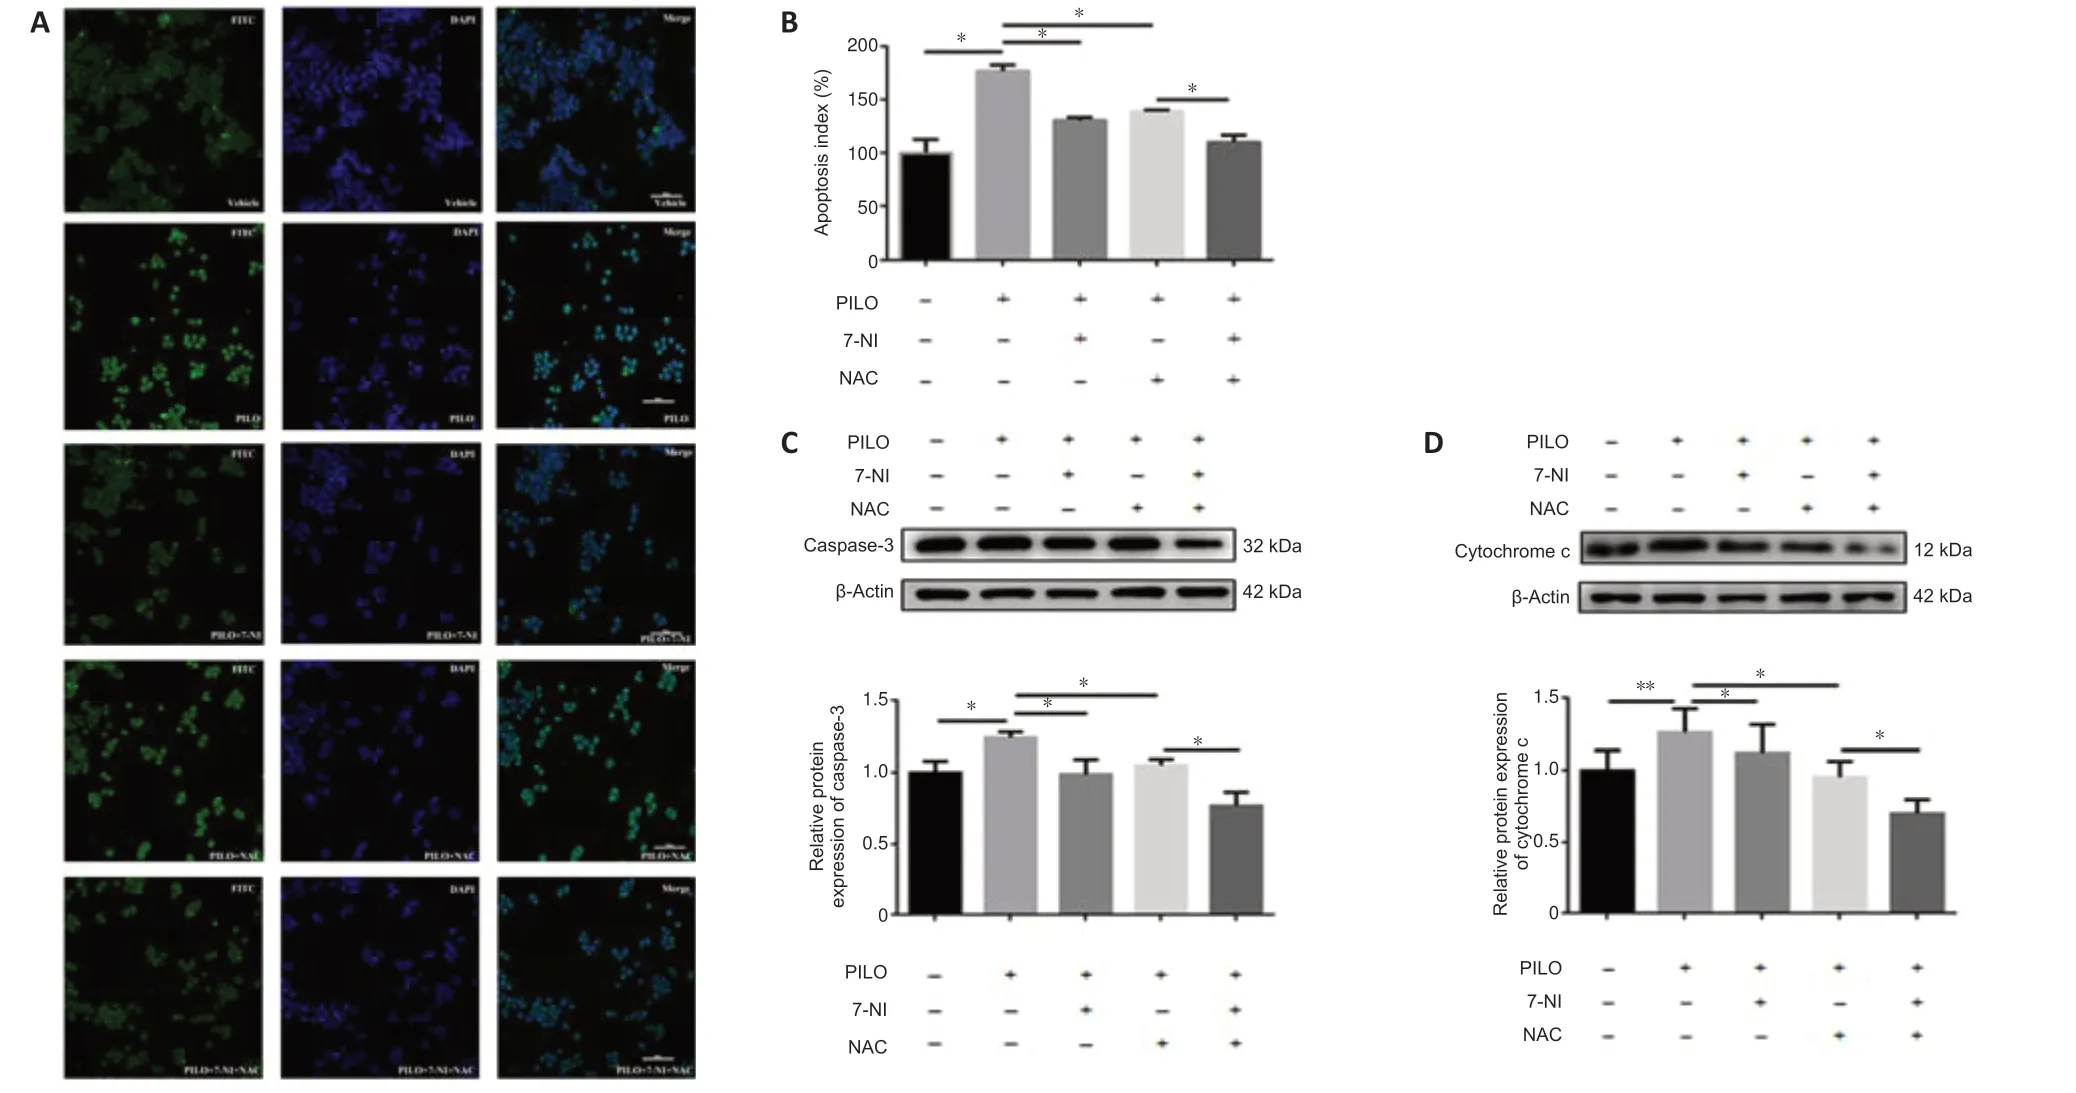
Figure 6|nNOS/ROS pathway is involved in PILO-induced apoptosis in N2a cells.
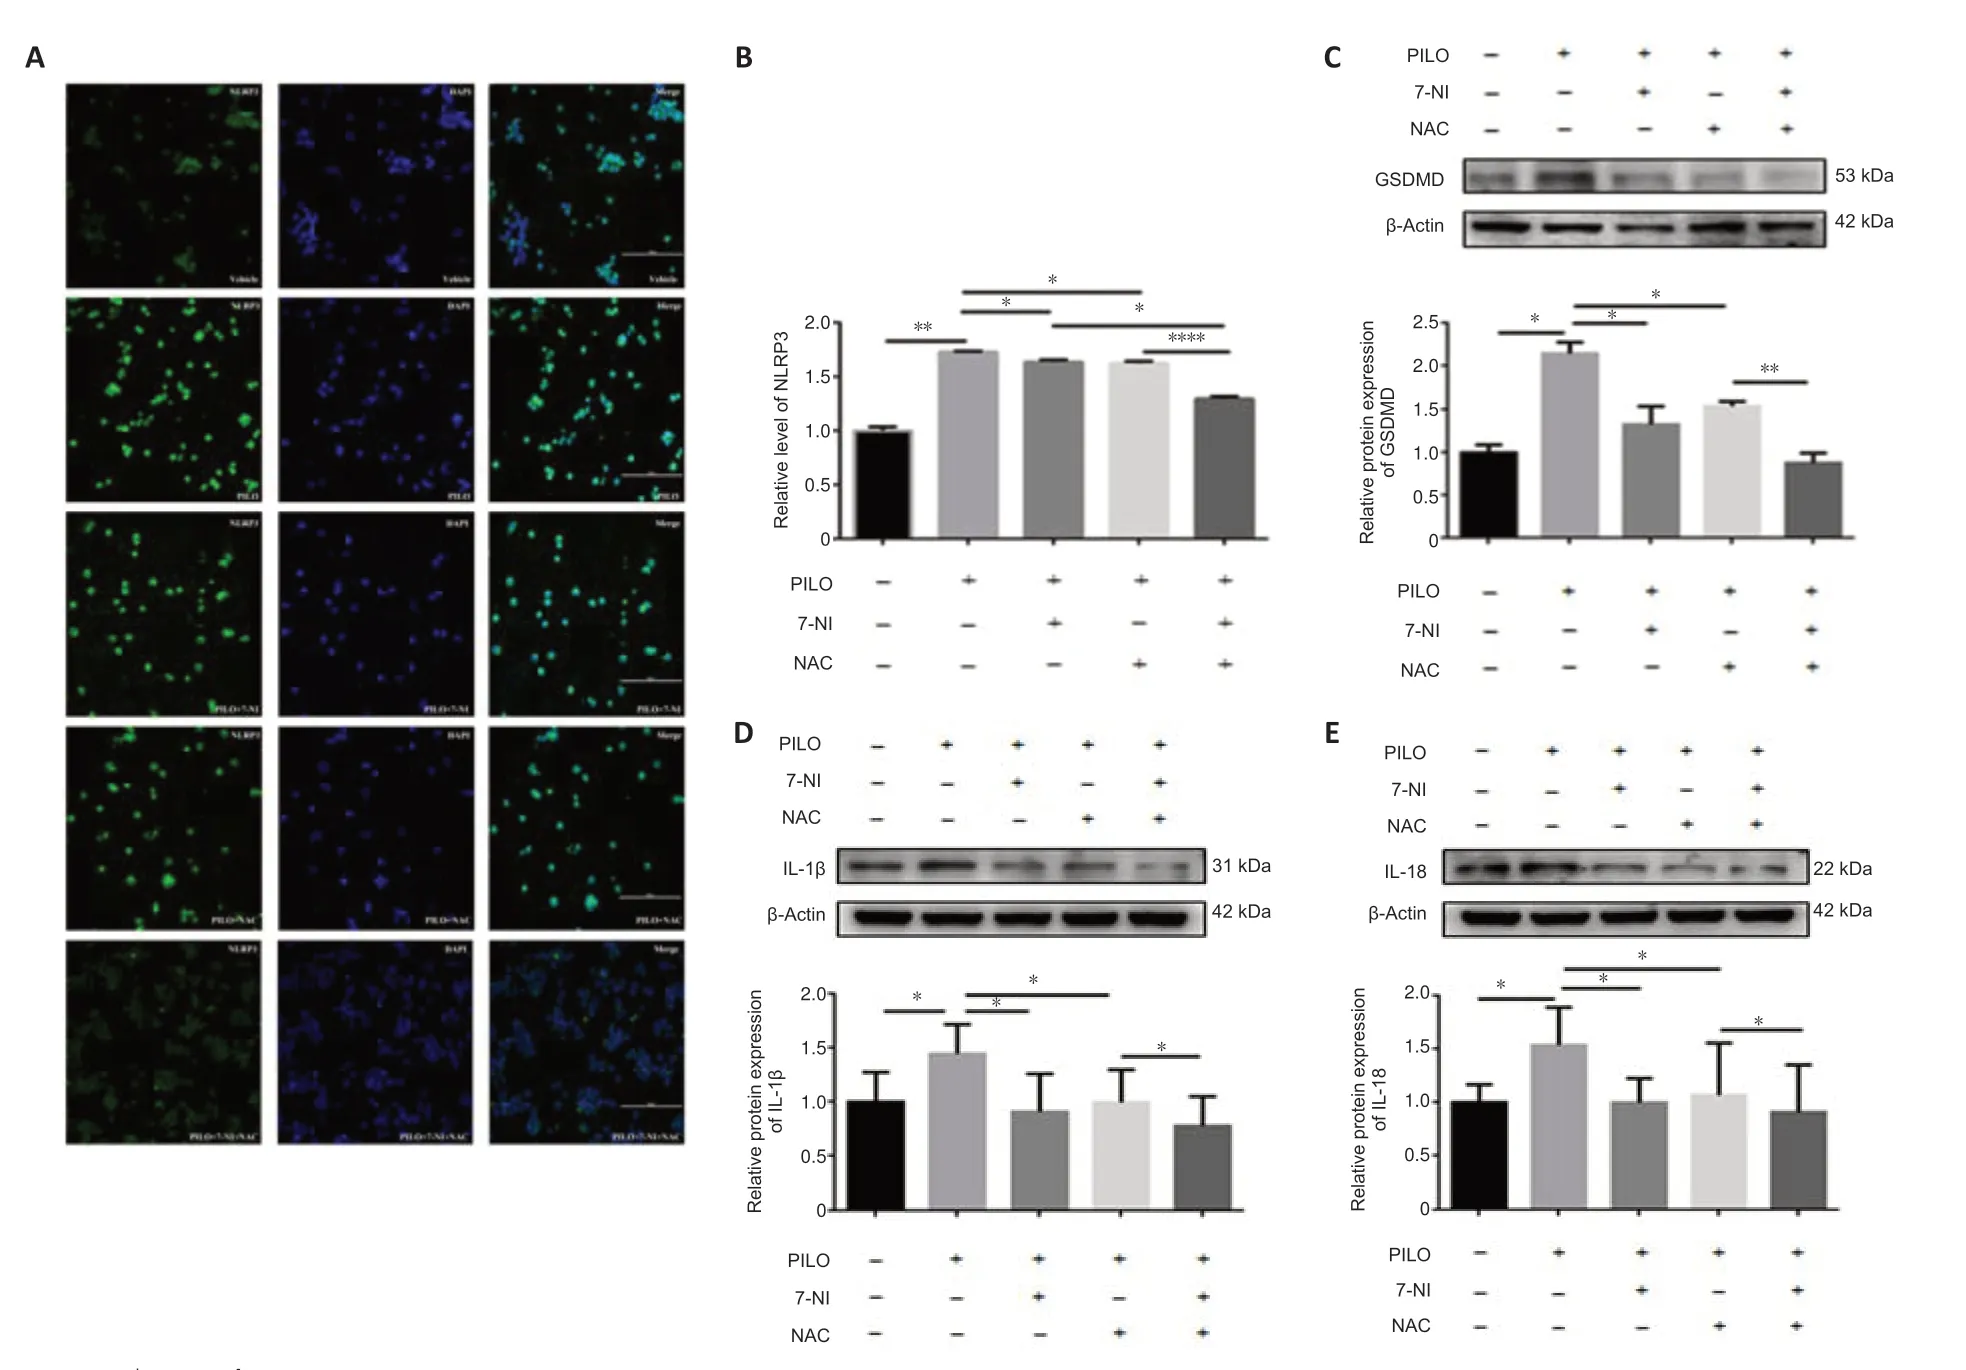
Figure 7|nNOS/ROS pathway is involved in PILO-induced apoptosis in N2a cells.
Discussion
A substantial number of reports have elucidated that nNOS plays pivotal roles in diverse neuropathological conditions,including epilepsy.However,the underlying molecular mechanisms remain unclear.The purpose of the present study was to determine the effects of nNOS and the nNOS-ROS pathway on cell death in epilepsy.We initially acquired the expression profile of the TRM hippocampus using RNA sequencing and created coexpression modules using the WGCNA algorithm.“NOS biosynthetic process” was highlighted in the functional assessments for the module that was highly linked to TRM seizure.We then observed abnormal expression and distribution of nNOS in the TRM hippocampus,along with impaired mitochondria.Additionally,blocking nNOS and/or ROS generation protected N2a cells against PILO-induced apoptosis and pyroptosis,thus indicating that the nNOS-ROS pathway may be involved in epileptogenesis by regulating cell death.
In the present study,high-throughput sequencing was used to gain insights into mRNA expression in the TRM hippocampus.We then performed WGCNA to systematically evaluate the gene coexpression patterns based on our RNA sequencing results and identified the dark-red module as the key module.Particularly,“positive regulations of nitric oxide synthase biosynthetic process”was referred to in the GO functional terms of the dark-red module,indicating a crucial role of NOS in TRM epileptogenesis.Our subsequent analyses also demonstrated upregulated expression of nNOS in the TRM hippocampus;this finding supported the bioinformatics analysis results.Furthermore,according to our immunostaining results,nNOS levels were elevated in cells of the CA1,CA3 and DG hippocampal regions.In the hippocampus,nNOS was weakly expressed in only a few pyramidal neurons and was extensively expressed in interneurons in all of the hippocampus regions,thus it is likely that interneurons play a crucial role in the initiation of status epilepticus (Dreyer et al.,2004;Kovács et al.,2009).It is noteworthy that decreased p-CaMKII levels were previously reported in the TRM hippocampus (Xu et al.,2013;Lv et al.,2015).Under ischemic conditions,enhanced Ca2+concentration promotes NO production by activating nNOS,whereas NO suppresses CaMKII via S-nitrosylation in an ATP-competitive manner (Ogawa et al.,2007).Considering the mutual regulation of CaMKII and nNOS,we hypothesized that an abundance of hippocampal nNOS might inhibit CaMKII activity in the TRM.An overexpression of NO isozymes was reported in the olfactory bulbs of patients with frontal lobe epilepsy (Mercado-Gómez et al.,2018),which is consistent with our findings.High mRNA expression levels of nNOS have been detected in the peripheral blood of epilepsy patients with antineuronal antibody positivity (Ulusoy et al.,2020).In addition,increased nNOS expression was implicated in hippocampal neurogenesis and endoplasmic reticulum stress in pentylenetetrazole-kindled mice (Zhu et al.,2016,2017).Thus,nNOS inhibition may not only serve as a safe adjuvant therapy for the management of epilepsy and related comorbidities,but also for use with multiple antiepileptic medicines (Su et al.,2014;Zhu et al.,2015;Singh and Goel,2017;Meskinimood et al.,2019).Intriguingly,in several chronically epileptic animals,fewer nNOS-immunoreactive interneurons were observed in the hippocampal hilar,which is inconsistent with the aforementioned conclusion (Wang et al.,2021b).The different animal models used might explain this discrepancy.Additionally,nNOS expression and function likely vary in different cell types or brain regions.Therefore,more attention should be paid to exploring the role of nNOS in epileptiform activity.
Acting as a cellular “energy factory” to exert important metabolic roles,mitochondria are responsible for generating energy to maintain organ function.Metabolic and homeostatic changes have been tightly associated with epilepsy development (Vidali et al.,2015;Kovac et al.,2017).Mitochondrial dysfunction may contribute to chronic redox alterations and increase seizure susceptibility,which is speculated to be one of the causes of epileptic seizures (Lim and Thomas,2020;Yang et al.,2020).In cells carrying a genetic mutation in myoclonic epilepsy with ragged-red fibers,neuronal hyperexcitability was detected,owing to disrupted mitochondrial calcium homeostasis (Brini et al.,1999).Endogenous NO has been documented to exert inhibitory control on mitochondrial respiration in the brain (Schild et al.,2006;Sakamuri et al.,2020).Because we observed altered nNOS expression,we assumed that mitochondria might be affected in the TRM.Indeed,our findings of abnormal mitochondrial morphology indicated that the TRM hippocampal mitochondria were damaged.The decreased activities of SDH and Na+-K+-ATPase reflected respiratory chain enzyme-based electron transference reduction and reduced ATP production,suggesting a mitochondrial functional deficit.Moreover,intracellular MDA,LDH,and SOD are important molecules for assessing oxidative stress levels and the degree of membrane damage in cells and tissue (Hu et al.,2019).Increased LDH and MDA levels were also observed in a cell model of spontaneous recurrent epileptiform discharge and pentylenetetrazole-kindled mice (El-Abhar and El Gawad,2003;Zhao et al.,2021),which is consistent with our present results.Several studies have reported decreased SOD levels in epileptic models,and the TRM displayed a similar trend,but the difference was not significant.This inconsistency demonstrates that probing the underlying mechanism in epilepsy is complicated,probably because of the relevance of the types of models used.Hence,comprehensive understanding of TRM epileptogenesis requires further research.
Considering that nNOS may be involved in TRM epileptogenesis,we next wondered whether nNOS suppression would rescue the cells from seizure-induced damage.The N2a cell is an excellentin vitrotool for investigating neurological pathologies including excitotoxicity (Sadeghnia et al.,2017;Rajabian et al.,2018),neuroinflammation (Popichak et al.,2018) and oxidative stress (Chen et al.,2017).Although the investigation of epileptogenic mechanisms using N2a cells is at an early stage,it has been widely used in pathogenesis and progression studies of Alzheimer’s disease(Liu et al.,2016).PILO is a well-established drug that is used systemically to mimic temporal lobe epilepsy in animals (Curia et al.,2008).Applying it to hippocampal neurons increases the frequency of spontaneous activity (Priel and Albuquerque,2002).Thus,we used PILO-treated N2a cells as the model for epilepsyin vitro.We used the nNOS-selective inhibitor 7-NI and found that its administration reversed the PILO-induced elevation in MDA and LDH levels and decreased the SOD level,suggesting an improvement in oxidative stress indicator levels.This neuroprotective effect of 7-NI has also been reported in other neuropathological conditions,such as learning and memory impairment,cocaine-induced oxidative stress in the brain,and malathioninduced brain damage (Anaeigoudari et al.,2015;Vitcheva et al.,2015;Abdel-Salam et al.,2017;Memarpour et al.,2020).We further found that 7-NI or the ROS inhibitor NAC blocked ROS generation.Mitochondrial malfunction is frequently accompanied by aberrant ROS production,whereas severe lipid peroxidation in epilepsy may boost ROS levels (Wu et al.,2019;Chen et al.,2020b).Therefore,understanding the nNOS-ROS pathway should not be neglected in epilepsy.
Multiple redox-associated neuronal cell death modalities may occur during epilepsy occurrence and development (Mao et al.,2019).In this study,we focused on two major types of cell death: apoptosis and pyroptosis.Our results showed that epilepsy-like damage triggered cellular apoptosis and pyroptosis,and that suppression of nNOS or the nNOS-ROS pathway might be conducive for promoting cell survival.Similarly,in rats with status epilepticus,tacrolimus exerted a neuroprotective effect by modulating NOSassociated apoptosis (Wang et al.,2019).Downregulation of nNOS attenuates neuronal apoptosis in cerebral ischemia/reperfusion.Pyroptosis is a newly discovered programmed cell death that is regulated by inflammasomes.NLRP3 inflammasome activation governs the cleavage and activation of caspase-1,and caspase-1 controls the cleavage of GSDMD and the maturation of the proinflammatory cytokines IL-1β and IL-18,initiating the canonical inflammasome pathway (Wree et al.,2014;Sadaf et al.,2020).NLRP3/caspase-1-mediated neuronal pyroptosis has been investigated for the aggravation of neuronal damage in patients with epilepsy and in epileptic mice (Cristina de Brito Toscano et al.,2021;Jiang et al.,2021).Targeting key proteins of pyroptosis has anticonvulsant effects and is the mechanism of several emerging medicines for epilepsy treatment (Ramazi et al.,2020;Xia et al.,2021b).Considering our present results,it is reasonable to speculate that during the epileptogenic process,nNOS malfunction may affect the nNOSROS pathway and accelerate cell death by activating cellular apoptosis and pyroptosis.Pharmacological manipulation of nNOS or nNOS-dependent ROS pathways may offer an opportunity to devise pharmacological approaches to treat epilepsy.
We acknowledge that our study has limitations.First,we focused on coexpressed genes,which included genes closely associated with seizure occurrence without altered expression,but differentially expressed genes should be investigated in the future.Second,the cell-enriched databases (e.g.https://www.brainrnaseq.org) should be used to differentiate genes enriched in neurons and other types of neural cells to explore whether the function of the genes in a key module is distribution specific.
In summary,the present study illuminates the importance of nNOS and nNOSrelated pathways in epileptogenesis by integrating bioinformatics analysis and laboratory experimentation.Our analysis of the key module indicated the involvement of the “NOS biosynthetic process” in TRM epilepsy.Subsequently,we observed abnormal nNOS expression and distribution and mitochondrial dysfunction in the TRM hippocampus.Furthermore,suppressing nNOS activity and/or ROS production prevented cellular apoptosis and pyroptosisin vitro.Our study offers novel perspectives on the roles of nNOS and the nNOS-ROS pathway in epilepsy pathogenesis.This study suggests that nNOS should be further investigated for its potential use in antiepileptic therapeutic options.
Author contributions:Study conception: XXX,BYL,GLC,FG;study design:XXX,BYL,GLC,FG;experimental implementation: XXX,RXS,YF,JLW,SQZ;data analysis: XXX,XT,NW;statistical analysis: MXL,YT,WW,MH;manuscript preparation: XXX,FG;manuscript revision: BYL,GLC,FG.All authors approved the final manuscript before submission for publication.
Conflicts of interest:The authors declare no potential conflicts of interest.
Availability of data and materials:All data generated or analyzed during this study are included in this published article and its supplementary information files.
Open access statement:This is an open access journal,and articles are distributed under the terms of the Creative Commons AttributionNonCommercial-ShareAlike 4.0 License,which allows others to remix,tweak,and build upon the work non-commercially,as long as appropriate credit is given and the new creations are licensed under the identical terms.
Additional files:
Additional Figure 1:The flow chart for in vivo and in vitro studies.
Additional Table 1:Each gene ontology category in epileptogenesis of tremor rat.
- 中国神经再生研究(英文版)的其它文章
- Neuro faces of beneficial T cells: essential in brain,impaired in aging and neurological diseases,and activated functionally by neurotransmitters and neuropeptides
- Profiling neuroprotective potential of trehalose in animal models of neurodegenerative diseases:a systematic review
- Cdk5 and aberrant cell cycle activation at the core of neurodegeneration
- Recent advancements in noninvasive brain modulation for individuals with autism spectrum disorder
- Vicious cycle of lipid peroxidation and iron accumulation in neurodegeneration
- Cell-based therapeutic strategies for treatment of spinocerebellar ataxias: an update