
The relationship among amyloid-β deposition,sphingomyelin level,and the expression and function of P-glycoprotein in Alzheimer’s disease pathological process
2023-01-21 06:36ZiKangXingLiShaDuXinFangHengLiangShengNanZhangLeiShiChunXiangKuangTianXiongHanQingYang
中国神经再生研究(英文版) 2023年6期
Zi-Kang Xing,Li-Sha Du,Xin Fang,Heng Liang,Sheng-Nan Zhang,Lei Shi,Chun-Xiang Kuang,Tian-Xiong Han,Qing Yang,
Abstract In Alzheimer’s disease,the transporter P-glycoprotein is responsible for the clearance of amyloid-β in the brain.Amyloid-β correlates with the sphingomyelin metabolism,and sphingomyelin participates in the regulation of P-glycoprotein.The amyloid cascade hypothesis describes amyloid-β as the central cause of Alzheimer’s disease neuropathology.Better understanding of the change of P-glycoprotein and sphingomyelin along with amyloid-β and their potential association in the pathological process of Alzheimer’s disease is critical.Herein,we found that the expression of P-glycoprotein in APP/PS1 mice tended to increase with age and was significantly higher at 9 and 12 months of age than that in wild-type mice at comparable age.The functionality of P-glycoprotein of APP/PS1 mice did not change with age but was significantly lower than that of wild-type mice at 12 months of age.Decreased sphingomyelin levels,increased ceramide levels,and the increased expression and activity of neutral sphingomyelinase 1 were observed in APP/PS1 mice at 9 and 12 months of age compared with the levels in wild-type mice.Similar results were observed in the Alzheimer’s disease mouse model induced by intracerebroventricular injection of amyloid-β1–42 and human cerebral microvascular endothelial cells treated with amyloid-β1–42.In human cerebral microvascular endothelial cells,neutral sphingomyelinase 1 inhibitor interfered with the changes of sphingomyelin metabolism and P-glycoprotein expression and functionality caused by amyloid-β1–42 treatment.Neutral sphingomyelinase 1 regulated the expression and functionality of P-glycoprotein and the levels of sphingomyelin and ceramide.Together,these findings indicate that neutral sphingomyelinase 1 regulates the expression and function of P-glycoprotein via the sphingomyelin/ceramide pathway.These studies may serve as new pursuits for the development of anti-Alzheimer’s disease drugs.
Key Words: Alzheimer’s disease;amyloid-β;APP/PS1 mice;ceramide;ezrin-radixin-moesin;human cerebral microvascular endothelial cells;neutral sphingomyelinase 1;P-glycoprotein;sphingomyelin synthase;sphingomyelin
From the Contents
Introduction 1300
Methods 1301
Results 1302
Discussion 1303
Introduction
The amyloid cascade hypothesis describes amyloid-β (Aβ) as the central cause of Alzheimer’s disease (AD) neuropathology (Decourt et al.,2017),and research has focused on developing strategies for AD treatment on the basis of the amyloid cascade hypothesis.While clinical trials targeting Aβ have mostly failed over recent years (Fulop et al.,2018),aducanumab,an anti-Aβ antibody,has recently been approved for the treatment of AD (Mullard,2021)and is the first new AD drug since 2003.However,the underlying mechanisms of the amyloid cascade hypothesis remain to be fully determined.
The deposition of Aβ is one of the defining pathological features of AD(Yankner and Lu,2009;Tarasoff-Conway et al.,2015).P-glycoprotein (P-gp)is an ATP-binding cassette transporter present at the brain and the bloodbrain barrier (BBB) working as an Aβ efflux pump to remove Aβ from the central nervous system (Lam et al.,2001;Cirrito et al.,2005;Hartz et al.,2010).An increasing number of studies suggest that P-gp is closely related to Aβ deposition in the brain (Mohamed et al.,2016;Bruckmann et al.,2017;Fuchino et al.,2018;Hartz et al.,2018;Zhang et al.,2018;Chai et al.,2020).A significant negative correlation was detected between P-gp expression and Aβ deposition in the medial temporal lobe of brain tissue samples from non-demented subjects (Vogelgesang et al.,2002).The expression levels of P-gp at BBB are significantly reduced and the transport activities of P-gp are compromised in AD patients compared with those in age-matched cognitively healthy individuals (Wijesuriya et al.,2010;van Assema et al.,2012;Carrano et al.,2014;Deo et al.,2014;Chiu et al.,2015).Furthermore,the expression and transport activity of P-gp are reduced at the BBB in AD mice (Hartz et al.,2010;Mehta et al.,2013;Park et al.,2014),and inhibiting P-gp activity or absence of P-gp exacerbates Aβ deposition in AD mice (Cirrito et al.,2005).
While abnormal P-gp expression in AD has been noted,the pattern of P-gp expression during the pathological process of AD and the reason behind the abnormal P-gp expression in AD remains uncertain.Answering these questions may lead to the development of new strategies to improve Aβ brain clearance in AD.
The brain is highly enriched in lipids,and disruption of lipid homeostasis is related to AD (Kao et al.,2020).Sphingomyelin (SM),the predominant plasma membrane lipid,shows altered expression levels in the brains of AD patients(van Echten-Deckert and Walter,2012).In some studies,SM levels in the inferior parietal lobe of AD patients were elevated and positively correlated with the number of Aβ plaques in the brain (Pettegrew et al.,2001).Other studies found decreased SM levels in brain tissue of AD patients (He et al.,2010;Filippov et al.,2012).SM levels were not significantly different among wild-type (WT) mice and the two AD mouse lines PS1 and APP/PS1 (Barrier et al.,2010).Whether and how SM levels change in AD remain unclear,and better understanding of the underlying mechanisms may help identify potential therapeutic targets for AD.
Abnormal SM metabolism has been noted in brains afflicted by AD (He et al.,2010).SM and ceramide are converted to each other by sphingomyelinase(SMase) and SM synthase (SMS),respectively (Adada et al.,2016).Ceramide is a key intermediate in sphingolipid metabolic pathways that is degraded by ceramidase (Cogolludo et al.,2019;Fu et al.,2021).SMases are named based on the pH at which they are active,with acid SMase,neutral SMase (nSMase),and alkaline SMase (Hawkins et al.,2020).nSMases are encoded by three not closely related genes that differ in their biochemical and physiological characteristics (Filippov et al.,2012).The nSMase1 and nSMase3 genes are expressed ubiquitously in many tissues,both at the transcriptional and translational levels,while nSMase2 is expressed predominantly in brain(Filippov et al.,2012).SMS has two isoforms,SMS1 and SMS2 (Li et al.,2007).In vitro,Aβ activates the SM/ceramide pathway,resulting in the apoptosis of various brain cells,such as human neurons,rat neurons,rat oligodendrocytes,rat astrocytes and glial cells (Ayasolla et al.,2004;Jana and Pahan,2004;Lee et al.,2004;Ju et al.,2005;Malaplate-Armand et al.,2006).Anin vivostudy showed that Aβ administration activated oxidative stress and the SM/ceramide pathway (Alessenko et al.,2004).Aβ activates nSMase,but not acidic SMase,resulting in increased ceramide generation in human primary neurons and the cortex of mice (Lee et al.,2004;Jana and Pahan,2010).nSMase activation,likely the nSMase2 isoform,contributes to Aβ cytotoxicity and may be a potential therapeutic target for AD (Wu et al.,2010).The gene encoding nSMase3 has low sequence homology with nSMase1 and nSMase2,which indicates that nSMase3 may serve a function different from those of nSMase1 and nSMase2 (Horres and Hannun,2012).However,the role of nSMase1 in AD has not been clarified.Given that nSMase1 may function as anin vivoSMase in some instances,the physiologic roles of nSMase1 in AD need to be determined (Wu et al.,2010).
The localization and function of drug transporters,including P-gp,are often closely associated with ezrin,radixin,and moesin (ERM) proteins (Louvet-Vallee,2000).Knockdown of ERM proteins decreases the expression and functionality of P-gp at the plasma membrane of hepatocytes (Kano et al.,2011) and leukocytes (Luciani et al.,2002).Down-regulation of P-gp expression and the substantial downregulation of ezrin expression have been observed in brains of SMS2–/–mice.SMS1 overexpression in Caco-2 cells alters the expression levels of ezrin and moesin (Jin et al.,2016).Studies on the correlation between P-gp and ERM proteins in AD are scarce.
We used the APP/PS1 double transgenic AD mouse model,Aβ1–42-induced AD mouse model and an Aβ1–42-induced AD cell model to investigate the correlation among Aβ deposition,SM level,and expression and functionality of P-gp with the aim of better understanding their roles in AD pathology.
Methods
Animals
APP/PS1 mice (3–12 months old,weighing 22–34 g) on a C57BL/6J background (Stock No.#034829-JAX,RRID: MMRRC_034829-JAX),WT C57BL/6J mice (3–12 months old,weighing 22–34 g),and WT C57BL/6J mice(6 weeks old,weighing 15–18 g) were purchased from the Model Animal Research Center of Nanjing University (Nanjing,China,license No.SYXK (Su)2021-0034).All mice were maintained in a specific pathogen-free animal room at 23–25°C and a 12-hour light/dark cycle.Animals were housed at one mouse per cage,and food and water were availablead libitum.Only male mice were used in these experiments following previous reports (Ofengeim et al.,2017;Chen et al.,2021).Mice were killed by cervical dislocation following anesthesia (4% isoflurane,16 mL/min,RWD,Shenzhen,Guangdong,China,Cat# R510-22-8).This study was approved by the Animal Ethics Committee of Fudan University on March 3,2018 (approval No.BE1803) and designed and reported according to the Animal Research: Reporting ofIn VivoExperiments(ARRIVE) guidelines (Percie du Sert et al.,2020).
Cell culture and treatment
Human cerebral microvascular endothelial (hCMEC/D3) cells (Cat# SCC066,RRID: CVCL_U985;Weksler et al.,2005) were purchased from MilliporeSigma and maintained in Endothelial Cell Medium containing 5% fetal bovine serum and 1% penicillin-streptomycin (ScienCell,San Diego,CA,USA,Cat# 1001).
hCMEC/D3 cells were exposed to the following conditions: Aβ1–42(MilliporeSigma,Cat# A9810),incubated with 1–10 μM Aβ1–42for 24 hours;Aβ1–42+GW4869 (nSMase inhibitor,Selleck,Houston,TX,USA,Cat# S7609;Menck et al.,2017),incubated with 10 μM Aβ1–42and 10 μM GW4869 for 24 hours;verapamil (P-gp inhibitor,MilliporeSigma,Cat# V4629),incubated with 10 μM verapamil for 24 hours;OE-nc,transfected with pcDNA3.1(+) empty vector (RRID: Addgene_47388) for 24 hours;OE-nSMase1,transfected with pcDNA3.1(+)-nSMase1 vector for 24 hours;si-nc,transfected with negative control siRNA for 48 hours;si-nSMase1,transfected with nSMase1-specific siRNA for 48 hours;OE-nSMase1+GW4869,transfected with pcDNA3.1(+)-nSMase1 vector for 24 hours,followed by treatment with 10 μM GW4869 for 24 hours;and si-nSMase1+ceramide (MilliporeSigma,Cat# 22244),transfected with nSMase1-specific siRNA for 48 hours,followed by treatment with 10 μM ceramide for 24 hours.The siRNA sequences are shown inAdditional Table 1.
Cell transfections
Plasmids (pcDNA3.1(+) empty vector and pcDNA3.1(+)-nSMase1 vector) and siRNAs (negative control siRNA and nSMase1-specific siRNA) were transfected into hCMEC/D3 cells using Lipo8000TMTransfection Reagent (Beyotime,Cat#C0533) following the manufacturer’s protocol.
Dot blot analyses of Aβ levels
The Aβ levels in the brain tissue homogenates of APP/PS1 mice and agematched WT C57BL/6J mice were measured by dot blot assay (Xu et al.,2007).Briefly,tissue homogenate from whole brain was prepared in PBS containing protease inhibitor cocktail (MilliporeSigma,Burlington,MA,USA,Cat# P2714).The supernatants were collected following centrifugation at 13,800 ×gfor 20 minutes at 4°C,and protein content was determined using the BCA protein kit (Thermo Fisher Scientific,Waltham,MA,USA,Cat#23225).Total protein (10 μg) was spotted onto a polyvinylidene fluoride(PVDF) membrane (MilliporeSigma,Cat# SLHVR13SL).The membrane was blocked with 5% non-fat milk (Servicebio,Wuhan,Hubei Province,China,Cat#GC310001-100g) in PBS and then incubated with mouse polyclonal anti-Aβ1–40antibody (1:50,Bioss,Beijing,China,Cat# bs-0106M,RRID: AB_10857192)and rabbit polyclonal anti-Aβ1–42antibody (1:50,Bioss,Cat# bs-0107R,RRID:AB_10858046).GAPDH (rabbit monoclonal anti-GAPDH antibody,1:50,Beyotime,Shanghai,China,Cat# AF1186,RRID: AB_2920889) was used as the internal control.After 4 hours of incubation,the membrane was washed and incubated with secondary antibody labeled with horseradish peroxidase(horse anti-mouse antibody,1:1000,Cell Signaling Technology,Danvers,MA,USA,Cat# 7076,RRID: AB_330924) and goat anti-rabbit antibody,1:1000,Cell Signaling Technology,Cat# 7074,RRID: AB_2099233) for 1 hour.The blots were washed with PBS containing 0.1% Tween-20 (Servicebio,Cat#GC204002) and visualized using an enhanced chemiluminescence kit (Thermo Fisher Scientific,Cat# WP20005).Quantitative analysis was performed using ImageJ software (version 1.52,National Institutes of Health,Bethesda,MD,USA;Schneider et al.,2012) and expressions were normalized to GAPDH.
Quantitative reverse transcription-polymerase chain reaction
Total RNA was extracted from brain tissues of APP/PS1 and WT mice using Trizol reagent (Thermo Fisher Scientific,Cat# 15596026).Quantitative reverse transcription-polymerase chain reaction (qRT-PCR) was performed to synthesize cDNA using the Premium One-Step RT-PCR kit (Thermo Fisher Scientific,Cat# 11731015).qRT-PCR was performed in triplicate for the detection of P-gp,Ezrin,Radixin and Moesin using the SYBR Green PCR Master Mix kit (Takara,Kyoto,Japan,Cat# RR430A).The PCR program consisted of activation at 95°C for 3 minutes,followed by 40 amplification cycles of 95°C for 15 seconds,60°C for 15 seconds,and elongation at 72°C for 30 seconds.The 2–∆∆Ctcalculation method was used to analyze expression.Gapdh was used as an internal control and the results are presented as fold changes relative to the control group.The primers used for qRT-PCR are shown inAdditionalTable 1.
Western blot analysis
Brain tissues (80 mg) were lysed in 100 μL RIPA lysis buffer (Beyotime,Cat#P0013B) containing 5 mM EDTA and protease inhibitors.The lysate was vortexed and incubated on ice for 30 minutes,disrupted by a 30 second burst of super sonication,and then centrifuged at 5400 ×gfor 20 minutes at 4°C.The supernatant was collected and the protein concentration was determined using the BCA assay.Protein (50 μg) in 10 μL of SDS sample buffer was incubated at 100°C for 5 minutes and then separated by sodium dodecyl sulfate-polyacrylamide gel electrophoresis and subsequently blotted onto a PVDF membrane.The membrane was blocked with 5% non-fat milk (Servicebio,Cat# GC310001-100g) in PBS containing 0.1% Tween-20 (Servicebio,Cat#GC204002) and then incubated with the following primary antibodies: rabbit monoclonal anti-P-glycoprotein antibody (1:300,Abcam,Cambridge,UK,Cat#ab170904,RRID: AB_2687930),mouse monoclonal anti-ezrin antibody (1:1000,Thermo Fisher Scientific,Cat# 35-7300,RRID: AB_87580),rabbit monoclonal anti-radixin antibody (1:1000,Cell Signaling Technology,Cat# 2636,RRID:AB_2238294),rabbit monoclonal anti-moesin antibody (1:1000,Thermo Fisher Scientific,Cat# PA5-34666,RRID: AB_2552018),rabbit polyclonal anti-SMS1 antibody (1:1000,Bioss,Cat# bs-4216R,RRID: AB_11111297),rabbit polyclonal anti-SMS2 antibody (1:1000,Bioss,Cat# bs-5694R,RRID: AB_2920897),rabbit polyclonal anti-nSMase1 antibody (1:1000,Bioss,Cat# bs-19472R,RRID: AB_2920898),and rabbit monoclonal anti-GAPDH antibody (1:4000,Beyotime,Cat# AF1186,RRID: AB_2920889).Following 24 hours of incubation,the membrane was washed and incubated with horse anti-mouse secondary antibody conjugated with horseradish peroxidase (Cell Signaling Technology,1:1000,Cat# 7076,RRID: AB_330924) and goat anti-rabbit secondary antibody conjugated with horseradish peroxidase (1:1000,Cell Signaling Technology,Cat# 7074,RRID: AB_2099233) for 1 hour.The blots were washed with PBS containing 0.1% Tween-20 (Servicebio,Cat# GC204002) and visualized using an enhanced chemiluminescence kit (Thermo Fisher Scientific,Cat# WP20005).Quantitative analysis was performed using ImageJ software (version 1.52,National Institutes of Health) and protein expression was normalized to GAPDH.
Determination of P-gp functionality
At 45 minutes after intravenous (tail vein) administration of rhodamine123(rh123,0.2 mg/kg,J&K Chemical,Beijing,China,Cat# 211600),mice were killed by cervical dislocation following anesthesia (4% isoflurane,16 mL/min,RWD,Cat# R510-22-8).Whole brain tissues were re-suspended in purified water (100 μL water per 80 mg tissue),homogenized,and centrifuged at 13,800 ×gfor 5 minutes.The blood samples were centrifuged at 13,800×gfor 5 minutes.The supernatants from brain tissues and blood samples were collected and subjected to fluorescent rh123 measurement by high performance liquid chromatography (HPLC).
HPLC analysis was performed using an Agilent 1260 series HPLC system(Agilent,Santa Clara,CA,USA) equipped with a quaternary pump,a UV detector,and an Agilent C18 column (5 μm particle size,length × inside diameter=25 cm × 4.6 mm) preceded by a C18 guard column (Dikma,Beijing,China).The separation of rh123 was carried out isocratically using 20 mM of sodium acetate buffer (pH 3.0): acetonitrile (67:33,v:v) at a flow rate of 1.0 mL/min.The detection wave lengths were 488 nm (λex) and 535 nm (λem) for rh123.The retention time of rh123 was 6.5 minutes,and the standard curve of rh123 was linear within the range 0.0001–0.3 μg/mL (r2=0.998).
The functionality of P-gp in cells was analyzed byin vitrouptake study using hCMEC/D3 cells that were recently developed as anin vitrohuman BBB model(Balzer et al.,2022).hCMEC/D3 cells were seeded in six-well plates at 200,000 cells per well and grown to 90% confluence;cells were washed twice with PBS and incubated with 5 μM rh123 at 37°C in the dark for 90 minutes.The cells were washed five times with ice cold PBS to remove residual rh123,lysed in 5% Triton X-100 (MilliporeSigma,Cat# X100) (in 1 M Tris-HCl),and vortexed vigorously prior to extraction of the total proteins.The protein concentration was determined using the BCA protein kit (Thermo Fisher Scientific,Cat#23225).Intracellular accumulation of rh123 was detected using HPLC.
Immunofluorescence
Mice were anesthetized (4% isoflurane) and perfused with 4%paraformaldehyde in PBS.The brains were rapidly dissected and fixed in 4%paraformaldehyde for 24 hours and then processed for paraffin-embedding and sectioned using standard protocols.Coronal mice brain sections (40 μm,frozen sections) were stained using rabbit polyclonal anti-Aβ1–42antibody(1:50,Bioss,Cat# bs-0107R,RRID: AB_10858046),mouse monoclonal anti-Pglycoprotein antibody (1:50,Abcam,Cat# ab3366,RRID: AB_303744),Alexa Fluor 488-Labeled goat anti-rabbit fluorescent antibody (1:1000,Abcam,Cat#ab150077,RRID: AB_2630356),and Alexa Fluor 555-Labeled goat anti-mouse fluorescent antibody (1:1000,Abcam,Cat# ab150114,RRID: AB_2687594).The nuclei were stained with DAPI (1:1000,Beyotime,Cat# C1002).The brain sections were imaged using a confocal laser-scanning microscope (Carl Zeiss,Jena,Thuringia,Germany).No staining was detected in the absence of primary or secondary antibodies.All sections were processed and imaged under identical conditions.Four sections from each mouse were analyzed and five images per section were captured.Quantitative analysis was performed using ImageJ software (version 1.52).
Measurement of SM level
Mouse brain tissues (100 mg) or hCMEC/D3 cells were homogenized in 1 mL of 1 M NaOH,and the total lipids were extracted twice from the tissues or cells with 1 mL of chloroform/methanol (2:1) solution.The organic layer was dried under nitrogen gas and re-solubilized in 0.2 mL of chloroform containing 2% Triton X-100.The lipid extract was dried and re-suspended in 0.2 mL of H2O containing 2% Triton X-100.Prior to the assay of SM level,the enzyme solution (containing SMase 25 U,alkaline phosphatase 500 U,choline oxidase 25 U,peroxidase 1000 U,DAOS 0.73 mM,and 4-aminoantipyrine 0.73 mM)was prepared in 50 mL of reaction buffer (0.05 M Tris-HCl with 0.66 mM calcium chloride,pH 8.0).Next,10 μL of the lipid extract was added to 100 μL of enzyme solution.After reacting at 37°C for 45 minutes,the absorption at 595 nm was measured on a spectrophotometric plate reader (Thermo Fisher Scientific;Zhang et al.,2011).
Measurement of ceramide level
Mouse brain tissues (100 mg) or hCMEC/D3 cells were homogenized to obtain the lipid extract as described in the section “Measurement of SM level.” The ceramide level was analyzed using an ELISA kit (Mlbio,Shanghai,China,Cat#ml037499).
nSMase1 activity assay
The activity of nSMase1 in the mouse brains and hCMEC/D3 cells was determined using the Amplex® Red Sphingomyelinase Assay Kit (Thermo Fisher Scientific,Cat# A12220) as described in the manual.The fluorescence of samples at 550 nm excitation and 590 nm emission was monitored at different times using a spectrophotometric plate reader (Thermo Fisher Scientific).nSMase1 activity was calculated from the slope of an intrinsic fluorescencevs.time graph and standardized per mg of protein (mU/h/mg protein).
Intracerebroventricular injection of Aβ1–42 in mice
Aβ1–42stock solution was prepared at a concentration of 1 mg/mL in sterile 0.1 M PBS and aggregated by incubation at 37°C for 4 days.The aggregated form of Aβ1–42was administered to 6-week-old C57BL/6J mice (400 pmol/mouse) by intracerebroventricular (i.c.v.) injection.In short,mice were anesthetized with 4% isoflurane (16 mL/min,RWD,Cat# R510-22-8) and maintained with 1.75–2.5% isoflurane (4–10 mL/min).Mice were placed in a stereotactic frame and the skull was exposed by a midline scalp incision.Next,3 μL of Aβ1–42or PBS were injected in the right striatum (anteroposterior +1.0 mm,mediolateral+2.0 mm,dorsoventral–3.0 mm;Paxinos and Franklin,2013) at a flow rate of 0.5 μL per minute with a 3 mm long 28-gauge stainless steel syringe needle(Hamilton,Bonaduz,Grisons,Switzerland) at a depth of 3 mm.After needle removal,the skin was stapled.After 7 days,the mice were killed and whole brain and blood samples were collected at 45 minutes following intravenous(tail vein) administration of rh123.
Methylthiazolyl tetrazolium assay
Cell viability of hCMEC/D3 cells was detected by the methylthiazolyl tetrazolium (MTT) assay (Neves et al.,2021).Cells were plated in 96-well plates and pretreated with reagents described in the section “Cell culture and treatment.” The Endothelial Cell Medium was removed and cells were incubated with 0.5 mg/mL MTT (MilliporeSigma,Cat# M2003) for 4 hours at 37°C.The reaction was stopped by adding dimethyl sulfoxide (MilliporeSigma,Cat# D8418).The amount of MTT formazan product was determined by measuring the absorbance at 570 nm with a spectrophotometric plate reader(Thermo Fisher Scientific).
Statistical analysis
GraphPad Prism 6 (GraphPad,San Diego,CA,USA,www.graphpad.com) was used to create graphs and perform statistical analyses.Data are expressed as the means ± standard error of the mean (SEM).One-way analysis of variance followed by Dunnett’spost hoctest was used to compare several treatment groups with the control group.Student’st-test was used to determine the difference between two groups.Significance values were set atP< 0.05.
Results
The expression and functionality of P-gp in APP/PS1 mice is different from that in WT mice and the differences change with age
We used APP/PS1 mice,an animal model of AD,in the current study.The expression profile of Aβ in APP/PS1 mice and WT mice was analyzed by dot blot assay.The levels of Aβ1–40and Aβ1–42in the brains of APP/PS1 mice were higher than those of WT mice at the same ages of 3 (20%,5%),6 (15%,–5%),9 (40%,35%),and 12 (35%,20%) months,respectively.These results indicated that the Aβ levels increased with age in both APP/PS1 and WT mice (AdditionalFigure 1).
The expression of P-gp mRNA and protein in the brains of APP/PS1 mice and WT mice at different ages was measured by qRT-PCR and western blot assay.The expression of P-gp in both WT and APP/PS1 mice tended to increase with age,especially in APP/PS1 mice.At 3 months of age,the expression of P-gp in APP/PS1 mice was lower than that of WT mice,while at 6 months of age,the expression of P-gp in APP/PS1 was similar to that in WT mice;at 9 and 12 months of age,the expression of P-gp in APP/PS1 mice was significantly higher than that in WT mice (P< 0.01;Figure 1AandB).
P-gp functionality is represented by brain-to-plasma partition of the P-gp substrate rh123,and a decreased brain-to-plasma partition implicates increased P-gp functionality in brain.We measured brain and plasma concentrations of rh123 in APP/PS1 and WT mice at different ages,and the ratios of brain-to-plasma concentration were calculated.In the plasma,the concentrations of rh123 of both mice exhibited no evident difference at all test ages.In the brain,the concentrations of rh123 of both mice were equivalent at 3 and 6 months of age but different at 9 and 12 months of age(part of the data inFigure 1were adopted from our previous report (Du and Yang,2014)).At 3 and 6 months of age,the ratios of brain-to-plasma concentration of rh123 of the two mice were similar,suggesting that the functionalities of P-gp were not different.However,the functionality of P-gp in APP/PS1 mice was higher at 9 months of age and significantly lower at 12 months of age compared with that of WT mice (P< 0.05;Figure 1C–E).
The expression of P-gp of APP/PS1 mice tended to increase with age,with significantly higher expression at 9 and 12 months of age than that of WT mice (P< 0.01;Figure 1AandB).The functionality of P-gp of APP/PS1 mice did not change with age but was significantly lower than that of WT mice at 12 months of age (P< 0.05;Figure 1C–E).These results indicate that the expression of P-gp in APP/PS1 mice increased in the early stage of AD (9 months old (Sompol et al.,2021)) and the functionality of P-gp was impaired in the later stage of AD (12 months old (Wang et al.,2016)).
P-gp accumulates around deposited Aβ in the hippocampi of APP/PS1 mice
To study the relationship between P-gp and Aβ,double immunostaining was performed on brain samples of WT and APP/PS1 mice at all test ages.Aβ deposition began to appear in APP/PS1 mice at 6 months of age and in WT mice at 9 months of age.Over time,Aβ deposition increased;the deposition was significantly higher at 6,9,and 12 months of age in APP/PS1 mice than in WT mice (P< 0.05;Figure 1F).Along with the increase of Aβ deposition,the P-gp expression also increased.The enrichment of P-gp surrounding Aβ deposition in the hippocampi of APP/PS1 mice was observed at 9 and 12 months of age,especially at the later age (Figure 1F).The co-localization of Aβ with P-gp was observed in the hippocampi of APP/PS1 mice at 12 months(Figure 1G).Taken together,these results suggest that the expression of P-gp in the brains of APP/PS1 mice is associated with the pathological progression of AD.
Variation of ezrin expression corresponds to variation of P-gp expression
Expression profiles of ERM mRNA and proteins in the brains of APP/PS1 mice and WT mice at different ages were measured by qRT-PCR and western blot(Figure 2).At 3 months of age,the expressions of ERM genes and proteins in APP/PS1 mice were lower than those of WT mice.At 6 months of age,there was no significant difference between the expressions of ERM genes and proteins in APP/PS1 and WT mice.At 9 months of age,ezrin mRNA and protein levels in APP/PS1 mice were remarkably higher than that in WT mice (P< 0.01),while the expressions of radixin and moesin were lower than those in WT mice.At 12 months of age,the mRNA expressions of ezrin and radixin in APP/PS1 mice were much higher than those in WT mice (P< 0.01),while that of moesin was not different to that in WT mice.However,at the protein level,only the expression of ezrin in APP/PS1 mice was much higher than that in WT mice.These results indicate that the variation of ezrin expression with age in the brains of APP/PS1 mice reflected the variation of P-gp expression with age.
SM metabolism in APP/PS1 mice is different from that in WT mice
The SM levels in the brains of APP/PS1 mice and WT mice were measured.The SM levels in the brains of APP/PS1 mice at 3 and 6 months of age were slightly lower than those of age-matched WT mice,but the difference was not significant.However,there was a significant decrease in SM level in APP/PS1 mice at 9 and 12 months of age compared with that in age-matched WT mice,by approximately 30% and 45%,respectively (P< 0.05;Figure 3A).
Next,we explored ceramide levels and the expressions of SM metabolismrelated enzymes.The ceramide levels in the brains of APP/PS1 mice and WT mice both increased with age,and the increase was more remarkable in APP/PS1 mice.The ceramide levels in the brains of APP/PS1 mice at 3,6,9,and 12 months were significantly increased compared with those in age-matched WT mice,by approximately 64%,42%,126%,and 133%,respectively (P< 0.05;Figure 3B).Interestingly,while there was a significant change in the SM levels between APP/PS1 and WT mice at 9 and 12 months of age (P< 0.05;Figure 3A),there was no difference in the expression of SMS1 and SMS2 between the two types of mice at all tested ages.However,nSMase1 expression of APP/PS1 mice at 9 and 12 months of age was significantly higher than that of age-matched WT mice (P< 0.01;Figure 3CandE).The trend of the change of the nSMase1 activity was similar to that of the nSMase1 expression (Figure 3D).
Together,these results indicated that SM metabolism in APP/PS1 mice is different from that in WT mice,and the SM level,ceramide level,and the expression and activity of nSMase1 markedly changed along with the severity of AD.
The expression and functionality of P-gp and SM metabolism in the AD mouse model induced by i.c.v.injection of Aβ are different from those in control mice
Given that the expression and activity of P-gp and SM metabolism in the brains of APP/PS1 mice were associated with the pathological progression of AD and were different from those in age-matched WT mice,we further investigated the association between P-gp,SM,and Aβ in the AD mouse model induced by i.c.v.injection of Aβ1–42.
The results showed that the expressions of P-gp,ezrin,and nSMase1 in the brains of the mice were significantly increased upon Aβ1–42injection(P< 0.05;Figure 4AandB).Additionally,in mice i.c.v.injected with Aβ1–42,P-gp functionality was significantly decreased (P< 0.05;Figure 4C–E).Furthermore,injection of Aβ1–42caused a significant decrease in SM level (P<0.05;Figure 4F),a significant increase in ceramide level (P< 0.05;Figure 4G),and a significant increase of nSMase1 activity (P< 0.05;Figure 4H).All these changes were consistent with the results observed in APP/PS1 mice.
The expression and functionality of P-gp and SM metabolism in Aβ1–42-treated hCMEC/D3 cells are different from those in control cells
On the basis of the above results,the relationship among P-gp,SM and Aβ was further examined in Aβ1–42-treated hCMEC/D3 cells.hCMEC/D3 cells are a model for the study of Aβ clearance by the human BBB.We found that Aβ1–42treatment had no effect on the viability of hCMEC/D3 cells at the concentrations of 1–10 μM (Figure 5A).Aβ1–42led to increases in the expressions of P-gp,ezrin,and nSMase1,especially at 10 μM.The expressions of SMS1 and SMS2 were unaffected by the treatment (Figure 5BandAdditional Figure 2).
To further address the effect of Aβ on P-gp functionality,we measured rh123 uptake by hCMEC/D3 cells treated with Aβ1–42.Both 5 and 10 μM Aβ treatment up-regulated the expression of P-gp in hCMEC/D3 cells and the upregulation caused by 10 μM Aβ treatment was significant (P< 0.05;Figure5BandAdditional Figure 2).However,only 10 μM Aβ treatment significantly increased the accumulation of rh123,which means decreased functionality of P-gp (P< 0.05;Figure 5C).One reason may be that a high concentration (10 μM) Aβ treatment results in a worse condition in hCMEC/D3 cells than a lower concentration Aβ treatment.The SM level was significantly decreased and the ceramide level was significantly increased with 10 μM Aβ1–42treatment (P<0.05;Figure 5DandE).Furthermore,the activity of nSMase1 was significantly increased by 10 μM Aβ1–42treatment (P< 0.05;Figure 5F).
nSMase1 plays an important role in the changes of SM level and P-gp expression and functionality
SM induces the expression of nuclear transcription factor pregnane X receptor,which modulates the expression and functionality of P-gp (Jin et al.,2016).We previously studied the correlation between SM and P-gp using SMS2–/–mice and found that SMS2 deficiency led to reduced SMS activity,decreased SM level,and downregulated expression and functionality of P-gp in brain (Zhang et al.,2011).We also showed that the specific knockdown of SMS1 or SMS2 with siRNA in Caco-2 cells substantially decreased the SM level and the expression and functionality of P-gp.However,in the present study,we found that nSMase1 instead of SMS1 or SMS2 was significantly upregulated in AD cases.Therefore,we investigated the potential role of nSMase1 in the modulation of SM on P-gp.
We first assessed whether the nSMase1 inhibitor (GW4869 (Menck et al.,2017)) interfered with the changes of SM metabolism and P-gp expression and functionality caused by Aβ1–42treatment in hCMEC/D3 cells.The SM level was significantly decreased and ceramide level and nSMase1 activity were significantly enhanced when hCMEC/D3 cells were treated with Aβ1–42,while supplementation with GW4869 reversed these effects(P< 0.05;Figure 6A–C).The increase in the expressions of P-gp and ezrin caused by Aβ1–42treatment was also reversed by GW4869 (Figure 6D).The functionality of P-gp was significantly decreased by the treatment of Aβ1–42or P-gp inhibitor verapamil,and it was reversed by the supplementation with GW4869 (P< 0.05;Figure 6E).
We further clarified the modulatory effects of nSMase1 on SM metabolism and P-gp expression and functionality with over-expression and knockdown strategies.The expressions of nSMase1,P-gp,and ezrin were increased,the nSMase1 activity and the ceramide level were significantly increased,and the SM level was significantly decreased in nSMase1-overexpressing hCMEC/D3 cells (hCMEC/D3 cells transfected with pcDNA3.1(+)-nSMase1 vector)compared with those in the OE-nc group (hCMEC/D3 cells transfected with pcDNA3.1(+) empty vector) (P< 0.05;Figure 6F).nSMase1 knockdown in hCMEC/D3 cells produced the opposite effects (P< 0.05;Figure 6G).In addition,the increase of P-gp and ezrin expression and P-gp functionality caused by nSMase1 overexpression was inhibited when GW4869 was used(Figure 6H).The decrease in P-gp and ezrin expression and P-gp functionality caused by nSMase1 knockdown was restored when ceramide was supplemented (Figure 6I).
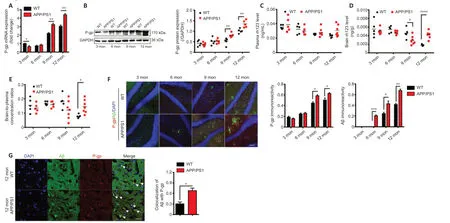
Figure 1|The expression and the functionality of P-gp and the expression of Aβ in the brains of APP/PS1 mice compared with those in age-matched WT mice at different ages.
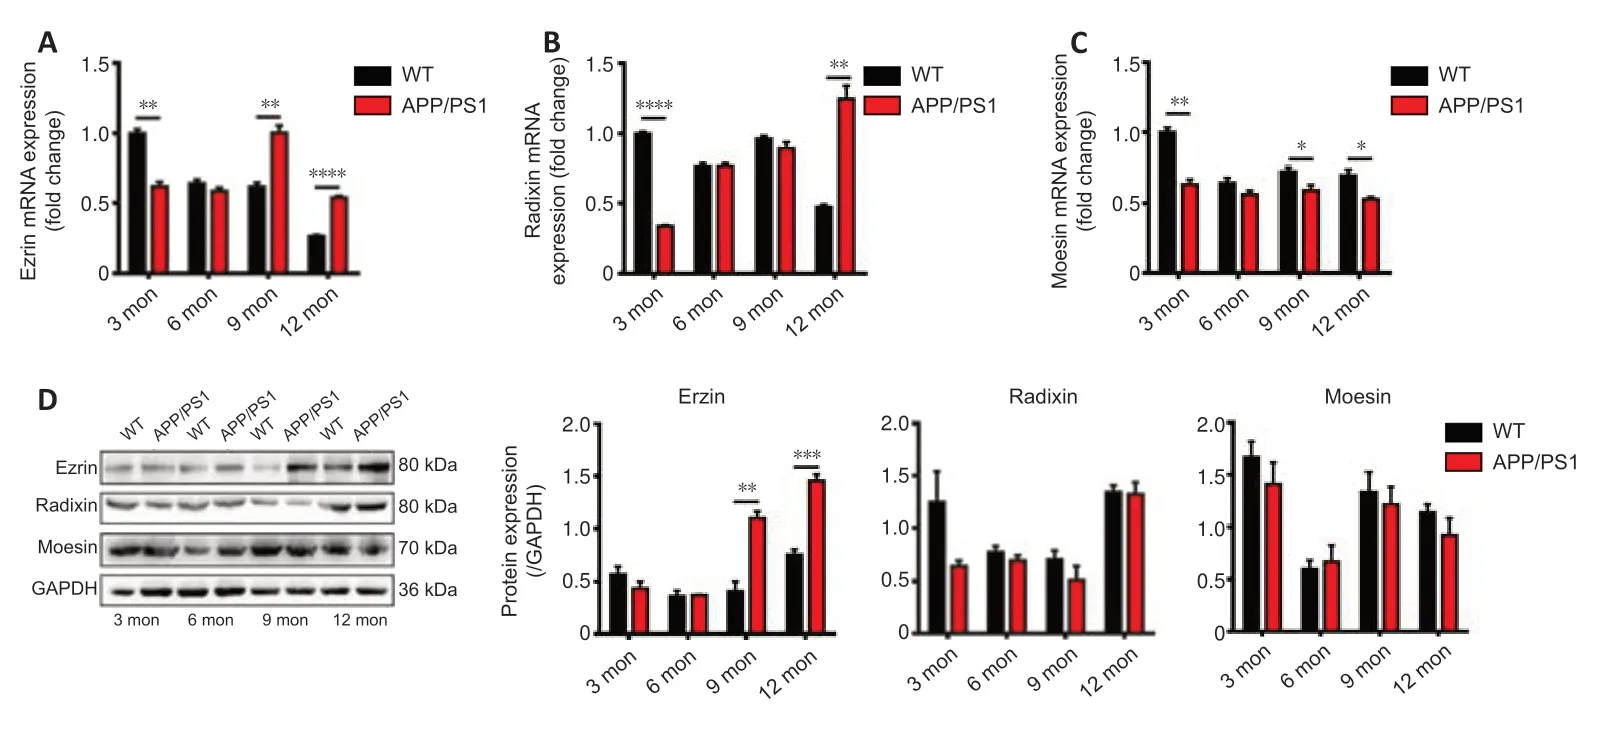
Figure 2|The expression of ERM in the brains of APP/PS1 mice compared with that in age-matched WT mice.
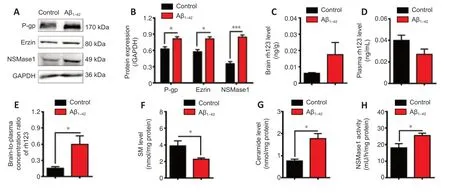
Figure 4|The expression and functionality of P-gp and SM metabolism in the Alzheimer’s disease mouse model induced by i.c.v.injection of Aβ1–42.
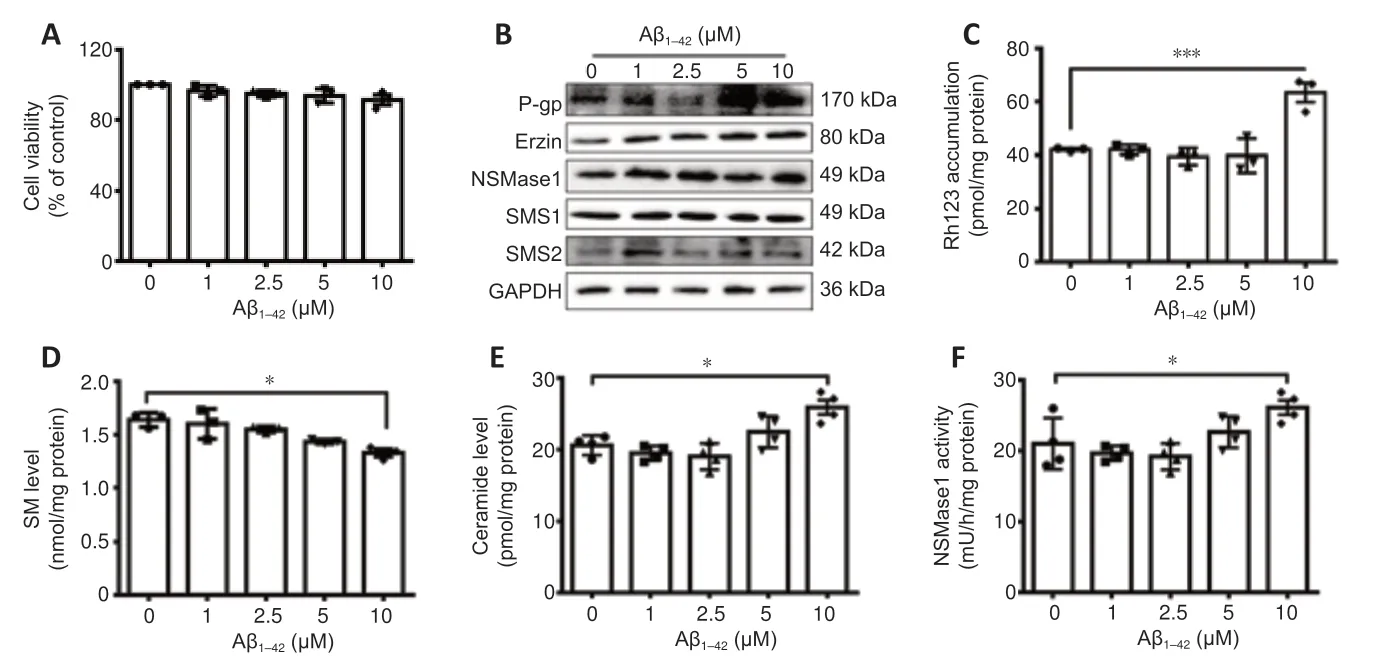
Figure 5|The effect of Aβ1–42 treatment on SM and P-gp in hCMEC/D3 cells.
These results indicated that nSMase1 regulates the expression and the functionality of P-gp via the SM/ceramide pathway.
Discussion
In the current study,we first used APP/PS1 mice at different ages to investigate the variations of P-gp during the pathological process of AD.The expression of P-gp in the brains of WT and APP/PS1 mice tended to increase with age,more evidently in APP/PS1 mice,and the expressions of P-gp in the brains of APP/PS1 mice at 9 and 12 months of age were significantly higher than those of WT mice.Chiu et al.(2015) examined protein and mRNA expression of P-gp in brains of humans (20–100 years old),including AD subjects,and found that cortical endothelial P-gp expression was decreased in brains of AD cases compared with that in controls.Trends in P-gp expression during aging in humans were similar to those observed in aging rats.Microvessel P-gp mRNA remained unchanged with aging and AD (Chiu et al.,2015).The difference in the results may be from different analytical methods,genus,and tissues.In our study,the functionality of P-gp in APP/PS1 mice was similar to that of WT mice at 3 and 6 months of age,higher than that of WT mice at 9 months of age,and significantly lower than that of WT mice at 12 months of age.At 9 months of age,the rapid increase in Aβ deposition was accompanied by an increase in P-gp expression and functionality in APP/PS1 mice.This result is consistent with the previous report that showed that a compensatory upregulation of P-gp occurs in an attempt to reduce Aβ accumulation and/or deposition in AD patients at the earlier stages of AD (Sita et al.,2017;Chai et al.,2020).At 12 months of age,excessive deposition of Aβ continued to stimulate P-gp expression but not P-gp functionality in APP/PS1 mice,because Aβ accumulation can impair the function of P-gp (Chai et al.,2020).Another study also showed that the expressions of P-gp in the small vascular fraction in the brains of 14 months old Ttpa–/–APPsw mice were increased compared with those in WT mice,but the Aβ clearance was impaired,which is similar with our study (Nishida et al.,2009).
Abnormal SM metabolism in AD has been previously reported,but the results have been unclear (Pettegrew et al.,2001;Barrier et al.,2010;He et al.,2010;Filippov et al.,2012).Additionally,how SM metabolism changes along with the pathological process of AD was unknown.We found that the SM level in the brains of APP/PS1 mice was lower than that of WT mice at every examined age,which is consistent with previous studies showing decreased SM levels in the brains of AD patients compared with those in controls (He et al.,2010;Filippov et al.,2012).While the SM level did not change with age,the ceramide levels in the brains of APP/PS1 mice and WT mice both increased with age.The ceramide level in the brains of APP/PS1 mice was higher than that of age-matched WT mice.Similarly,the ceramide levels in the brains of AD patients are higher than those of age-matched neurologically normal control subjects (Filippov et al.,2012).Accumulation of long-chain ceramides in the brain of AD patients resulting from alterations in sphingolipid metabolism may contribute to neurotoxic action of Aβ and exacerbate progression of the disease (Jazvinscak Jembrek et al.,2015).Ceramide has been suggested to play an important role in the pathogenesis of AD (Mizuno et al.,2016).
Further study on SM-related metabolic enzymes found that the expression and activity of nSMase1 rather than SMS were different between APP/PS1 and WT mice at comparable ages.We investigated the potential role of nSMase1 in the modulation of SM on P-gp in hCMEC/D3 cells.The results showed that Aβ activates nSMase1,which further regulated the expression and functionality of P-gp via the SM/ceramide pathway.Previous studies showed that Aβ activates nSMase,resulting in increased ceramide generation in human primary neurons and the cortex of mice (Lee et al.,2004;Jana and Pahan,2010).nSMase1-deficient mice show an inconspicuous phenotype and no accumulation or changed metabolism of sphingomyelin or other lipids(Zumbansen and Stoffel,2002).However,Yabu et al.(2015) showed that c-Jun N-terminal kinase–mediated nSMase1 activation and ceramide generation are responsible for various physiological and pathological regulatory effects in both zebrafish and human cells,which makes nSMase1 a viable therapeutic target for AD treatment.Together,these results indicate that nSMase1 may play an important role in the pathogenesis of AD.
In the current study,the changes of P-gp and SM metabolism found in APP/PS1 mice were also observed in the AD mouse model induced by injection of Aβ and hCMEC/D3 cells treated with Aβ.We conclude that the functionality of P-gp was impaired under severe pathological conditions,whether in hCMEC/D3 cells under high concentration Aβ treatment or APP/PS1 mice in the later stage of AD.Both ourin vitroandin vivoresults revealed the relationship among P-gp,SM,and Aβ in AD.
This study has some limitations.First,we used APP/PS1 transgenic mice and Aβ-treated mice in this study,but the animal models reproduce only some aspects of AD.Second,hCMEC/D3 cells were the only human cell line used in the study for analyses.Therefore,to further confirm the relationship among P-gp,SM,and Aβ in AD,more patients and cell lines should be tested.Our results suggest that Aβ treatment increased the expression and activity of nSMase1 and the upregulated nSMase1 decreased the activity of P-gp,resulting in the deposition of Aβ and the aggravation of AD pathology.Further studies on whether nSMase1 is related to the pathological process of AD may clarify if nSMase1 may become a potential target for AD treatment and more research is required.
In summary,we used two AD mouse models and one cell model to investigate the variations of Aβ,SM,and P-gp during the pathological process of AD.We proved for the first time that nSMase1 regulates the expression and function of P-gp via the SM/ceramide pathway.This work provides clues to understanding the relationship between Aβ deposition,SM level,Aβ removal,and P-gp expression and function in AD,and it also provides a new strategy for AD treatment and drug development.
Author contributions:Study design: QY,LSD,CXK;experimental implementation: ZKX,LSD,LS,SNZ;data analysis: ZKX,XF,HL;manuscript writing: ZKX,QY,TXH.All authors read and approved the final manuscript.
Conflicts of interest:The authors declare no competing financial interests.
Availability of data and materials:All data generated or analyzed during this study are included in this published article and its supplementary information files.
Open access statement:This is an open access journal,and articles are distributed under the terms of the Creative Commons AttributionNonCommercial-ShareAlike 4.0 License,which allows others to remix,tweak,and build upon the work non-commercially,as long as appropriate credit is given and the new creations are licensed under the identical terms.
Additional files:
Additional Table 1:Primers for quantitative reverse transcription-polymerase chain reaction and siRNA sequences.
Additional Figure 1:Dot blot analysis detected the Aβ1–40 and Aβ1–42 in APP/PS1 mice compared with those in age-matched wild type (WT) mice at different ages.
Additional Figure 2:Quantitative analysis of P-gp,ezrin,nSMase1,SMS1,and SMS2 protein expression (western blot assay).

Figure 6|The role of nSMase1 in the changes of SM level and P-gp expression and functionality caused by Aβ1–42treatment in hCMEC/D3 cells.
- 中国神经再生研究(英文版)的其它文章
- Neuro faces of beneficial T cells: essential in brain,impaired in aging and neurological diseases,and activated functionally by neurotransmitters and neuropeptides
- Profiling neuroprotective potential of trehalose in animal models of neurodegenerative diseases:a systematic review
- Cdk5 and aberrant cell cycle activation at the core of neurodegeneration
- Recent advancements in noninvasive brain modulation for individuals with autism spectrum disorder
- Vicious cycle of lipid peroxidation and iron accumulation in neurodegeneration
- Cell-based therapeutic strategies for treatment of spinocerebellar ataxias: an update