
Pectin fractions extracted sequentially from Cerasus humilis: Their compositions,structures,functional properties and antioxidant activities
2023-01-21 05:02ShikiZhngGeoffreyWterhouseTingtingCuiDongxioSunWterhousePengWu
食品科学与人类健康(英文) 2023年2期
Shiki Zhng,Geoffrey I.N.Wterhouse,b,Tingting Cui,c,Dongxio Sun-Wterhouse,b,*,Peng Wu,*
a College of Food Science and Engineering,Shandong Agricultural University,Taian 271018,China
b School of Chemical Sciences,The University of Auckland,Private Bag 92019,New Zealand
c Biology Institute,Qilu University of Technology (Shandong Academy of Sciences),Jinan 250103,China
Keywords:Cerasus humilis fruits Pectin fractions Structural characteristics Processing-related functional properties
ABSTRACT Three pectin fractions (water-soluble fraction (WSF),chelator-soluble fraction (CSF),and sodium carbonatesoluble fraction (NSF)) were obtained from Chinese dwarf cherry (Cerasus humilis) fruits.All of them were branched low methoxylated pectins with an amorphous or partially nanocrystalline nature and eight neutral monosaccharides (arabinose and galactose were most abundant).WSF,CSF and NSF had a degree of methylation (DM) of 35.82%,14.85% and 7.13%,uronic acid (UA) content of 76.02%,83.71% and 69.01%,and total protein content of 2.4%,2.1% and 8.8%,respectively.Their molecular weights were 340.31,330.16 and 141.31 kg/mol,respectively (analyzed by gel permeation chromatography (GPC)).WSF,CSF and NSF exhibited good rheological,thermal,emulsifying,emulsion-stabilizing,water-adsorbing,oil-binding,cholesterol-binding and antioxidant properties.NSF had the highest emulsifying,emulsion stabilizing,water-/oil-/cholesterol-binding and antioxidant capacities,followed by CSF.NSF had the highest viscosity(406.77 mPa·s),flowability,and resistance to heat-induced changes/damage,which may be related to its lowest polydispersity index,DM and UA content and highest protein content.The three pectin fractions with desirable characteristics can be used as food additives/ingredients and dietary supplements.
1.Introduction
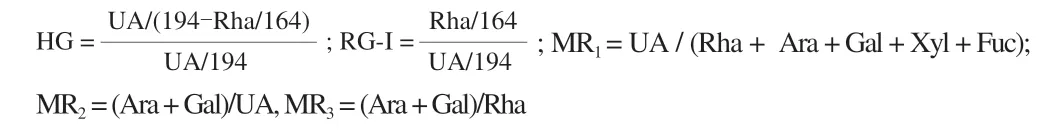
Pectins are complex polysaccharides composed mainly of three main structural domains of homogalacturonan (HG),rhamnogalacturon-I (RG-I) and rhamnogalacturon-II (RG-II) [1-3].Pectins can be obtained from a wide range of plants including sunf lowers,apples,pears and citrus fruits (high pectin contents),as well as soft fruits such as grapes and cherries (low pectin contents).Commercially available pectins are usually in the forms of highmethoxylated (HM) pectins (degree of methylation (DM) >50%),low-methoxylated (LM) pectins (DM <50%),and amidated pectins in which some galacturonic acid (GalA) residues are converted with ammonia to carboxylic acid amide.These pectins exhibit diverse functional properties including emulsifying [4],gelling [5],stabilizing and thickening [6]effects.HM pectins can form gels at acidic pHs,high sugar concentrations and temperatures,whereas LM pectins require divalent cations (such as Ca2+) to form gels.Amidated pectins behave like low-ester pectins,though they need less calcium to gel and the resulting gels are thermo-reversible.Depending on the types of pectins extracted by chemical and enzymatic methods combined with physical approaches,pectins have demonstrated anti-cancer and immunosuppressive and immunostimulating [7]activities,as well as capabilities of modulating glucose metabolism,lowering blood cholesterol levels [8],adsorbing and delivering bioactive substances and drugs [9].Accordingly,enormous efforts have been devoted to the development of pectic polysaccharide products with favorable processing properties and biological activities from various plantbased materials [2,3,10-12].
Cerasus humilis,commonly known as the Chinese dwarf cherry,is an endemic species of China and a member of theRosaceaefamily.It can be found throughout China,particularly in the North or Southwest China [13].C.humilisfruits are rich in nutrients(especially calcium: 441 mg/kg) and have distinct color and flavor,therefore,they are eaten fresh or processed into various food and beverage products [14].Large amounts of secondary grade or rejected freshC.humilisfruits are generated during harvesting,handling and processing due to their “soft” fruit nature [15].Thus,it is of economic interest to examine the potential of these secondary grade fruits for food applications.Preparation of functional pectic polysaccharide products from these fruits could be an effective approach to increase their utilization.To our knowledge,no systematic studies have been conducted to investigate the preparation of pectin products with desirable processing properties and bioactivities fromC.humilis,and examine the physicochemical,structural and functional characteristics of the resulting pectin products.
Herein,pectin-rich fractions,including water-soluble fraction(WSF),chelator-soluble fraction (CSF) and sodium carbonate-soluble fraction (NSF),were sequentially extracted fromC.humilisfruit powder.Then,the composition,molecular weight,morphological characteristics and structural characteristics of three resulting pectin fractions were investigated using techniques such as scanning electron microscopy (SEM),Fourier transform infrared (FTIR) spectroscopy,X-ray diffraction (XRD) and nuclear magnetic resonance (NMR)spectroscopy.Their functional properties (including emulsifying,thermal,rheological,and water-/oil-/cholesterol-binding properties)were also determined.Theirin vitroantioxidant activities were evaluated by electron paramagnetic resonance (EPR) spectroscopy.The study of these three pectin fractions provides the theoretical basis for the application of cherry pectins in the development of dietary supplements and functional foods.
2.Material and methods
2.1 Materials and chemicals
Secondary gradeC.humilisfruits were obtained from the College of Food Science and Engineering (Shandong Agricultural University,Taian,Shandong,China).These fruits were harvested in July 2019 and handled appropriately before being stored in a freezer(−80 °C).Frozen cherries were dried using a freeze dryer(SCIENTZ-12,Ningbo Scientz Biotechnology Co.,Ltd.) before being ground into powder using a high-speed grinder.
D-GalA standard was purchased from Yuanye Biotechnology Co.,Ltd.(Shanghai,China).Cholesterol standard was purchased from Solarbio Reagents (Beijing,China).All other reagents and chemicals were of analytical grade,and deionized-distilled water was used for all experiments.
2.2 Pectin extraction and purification
Three pectin-rich fractions,WSF,CSF and NSF,were prepared from the above-describedC.humilisfruit powder according to a modified method of Koh et al.[12](detailed extraction and purification procedures were summarized in Fig.1).Briefly,alcohol insoluble solids (AIS) were obtained by mixing the fruit powder with boiling ethanol (95%V/V;in water) at a solid-liquid ratio of 1:10 (m/V)for 15 min.The resulting pellets were washed with 4 volumes of absolute ethanol,centrifuged at 4 500 ×gand (23 ± 2) °C for 10 min with a refrigerated centrifuge (Eppendorf,Hamburg,Germany),filtered 4 times with filter paper (Fuyang Beimu Pulp&Paper Co.,Ltd.,Hangzhou,China),and washed once with acetone to yield AIS.The AIS was sequentially fractionated with 10 volumes of acetate buffer (50 mmol/L,pH 5.2) at (23 ± 2) °C for 24 h (the corresponding supernatant termed as “WSF”),10 volumes of acetate buffer(50 mmol/L,pH 5.2) containing 50 mmol/L ethylene diamine tetraacetic acid (EDTA) and 50 mmol/L ammonium oxalate at(23 ± 2) °C for 24 h (the corresponding supernatant termed as“CSF”),then the buffer containing 50 mmol/L sodium carbonate and 20 mmol/L sodium borohydride at (23 ± 2) °C for 24 h (the corresponding supernatant termed as “NSF”).All of the above buffers contained 0.02% sodium azide to prevent microbial growth.All the collected supernatants were concentrated via freeze drying,and precipitated by 3 volumes of absolute ethanol.The precipitated pellets were suspended in deionized water,and the suspension was dialyzed against 8 changes of pure deionized-distilled water with a 6-8 kDa dialysis bag (Shanghai Yuanye Biotechnology Co.,Ltd.,China) for 48 h to remove the impurities.Finally,the purified pectin fractions were freeze-dried,and stored at −20 °C until analysis.
2.3 Morphological examination of the three pectin fractions
The above freeze-dried pectin fractions (WSF,CSF and NSF)were examined by SEM (Supra 55,Zeiss,Germany).Each of these samples was placed on the specimen stub and lightly coated with gold using a sputter coater (EMS7620,New Jersey,USA).The morphology of these pectin samples was examined at magnifications of 100 × and 1 000 ×,using an electron beam acceleration voltage of 3 kV under vacuum.
2.4 The contents of moisture,ash,total protein and uronic acid (UA) of the three pectin fractions
The moisture contents of WSF,CSF and NSF were determined by the method of Kazemi et al.[16].The content of ash of WSF,CSF or NSF was determined based on the method of Zouambia et al.[17].The protein content of WSF,CSF or NSF was determined using the method of Lin et al.[8].The UA contents of WSF,CSF and NSF were determined following the protocols of Lin et al.[8]and used a plate reader (SpectraMax M5,BioPorto,Denmark) to measure the absorbance at 525 nm.
2.5 Monosaccharide composition analysis
The monosaccharide composition of each pectin-rich fraction(WSF,CSF or NSF) was analyzed by HPLC following the method of Gu et al.[18]with minor modifications.An aliquot (2 mL) of 2 mol/L trifluoroacetic acid (TFA) was added to the pectin fraction in a sealed glass tube to allow hydrolysis at 110 °C for 8 h before the addition of methanol and removal of excess TFA at 25 °C with a stream of nitrogen.The resulting dried hydrolysate was re-constituted in 2.0 mL of distilled water.The re-constituted samples were analyzed by a HPLC apparatus equipped with an Xtimate C18column(200 mm × 4.6 mm,5 μm) and an Ultimate 3000 system (Thermo,Ma,USA).The injection volume was 20 μL,and the mobile phase was 0.05 mol/L monobasic potassium phosphate solution at a flow rate of 1.0 mL/min and 30 °C.Compounds including mannose (Man),ribose (Rib),rhamnose (Rha),glucose (Glc),galactose (Gal),xylose(Xyl),arabinose (Ara) and fucose (Fuc) were used as standards.
2.6 Analysis of the phenolic compounds retained in the pectin fractions
The phenolic composition of each pectin-rich fraction was analyzed using a HPLC system (LC-20AD,Shimadzu,Japan)equipped with an ultimate Plus C18reverse-phase column(150 mm × 4.6 mm,5 μm).An appropriate amount of each pectin fraction was mixed with 2.0 mL of tetrahydrofuran (THF),then the mixture was subjected to ultrasonication in an ultrasonic bath for 1 h,and filtration through a 0.45 µm micropore membrane (Kehuai Instrument Co.,Ltd.,Shanghai,China).The filtrate was analyzed by HPLC (injection volume: 5 μL) and the mass of the residue left on the membrane was recorded.A gradient elution consisting of solvent A (water with 0.2% phosphoric acid) and solvent B (acetonitrile with 0.2% phosphoric acid) was used (flow rate: 1.0 mL/min): 0–3 min,5% B;3–10 min,18% B;10–16 min,28% B;16–25 min,60% B;25–30 min,95% B;30–35 min,95% B;35–35.1 min,5% B;35.1–47 min,5% B.The column temperature was 25 °C.HPLC spectra were acquired by photodiode array (PDA) detection in the range of 200–600 nm.External standards such as gallic acid,chlorogenic acid,corilagin,rutin,ellagic acid,chebulagic acid,cinnamoylquinic acid,cyanidin 3-O-glucoside,quercetin,and kaempferol,along with the database (including retention times and UV spectra) for standard phenolic compounds of the Shandong Agricultural University,were used to assist the identification and quantification of the phenolic compounds retained in the pectin samples.
2.7 Determination of molecular weight by GPC
GPC was used to determine the molecular weight (Mw) of the pectin fractions following the method of Talekar et al.[19].Molecular weight calibration used PEG/PEO standards (Agilent;ranging from 106 to 1 000 000 g/mol).The GPC (HPGPC,Shimadzu,Kyoto,Japan) used three serially connected TSK gel columns (GMPWXL,USA;pore size: 100 nm,>100 nm,and 10–100 nm).The test pectin samples were filtered through a 0.45 μm filter (Xinji Huarui Filter Paper Co.,Ltd.,Shijiazhuang,China),with 20 μL injected into the column and eluted at a flow rate of 0.6 mL/min and 35 °C using an aqueous solution (eluent) composed of 0.1 mol/L NaNO3and NaN3(0.06%).All measurements were performed in duplicate and the data was analyzed using the Eco Sec Analysis software.
2.8 FTIR spectroscopy analysis
The three pectin fractions were subjected to FTIR analysis to reveal their structural characteristics,based on the method of Grassino et al.[20].Briefly,a quantity (1.0 mg) of a pectin sample was mixed with 100 mg of potassium bromide (KBr) powder and pressed into a thin pellet at a force of 5 KN for 30 s,before being transferred to the disk holder of a FTIR spectrometer (Nicolet iS5 system;Thermo Fisher Scientific,USA).FTIR spectra were acquired over the wavenumber range of 4 000−400 cm−1with an average of 64 scans and a spectral resolution of 4 cm−1against the background.The DM of each pectin fraction was evaluated based on its FTIR spectrum [21],that is,the average percentage of the peak area at 1 743 cm−1(COO-R)to the sum of peak areas of the two peaks at 1 743 cm−1(COO-R) and 1 611/1 617/1 630 cm−1(COO-).
2.9 XRD analysis
Structural organization in the pectin samples was examined using a Bruker D8 Advance XRD (Bruker AXS,Germany).Each pectin sample was examined at (23 ± 2) °C over a diffraction angle(2θ) range of 10°−60° using a Cu Kα radiation source operating at a voltage of 40 kV and a current of 40 mA.
2.10 NMR spectroscopy analysis
To further examine the compositional structural characteristics of the three pectin fractions,the freeze-dried pectin samples in D2O were subjected to1H NMR analyses with a Bruker 600 MHz AVANCE III NMR spectrometer (Bruker,Rheinstetten,Germany).The NMR spectra were acquired (256 scans,25 °C) following the method of Hosseini et al.[21].Chemical shifts (δ,10−6) were measured relative to the standard tetramethylsilane (TEM) (δ=0).
2.11 Processing-related functional properties of the three pectin fractions
2.11.1 Thermo-gravimetric analysis (TGA) and differential scanning calorimetry (DSC) examination
The pectin samples were subjected to TGA and DSC examinations using a simultaneous thermal analyzer (Netzsch STA 449C,Germany) under the following conditions: linear increase at 10 °C/min;temperature range 60−600 °C;temperature accuracy 0.2 °C;temperature reproducibility (189.0 ± 0.1) °C;empty aluminum pan as the reference.The thermogravimetric (TG) and derivedthermogravimetric (DTG) curves of the pectin samples were then plotted to compare their weight change as a function of temperature and thermal stability.
2.11.2 Rheological behaviors
Aqueous solutions of the three pectin samples (1%) were prepared through adding the freeze-dried pectin fractions in Type I water(ASTM D1193-91) at ambient temperature with stirring for 4 h,and allowing complete hydration at 4 °C overnight.Each of the fully hydrated solutions was then subjected to viscosity or shear stress measurements over a shear rate range of 0.01−100 s−1at (25.0 ± 0.5) °C using a parallel plate rheometer (AR-2000ex,TA Instruments,USA)with geometry of 20 mm in diameter.All tests were performed in triplicate.The obtained shear stress data were fitted to the power-law(Ostwald-de Waele) model as the following equation:

Whereτis shear stress,Kis consistency coefficient,γis shear rate(s−1),andnis the flow behavior index.
2.11.3 Emulsifying properties
The emulsifying capacity (EC) and emulsion stability (ES) were evaluated according to the method of Bayar et al.[6].Emulsions of the three pectin fractions were prepared through mixing the corresponding pectin sample with corn oil (final concentrations:2% and 4% (in corn oil)).The mixtures were homogenized at 12 000 r/min for 3 min using a high-shear homogenizer (IKA T18 Stauffen,Germany),and then centrifuged at 4 600 ×gand room temperature for 5 min using a centrifuge (Eppendorf,Hamburg,Germany).EC was evaluated using the following equation:
WhereVeis the volume of the emulsion,andVmis the total volume of the system.
ES was evaluated using the above-described emulsions,which were further incubated at 80 °C for 30 min before the centrifugation at 4 600 ×gand room temperature for 10 min.ES was calculated as the following equation:
WhereViis the volume of the remaining emulsified layer,andVeis the volume of the initial emulsified layer.
2.11.4 Adsorption capacity for water (ACOW)
In order to obtain the adsorption capacity of pectin for water,the method of Gan et al.[22]was used.Briefly,one gram of a pectin sample (m1) was hydrated with 25 mL of Type I water (ASTM D1193-91) in a clean and sterile glass tube at room temperature for 2 h.After centrifugation at 4 800 ×gfor 10 min,the supernatant was immediately collected and weighted (m2).The ACOW was calculated using the following equation:

2.11.5 Binding capacity for vegetable oil (BCVO)
The adsorption capacity of the pectin samples for vegetable oil was determined according to the procedure described by Gan et al.[22].Briefly,a quantity (1 g) of each of the three kinds of pectin (m3) was mixed with 25 mL of soybean oil in a clean and sterile glass tube at room temperature for 2 h.After centrifugation at 4 800 ×gand room temperature for 10 min by the above-mentioned centrifuge,the supernatant was immediately collected and weighed (m4).The BCVO was evaluated using the following equation:

2.11.6 Binding capacity for cholesterol in egg yolk (BCCE)
The BCCE of each of the three pectin fractions was evaluated based on a previous method [23]with slight modifications.The egg yolk was whipped with 9 volumes of deionized water to yield an emulsion.The pectin sample (1 g) was mixed with 50 mL of the emulsion at pH 7.0 or 2.0 (these two pHs simulated the normal pH values of the small intestine and stomach,respectively),and the resulting mixtures were shaken at 80 r/min and 37 °C for 2 h.A blank was set up as an emulsion without a pectin sample.After shaking,4 mL of the pectin-yolk emulsion mixture or the blank was mixed with 16 mL of absolute ethanol (to precipitate pectin),and centrifuged at 4 800 ×gand room temperature for 20 min by the refrigerated centrifuge.The supernatants were collected and subjected to vacuum drying at 40 °C to remove the alcohol in the supernatants and concentrate the supernatants.Each of these concentrated supernatants was diluted with 4 volumes of acetic acid (90%).Absorbance at 550 nm was measured using a multifunctional microplate reader(SpectraMax M5,BioPorto,Denmark).A calibration curve was established for the determination of cholesterol content using a series of cholesterol standard solutions.The BCCE was calculated using the following equation:

Wherem5andm6were the weight of cholesterol in the solution before and after adsorption,m7was the weight of the added pectin sample.
2.12 Antioxidant activities of the three pectin fractions measured by EPR
The antioxidant activity of each of the three pectin samples in distilled water (25 mg/mL) was determined using an X-band(9.3 GHz) Bruker EMX EPR spectrometer (Bruker-Biospin,Germany) and following the method of Polak et al.[24]with some modifications.A DPPH solution without any pectin sample was used as the blank group,and the DPPH solution with ascorbic acid(25 mg/mL;AA) was used as the control group.The operational parameters were: temperature,25 °C;sweep time 30 s;central field,(3 510 ± 100) G;field modulation frequency 100 kHz;modulation amplitude,1.0 G;time constant,10.24;receiver gain,103G;microwave power,19.11 mW.Antioxidant capacity was evaluated based on the decrease of the central peak amplitude.
2.13 Statistical analysis
All data are expressed as mean and standard deviations of at least 6 measurements,and were analyzed by the analysis of variance(ANOVA) method using SPSS version 21 (IBM,New York,USA).The significance of the differences between data was determined by Duncan’s multiple range tests (P<0.05).
3.Results and discussion
3.1 SEM examinations
SEM examinations of the three freeze-dried pectin fractions (Fig.2)revealed that WSF appeared like big pieces of irregular thin flakes with smooth and continuous surfaces at a magnification of 100 ×,while looked like a piece of large foldable silk at a magnification of 1 000 ×.At the same magnification,NSF occurred in much smaller pieces/fragments compared to WSF.NSF appeared like “leaflike” fragments with a smooth,continuous and curling surface at a magnification of 1 000 × (Fig.2b).Compared with WSF and NSF,CSF appeared like a mixture of two different material patterns(Fig.2c): irregular thin flakes with smooth and continuous surfaces(appearance like WSF but sizes smaller those of WSF),and irregular flat materials with lots of holes.The enlarged image (Fig.2c) of the flat material with holes in CSF clearly showed an interconnected filament-like network with pores of different sizes.The differences in surface morphology and microstructures of WSF,CSF and NSF might result from their chemical compositions and structural organizations,which would influence their physicochemical characteristics and functional properties.The extraction conditions used in this study were rather mild (e.g.treatments at pH 5.2 and room temperature),therefore,the methoxyl and acetyl groups as well as the neutral sugar side chains were anticipated to be greatly retained.The extraction of WSF involved acetate buffer (50 mmol/L,pH 5.2) only.Acid treatments of pectin-based substances were reported to facilitate the reduction/removal of arabinans and arabinose substituents from RG-I domain [25].Accordingly,WSF might contain RG-I domain-rich pectins with considerably reduced amounts of arabinans and arabinose substituents,which partially explains WSF’s appearance (big and thin sheet with smooth and continuous surfaces).The extraction of CSF involved acetate buffer (50 mmol/L,pH 5.2),EDTA (a chelating agent) and ammonium oxalate,allowing chelating actions while minimizing the pectin degradation throughβ-elimination).The obtained CSF was anticipated to possess some characteristics of WSF while having cross-linking structures (including those developed from the egg box-like structures of calcium-pectin complexes).The extraction of NSF involved 50 mmol/L sodium carbonate (a dilute and mild base) and 20 mmol/L sodium borohydride (a reducing agent),therefore,pectins bound tightly to the fruit cell walls were expected to be pulled out in NSF (with reduced oxidative degradation of polysaccharide chains) [26].Since this was the last step of a series of extraction and an alkali was used,the obtained pectin materials in NSF likely occurred in smaller pieces/fragments.
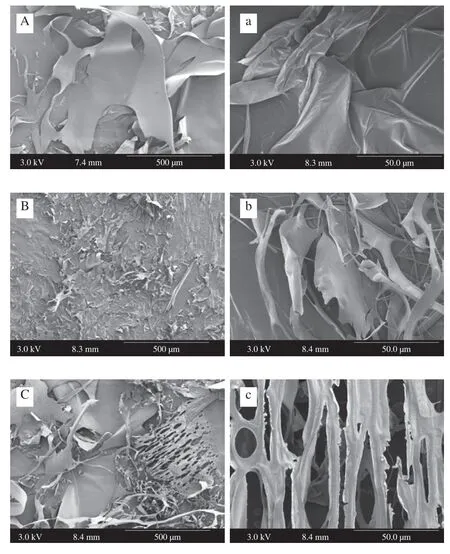
Fig.2 SEM images of WSF (A,a),NSF (B,b) and CSF (C,c) samples.The magnification of the images on the left (labelled with uppercase letters) and on the right (labelled with lowercase letters) was 100× and 1 000×.
3.2 Compositional characteristics and molecular weights of the three pectin fractions
Three pectin fractions were generated from theC.humilisfruit powders (yield: 10.128 g of dried WSF,1.414 g of dried CSF,and 6.543 g of dried NSF per 200 g of cherry fruit powder).The contents of moisture,ash and total protein of the pectin samples were 2.12%,4.24% and 24.3 μg/mg (2.4%) for WSF,1.81%,3.63% and 21.3 μg/mg(2.1%) for CSF,and 1.13%,3.08% and 88.2 μg/mg (8.8%) for NSF,respectively (Table 1).The presence of small amounts of proteinaceous materials in extracted pectin fractions was reported previously [15].The amount of protein retained in the pectin fractions was found to depend greatly on the pectin extraction method and source e.g.the pectin fraction obtained later in an acid extraction process tends to have a higher protein content [27].The UA contents(as GalA) of WSF,CSF and NSF were 76.02%,83.71% and 69.01%,respectively.HPLC analysis revealed that all the three pectin fractions contained kaempferol/kaempferol derivative(s),and their kaempferol/kaempferol derivative contents resembled: (0.029 ± 0.000) μg/mg dried weight for NSF,(0.028 ± 0.000) μg/mg dried weight for WSF,and(0.026 ± 0.000) μg/mg dried weight for CSF.A previous study [28]reported the presence of kaempferol 3-O-rhamnosyl-hexoside,hydroxylkaempferolO-acetyl-hexoside,kaempferol 3-O-acetyl-hexoside,and kaempferol 3-O-acetyl-rhamnosyl-rhamnoside in the extract obtained with 2% (V/V) formic acid methanol fromC.humilisfruits.
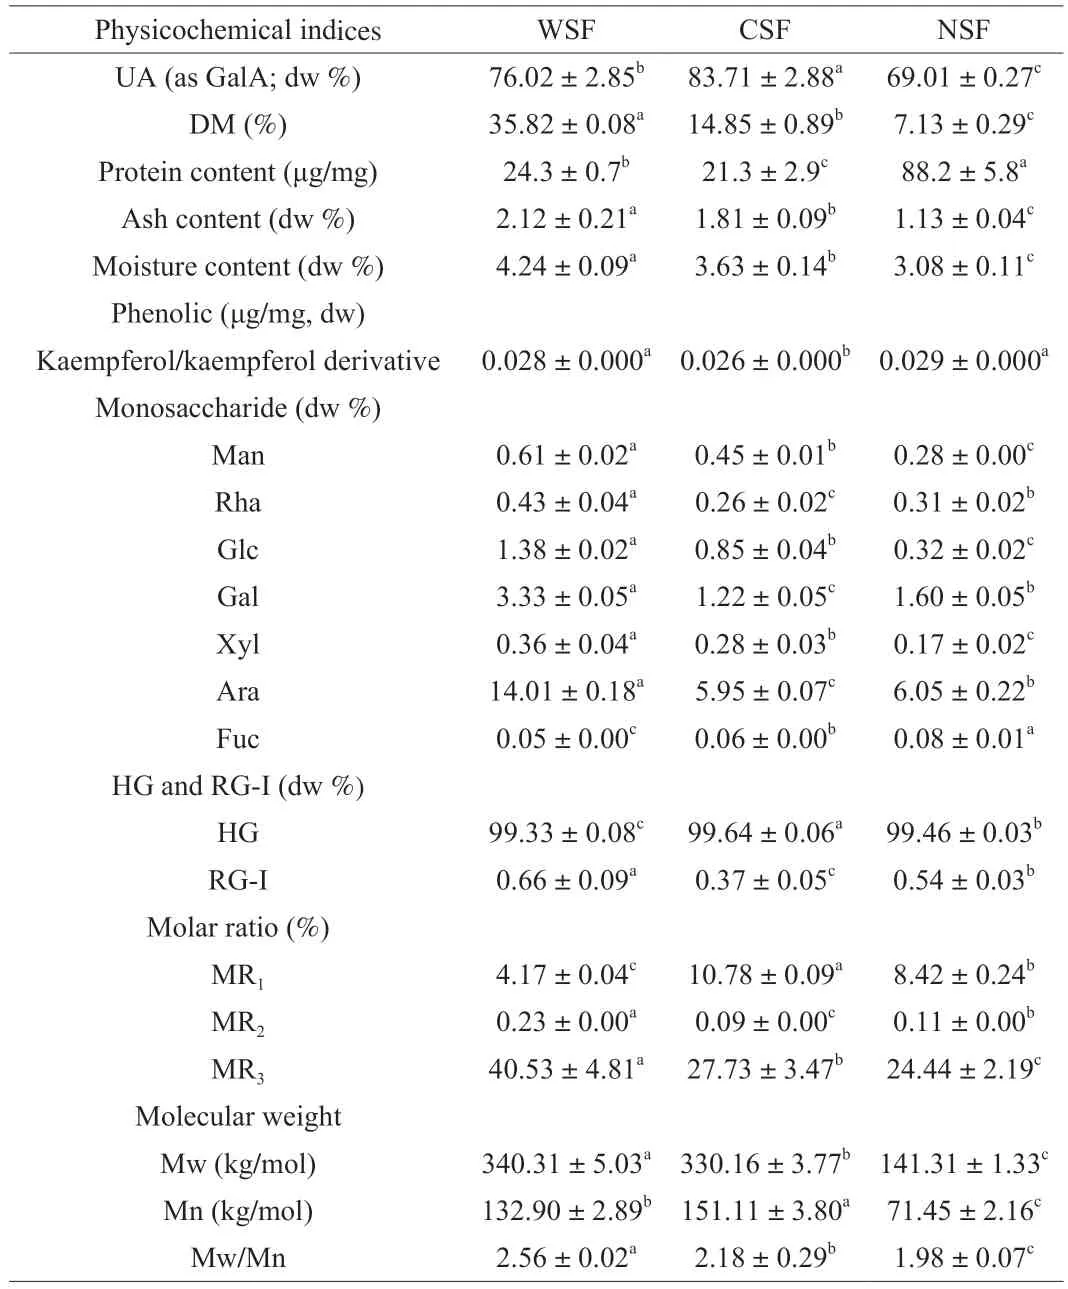
Table 1 Compositional characteristics of WSF,CSF and NSF.
WSF,CSF and NSF all contained seven monosaccharides (Man,Rha,Glc,Gal,Xyl,Ara and Fuc),in which Ara and Gal were the dominant neutral sugars.Small amounts of Rib (0.05%,0.04% and 0.17% dw for WSF,CSF and NSF,respectively) was retained in the three pectin fractions.NSF had a significantly lower Glc content than WSF and CSF.WSF had the highest Rha and RG-I,which was in agreement with the extraction conditions for WSF.The data of monosaccharide analysis can be used to infer the structures of pectins such as the different molar ratios,MR1(the molar ratio of UA to the neutral monosaccharides for predicting the linearity of pectins),MR2(the proportion of RG-I chains),and MR3(the length of branches attached to RG-I segments) [5,16,29,30].The MR1value decreased in the order of CSF (10.8) >NSF (8.4) >WSF (4.2),indicating that the linearity of pectins decreased in this order,as observed by SEM.A previous study on the pectins extracted sequentially from blueberries also showed the MR1value of CSF (11.1) was much higher than those of WSF (1.8) and NSF (1.5) [30].According to the contents of UA and Rha,the approximate percentages of HGs (linear pectins) and RG-Is (branched pectins with side chains such as galactans,arabinans and arabinogalactans) can be calculated [10].High MR2and MR3values indicated higher RG-I and greater branching (which are closely associated with emulsifying and emulsion-stabilizing properties) [10,16].In this study,WSF had much higher MR2(0.23) and MR3(40.53),compared with CSF (MR20.09;MR327.73) and NSF (MR20.11;MR324.44).Therefore,WSF had a higher degree of branching.
Molecular mass distribution is a crucial variable associated with the functional properties such as emulsifying and foaming properties.The Mw values of NSF,WSF and CSF were 141.31,340.31 and 330.16 kg/mol,respectively (Table 1),which were comparable to those previously reported for sugar beet pectin and commercial citrus pectin [26].Pectins obtained from soft fruits like gold kiwifruit under mild conditions (using water at 25 °C or citric acid solution at pH 2.2 and 50 °C) were reported to average molecular weights of 1.03 × 10⁶–1.66 × 10⁶g/mol for early-harvested fruits and 2.20 × 10⁶–3.75 × 10⁶g/mol for the main-harvested fruits [31].The higher Mw values of WSF and CSF indicate lesser damage on the structure of pectins in WSF and CSF,probably due to the uses of less destructive/invasive extraction media/compounds (water and chelating buffer) for extracting WSF and CSF fromC.humilisfruits,compared to the use of sodium carbonate and sodium borohydride buffer to extract pectins covalently linked to the cherry cell walls (NSF).
Furthermore,the value of Mw/Mn as the polydispersity index (PDI) can be used to evaluate the distribution of molecular weight,with a smaller PDI indicating a narrower molecular weight distribution [32].In this study,the PDI values of WSF (2.56),CSF(2.18) and NSF (1.98) were slightly higher than those previously reported for the pectins extracted sequentially from blueberries (1.7,1.9 and 1.6,respectively) [33].
3.3 FTIR and XRD analysis
As shown in Fig.3A,all the three pectin fractions had a broad and intense signal peak around 3 400 cm−1(3 420 cm−1for WSF,3 416 cm−1for NSF,3 397 cm−1for CSF;assigned to O–H stretching vibration of hydroxyl group),and a weak absorption around 3 210–2 920 cm−1(2 924 cm−1for WSF,2 931 cm−1for NSF,3 208 cm−1for CSF;assigned to C–H stretching vibration) [34].WSF had two intense peaks at 1 743 and 1 617 cm−1and a weak peak around 1 415 cm−1,NSF had an intense peak at 1 611 cm−1and a weak peak at 1 412 cm−1,and CSF had an intense peak at 1 627 cm−1and a weak peak at 1 396 cm−1.These results indicate the presence of C=O group of uronic acid in the three pectin fractions: WSF had both protonated carboxylic acid–COOH group and deprotonated–COO−group,whilst both NSF and CSF contained deprotonated–COO−groups only,with the total amount of C=O groups in the decreasing order of WSF >CSF >NSF based on the peak areas of 1 743 cm−1and 1 610−1 630 cm−1[34,35].This trend agrees with the UA content analyses (Table 1).WSF and NSF had two overlapping peaks around 1 100 and 1 020 cm−1,with the areas of these peaks for WSF being three times as high as those of NSF,suggesting that there was a higher content of C−O stretching vibrations (derived most probably from pyranose ring) in WSF [36,37].Moreover,FTIR analysis revealed the DM values of WSF,CSF and NSF to be 35.82%,14.85% and 7.13%,respectively.The DM values of the three pectin fractions were below 50%,indicating that the three pectin fractions were LM pectins.The presence of relevant endogenous enzymes in the cherry fruits and the use of chemical reagents in the pectin extraction process could induce demethylation reactions [26].
A narrower or sharper diffraction peak indicates a higher degree of crystallinity of pectin [38].As shown in Fig.3B,WSF,CSF and NSF all had a broad and intense peak around 23° 2θ(21°−25° 2θ),and a weak peak around 28° 2θ(26°−30° 2θ),indicating the amorphous or partially nanocrystalline nature of these three pectin fractions.The extremely sharp peak around 46° 2θwas found in the XRD pattern of WSF.In a previous study [39],such an intense peak was found to appear after the modification of pectin via amidation.The observation of the peak around 46° 2θfor WSF indicates the possible occurrence of some amidated pectin-associated crystalline regions (which might be disrupted by further extraction steps for CSF and NSF using other agents like ammonium oxalate and EDTA).The interactions among molecules and between polymer chains via functional groups such as protonated carboxylic acid groups influence the degree of crystallinity or the extent of disorder in the structure of the pectin samples [40].Similar results were previously found with the pectin in fig skin [38]as well as kiwi fruit and pomegranate [41].
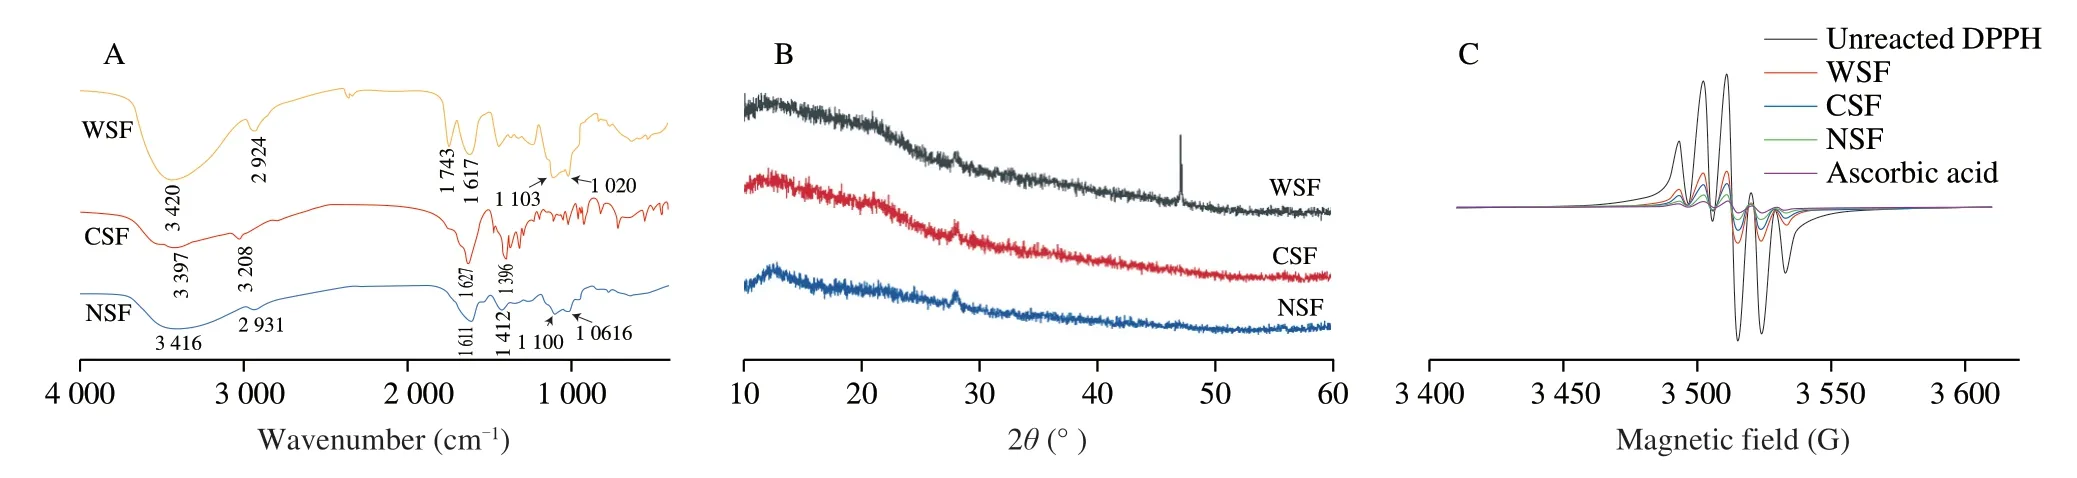
Fig.3 FTIR spectra (A),XRD patterns (B) and EPR spectra (C) of pectin samples.
3.4 1H NMR analyses
The1H NMR spectra (Fig.4A,B and C) of the three pectin samples shared similarities but also had some differences.The signal atδH4.65 in the spectra of the three pectin samples was due to the D2O solvent.Bothα-glycosidic form (as indicated by equatorial H resonances atδH4.9–5.6:δH>4.9) andβ-anomer (as indicated by an axial H resonance atδH4.3–4.9:δH<4.9) exist in the three pectin fractions [42,43].The signals (δHin order of decreasing intensity 3.78 >4.07 >3.88=3.65 >3.99 >5.00 >4.15 >5.09 >4.25 >2.00 >2.7 >1.19 for WSF,3.85=3.65 >3.75 >4.07 >3.96 >5.00 >5.10 >4.25 >2.00 >1.19 for CSF,and 3.76 >3.72 >4.08 >3.97 >4.99 >2.5 >3.82 >5.10 >3.05 >4.40 >4.15 >4.25 >2.00 >1.19 for NSF.According to previous studies [20,44-46],the following signal assignments further confirmed the presence and relative amounts of neutral monosaccharides and acetyl substitution:δH5.10,Man/Gal (H1);δH3.96/3.97/3.99,Glc (H3);δH4.07/4.08,Glc (H5);δH4.40,GalA/H1 Xyl (H5);δH4.15,Ara/Gal (H3) or Man (H4);δH4.25,Ara (H4);δH2.00,acetyl groups;δH2.70,CH2methylene group (Hb);δH1.19,Rha (H6).Moreover,δH3.88 and 3.65 are assigned to the H2 and H3 protons of the GalA residues that have been esterified (to formO-methyl esters),withδH5.00 and 5.09 derived from the H1 protons of non-esterified GalA residues [41].Both methyl-and acetyl-esterification occurred to WSF,CSF and NSF,and these three pectin fractions were low methoxyl pectins.
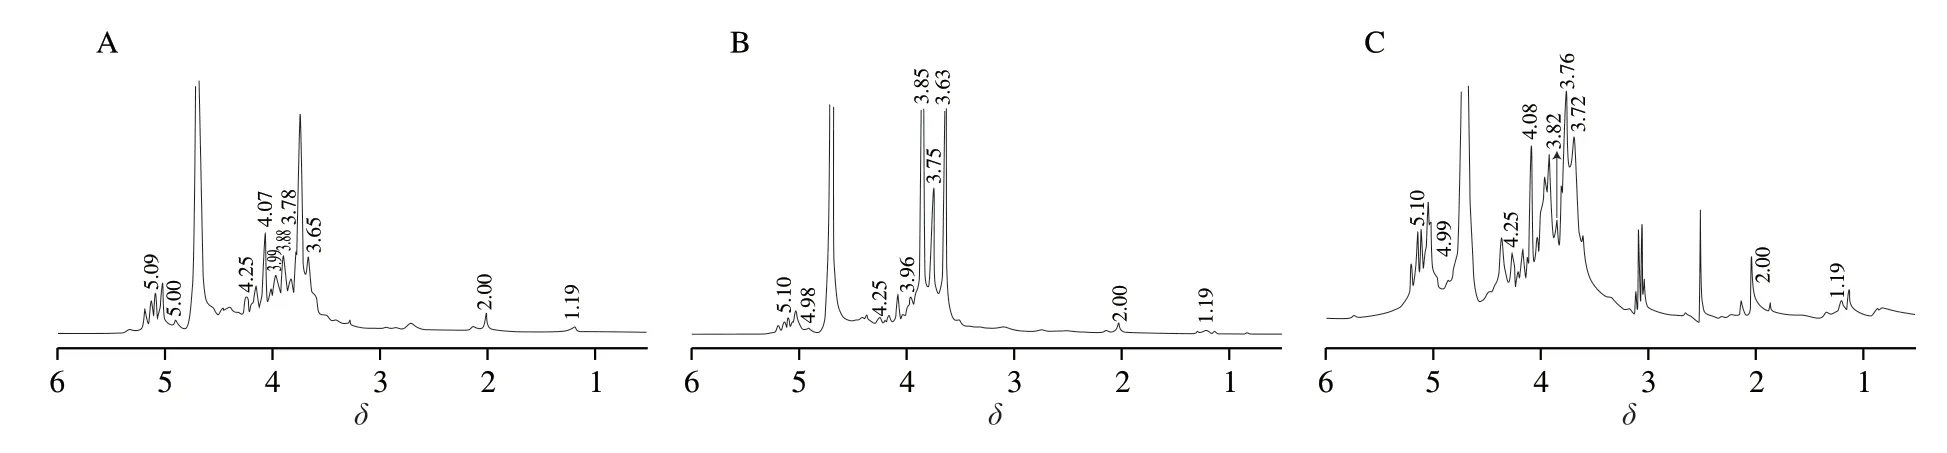
Fig.4 The 1H NMR (A,B,C for WSF,CSF,NSF,respectively) spectra of the pectin samples.
3.5 Processing-related functional properties
3.5.1 Thermal properties
The TG/DTG curves (Fig.5A) of WSF,CSF and NSF had similar changing patterns (a three-stage process of pyrolysis and co-pyrolysis),although obvious differences were found among the curves of the three pectin fractions (with the TG/DTG curves of WSF especially differing from those of the other two samples).During the first stage (50–200 °C),the weight of the pectin samples decreased slightly,due mainly to the evaporation of volatiles and retained moisture.During the second stage (200–400 °C),a rapid decline in the weight of the pectin samples was detected,due to the decarboxylation and thermal decomposition of pectins [19].During the third stage (400–600 °C),the mass loss occurred at a lower rate,probably owning to the formation of char and further thermal decomposition of char [47].The residual mass percentages of WSF,CSF and NSF subjected to the three-stage thermal process were 26.36%,33.93% and 34.91%,respectively.The thermal stability of the three pectin samples decreased in order of NSF >CSF >WSF,which was in agreement with the order of their PDI (Mw/Mn) values.The differences in the ease of releasing volatiles and moisture as well as the resistance to heat-induced changes and damage for the three pectin samples were closely associated with the chemical structure and composition as well as the internal organization of WSF,CSF and NSF [48].
3.5.2 Rheological behaviors
The viscosity (Fig.5B) of the pectin samples (1%,in water) all decreased rapidly in the low shear rate region and then declined very slowly at higher shear rates (indicating the nature of a non-Newtonian fluid): from 234.18 to 8.74 mPa·s for WSF (viscosity change:225.44 mPa·s),from 360.65 to 29.17 mPa·s for NSF (viscosity change: 331.48 mPa·s),and from 406.77 to 2.87 mPa·s for CSF(viscosity change: 403.90 mPa·s),respectively.The viscosity values of all of the pectin samples were much higher than that of the sugar beet pectin at 5% (m/m) (39.3 mPa·s),which was probably associated with the branching degree of the pectin samples in the current study [26].For comparison,a commercial citric pectin with 16.25% of methoxyl groups,57.86% of GalA and 87.93% of degree of esterification was reported to have a viscosity of 528 mPa·s in water at a mass concentration of 1% [49].
Differences were detected in the flow behaviors of the aqueous solutions (1%) of the pectin fractions (Fig.5C),as well as derived Power-law model parameters (Table 2).The shear stress (Pa) in the analyzed shear rate range (Fig.5C) followed the order of NSF >WSF >CSF,which was opposite to that of the flow behavior index(nvalue) of the Power-law model (Table 2).All of the pectin samples exhibited typical features of pseudoplastic fluids,and the fact that theirnvalues all lower than 1 further confirmed pseudoplastic behaviors [50].The relatively highR2values (0.993 6 for WSF,0.999 6 for CSF,and 0.935 5 for NSF) applauded that all plots,especially those of CSF and WSF,were fitted well to the Power-law model.The order of theR2values was opposite to the order of protein content(2.4% for WSF,2.1% for CSF and 8.8% for NSF),and the order of the sum of ash and protein contents (2.36% for WSF,2.02% for CSF and 3.96% for NSF),indicating that non-pectin substances like proteins and ash interfered with the flow behaviors of WSF,CSF and NSF.The viscosity and flow behaviors of a fluid are governed by the nature and concentration of the material as well as environmental conditions (like type of solvent/medium,temperature and pressure),and these variables determine the interactions among the solute molecules,solute and solvent molecules,inter-molecular spacings,hydration and mobility of the molecules [51,52].
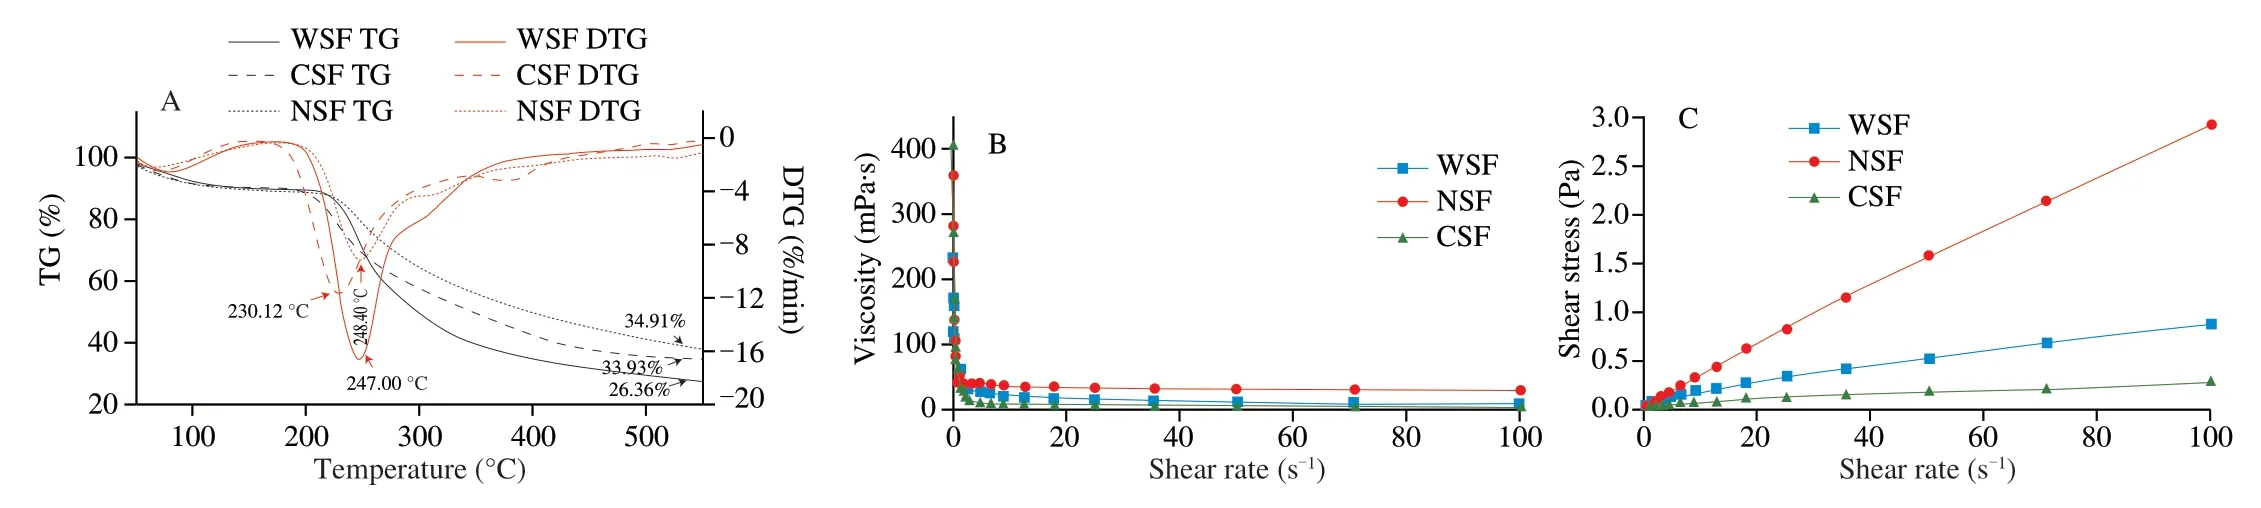
Fig.5 TG/DTG curves (A),viscosity (B) and flow behavior (C) of WSF,CSF and NSF.
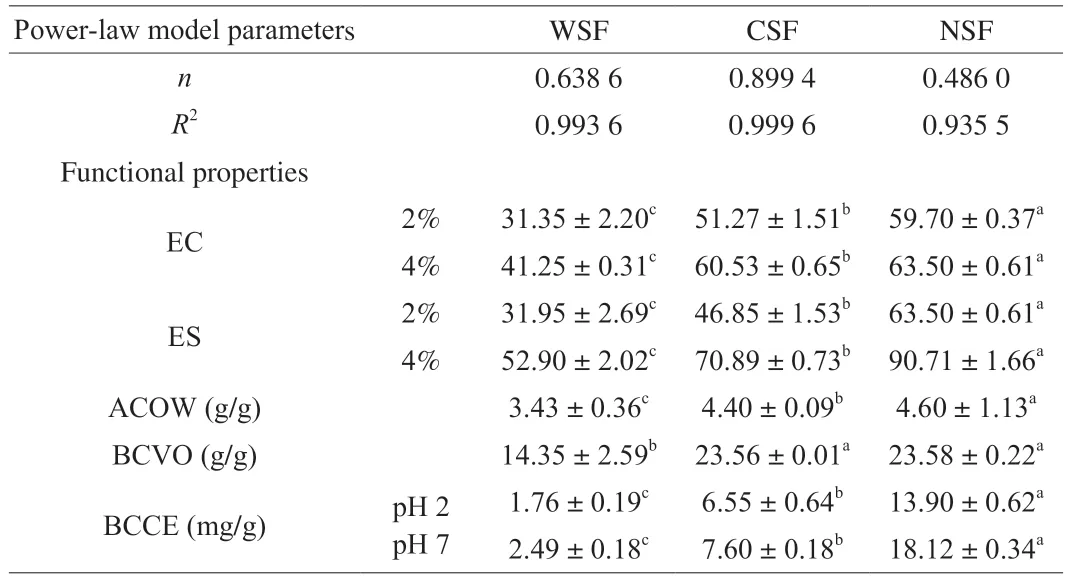
Table 2 The Power-law model parameters and functional properties of WSF,CSF and NSF.
3.5.3 Emulsifying properties
EC of the three pectin samples at 2% or 4% followed the same order of NSF >CSF >WSF,and for the same pectin sample,the EC values were higher at 4% than at 2% .At a pectin concentration of 2%,WSF had a slightly lower EC,and CSF and NSF had higher EC,compared to those of the pectin extracted fromOpuntia ficus-indica(OFI) cladodes [53]and sugar beet [54].The protein concentration of NSF was four times as high as those of WSF and CSF,thereby,the proteins through the links between hydrophobic protein moieties and pectin polymers in NSF probably contributed to the highest EC of NSF [55].
The ES values of the pectin samples followed the same decreasing order of EC: NSF >CSF >WSF (Table 2).The ES of NSF at 4% was as high as 90.71%,which was very close to the ES (90.45%) of the pectin extracted fromOpuntia ficus-indicacladodes by Bayar et al.[53].The ES of NSF at 2% was similar to that (64.28%) of the commercial citrus pectin [6].The ES of the emulsion involving WSF/CSF/NSF depended on the effectiveness of the pectin in forming a layer on the surface of oil droplets to prevent agglomeration [56].Factors such as protein content,Mw,DM and amount of GalA,and carbohydrate chain length as well as the environmental conditions,all determine ES [57].In this study,the high protein content of NSF might help stabilize the emulsion made with corn oil through interacting with the negatively charged GalA to form additional layers on the oil droplet surface [58].According to the above results,the three pectin samples can be used to create emulsify effects and stabilize emulsions,with NSF being the most effective emulsifier and emulsion stabilizer.
3.5.4 ACOW
ACOW indicates the quantity of water bounded per gram of sample.In this study,ACOW decreased in order of NSF >CSF >WSF.All ACOW values of the pectin samples in this study were lower than that (5.64 g/g) of cactus pectin produced by the chemical process [53].Previous studies reported that ACOW was affected by the chemical structure of pectin sample and other factors such as type of pectin,porosity,particle size,calcium content,ionic strength,pH and temperature [53].As described in earlier sections,the pectin samples in this study differed in the composition,particle surface area,and microstructural organization (i.e.DM and branching degree of hydrophilic pectin,amount of protein,and absence/presence of filament-like network,pores and amorphous structures).
3.5.5 BCVO
The BCVO value indicates the quantity of oil adsorbed by the pectin sample,and can be used to evaluate the abilities to prevent oil loss during food processing and reduce oil absorption during digestion and bioabsorption in organisms.In this study,NSF and CSF had essentially the same BCVO,which was much higher than that of WSF (Table 2).These results were closely associated with the high EC values of NSF and CSF,which resulted from the highest protein content and high particle surface area of NSF,and the interconnected filamentlike network with pores of CSF.The BCVO values of WSF/NSF/CSF were similar to those of the grapefruit peel soluble dietary fibers extractedviathe microwave-sodium hydroxide treatment,microwaveenzymatic treatment and microwave-ultrasonic treatment [22],but much higher than that ((1.23 ± 0.42) g/g) of the pectin of OFI extracted enzymatically and that ((0.93 ± 0.17) g/g) of the commercial citrus pectin [6].The BCVO could be influenced by various factors such as degree of hydrophilicity and overall charge density of the constituents [59].
3.5.6 BCCE
BCCE indicates the quantity of cholesterol in foods like egg yolk bounded by the pectin sample,which is a useful indicator to help gauge the interactions between food-derived cholesterol and pectinrich dietary fiber product,given the important roles of cholesterol in human health [60].At pH 2 (simulating the pH of the stomach) and pH 7 (simulating the pH of the intestine),BCCE followed the same decreasing order of NSF >CSF >WSF.The BCCE values at pH 7 were higher than the corresponding BCCE values at pH 2,which was similar to the results of Jia et al.[61].The BCCE of pectin is determined by its molecular weight,gelling ability,viscosity and molecular weight [62].NSF had the highest protein content (Table 1),viscosity (Fig.5),and EC value (Table 2),thereby exhibiting the highest BCCE.CSF had an interconnected filament-like network with pores of different sizes,an intermediate EC,and the lowest protein and viscosity,thereby exhibiting moderate BCCE.Therefore,NSF and CSF may be used in the diet for reducing absorption of cholesterol and fats,althoughin vivostudies are required to verify this concept.
3.6 Antioxidant activity evaluated by EPR
As shown in Fig.2C,the antioxidant capacity (as the ability to quench DPPH free radicals) of the three pectin fractions and AA standard (all at 25 mg/mL) was in order of AA >NSF >CSF >WSF.Accordingly,NSF could be a potent antioxidant,because its DPPHquenching ability was close to that of AA at the same concentration.The detected antioxidant activity of NSF,CSF or WSF possibly resulted from the antioxidative substances in these pectin samples including their pectic polysaccharides [2,3],proteins/peptides [63],or phenolic compounds retained [15]fromC.humilis.In this study,the three pectin fractions contained similar amounts of kaempferol and/or its derivative(s) (Table 1).Further investigations are required on the actual contributions of all the antioxidative constituents (pectins,protein/peptide and phenolic compounds) in NSF,CSF and WSF to the antioxidant capacities of these pectin products.
4.Conclusions
Three pectin fractions (WSF,CSF and NSF) were extracted fromC.humilisfruits.The compositional,morphological and structural characteristics,processing-related functional properties andin vitroantioxidant activity of each pectin fraction were evaluated.The three pectin fractions were all branched low methoxyl pectins with both methyl-and acetyl-esterification and an amorphous or partially nanocrystalline nature,containing significant amounts of uronic acid,neutral monosaccharides (Man,Rha,Glu,Gal,Xyl,Ara and Fuc),and kaempferol and/or its derivative.CSF had a slightly smaller molecular weight than WSF,whilst NSF had less than a half of the molecular weights of CSF and WSF.These three pectin fractions exhibited desirable rheological,thermal,emulsifying,emulsion-stabilizing,water-adsorbing,oil-binding,cholesterol-binding and antioxidant properties.NSF and CSF exhibited the highest and second highest emulsifying,emulsion-stabilizing,water-/oil-/cholesterol-binding and antioxidant capacities.In particular,NSF had a significantly higher protein content,viscosity,flowability,and resistance to heat-induced changes and damage,compared with CSF and WSF.Therefore,the three pectin fractions produced fromC.humilisin this study exhibited some differences in their functional properties,potentially allowing each to be exploited as a food additive,food ingredient or dietary supplement.
Declarations of interest
None.
- 食品科学与人类健康(英文)的其它文章
- Colloidal nanoparticles prepared from zein and casein:interactions,characterizations and emerging food applications
- Biological factors controlling starch digestibility in human digestive system
- Preparation methods,biological activities,and potential applications of marine algae oligosaccharides: a review
- Development of hyaluronic acid-based edible film for alleviating dry mouth
- Mushroom β-glucan and polyphenol formulations as natural immunity boosters and balancers: nature of the application
- Preparation of multicore millimeter-sized spherical alginate capsules to specifically and sustainedly release fish oil