
Three-Stages Hyperspectral Image Compression Sensing with Band Selection
2023-01-22 09:00JingboZhangYanjunZhangXingjuanCaiandLipingXie
Jingbo Zhang,Yanjun Zhang,Xingjuan Caiand Liping Xie
Taiyuan University of Science and Technology,Taiyuan,030024,China
ABSTRACT Compressed sensing (CS), as an efficient data transmission method, has achieved great success in the field of data transmission such as image, video and text.It can robustly recover signals from fewer Measurements,effectively alleviating the bandwidth pressure during data transmission.However,CS has many shortcomings in the transmission of hyperspectral image (HSI) data.This work aims to consider the application of CS in the transmission of hyperspectral image (HSI) data, and provides a feasible research scheme for CS of HSI data.HSI has rich spectral information and spatial information in bands,which can reflect the physical properties of the target.Most of the hyperspectral image compressed sensing (HSICS) algorithms cannot effectively use the inter-band information of HSI,resulting in poor reconstruction effects.In this paper,A three-stage hyperspectral image compression sensing algorithm (Three-stages HSICS) is proposed to obtain intra-band and inter-band characteristics of HSI,which can improve the reconstruction accuracy of HSI.Here,we establish a multi-objective band selection(Mop-BS)model,a multi-hypothesis prediction(MHP)model and a residual sparse(ReWSR)model for HSI,and use a staged reconstruction method to restore the compressed HSI.The simulation results show that the three-stage HSICS successfully improves the reconstruction accuracy of HSICS,and it performs best among all comparison algorithms.
KEYWORDS Combinatorial optimization;band selection;hyperspectral image;compressed sensing
1 Introduction
The emergence of hyperspectral image (HSI) is a key progress in the remote sensing field.It is usually captured by spectral imagers and spectral sensors mounted on various platforms, which have rich spectral and spatial information.The spectral information of HSI means it has a huge number of continuous spectral bands from dozens to hundreds that represent a different spectrum,which simultaneously image the same target area.The spatial information means it has a lot of pixels in one band, especially in the characterization of large area ground.HSI is a key part in the classification of ground features, water quality inversion and other fields because of plentiful information.However, it also leads to a lot of redundant information, including redundant bands and pixels,which greatly reduces the efficiency of HSI data acquisition and processing.Hyperspectral image compression sensing has received extensive attention to solving this problem.Compressed sensing theory is different from Shannon’s theory,which can recover robust solutions of signals from lower sampling rates (SR) than the Nyquist theorem.The sparse signal processing in hyperspectral image compressed sensing(HSICS)can reduce the cost of HSI’s expensive acquisition and processing,and ease the data transmission bandwidth.Abedi et al.[1] designed a Gaussian difference kernel group containing multiple scales to be used in single-pixel compressed sensing sampling.A set of linearly independent vectors were produced as the rows of the measurement matrix through this encoding method, improving the sampling efficient.Zhou et al.[2] proposed a multi-channel deep network model based on the similarity between image blocks for block compressed sensing (BCS).This model can recover the blocks with a variety of SR,showing excellent performance.Pham et al.[3] proposed a deep enhancement network based on compressed sensing multi-signal recovery.The deep enhancement network was built to exploit the important information that was recovered by different CS reconstruction algorithms, which improved the PSNR of reconstruction signal.A twostage CS algorithm was proposed for video reconstruction[4].The initial images of each frame were recovered through video spatial correlation in the first phase,and the second stage recovered the final image through inter-frame prediction and weighted residual sparse model.The image quality can be continuously improved until the algorithm converges through iterative updating of weights.
Various data forms have different requirements for the CS reconstruction algorithm.In HSICS,using inter-band and intra-band information can improve the reconstruction effect of CS.Wang et al.[5] converted the HSI to the product of the abundance matrix and the endmember matrix, and used two compression methods to estimate it when the number of endmembers is unknown,so as to recover the hyperspectral image.Zhang et al.[6] proposed the N-way block OMP algorithm under the tensor framework which uses Gaussian function to approximate the tensor-l0 norm, improving the reconstruction accuracy.A CS reconstruction method based on context awareness was proposed in[7],which used online dictionary learning and joint sparse constraints to represent spectral pixels.The sparse reconstruction model was established by weighted smoothing regularization to preserve the spectral structure and spatial structure of the HSI[8,9].Zhang et al.[10]proposed a minimization model, which combined kernel norm and total variation (TV) norm, based on distance metric.It jointly considered the spatial and spectral characteristics of HSI, which used spatial smoothness,spatial sparseness,and inter-spectra similarity to improve HSI reconstruction accuracy.A prior image constrained compressive sensing(PICCS)-based HSI was also proposed in[10].The HSI of each band is restored based on the image of the previous band,using the sparsity in each band and the similarity between adjacent bands.However,adjacent bands are not necessarily the most similar in HSI,so this method has limitations.In [11], a new compressed HSI method is proposed.This method learns an over-complete dictionary to sample HSI sparserly,and designs a more powerful sparse reconstruction method based on the over-complete dictionary.Yuan et al.[12]proposed a blind compressive sensing algorithm.This method mapped the 3D image to the 2D image and learned coupling dictionaries by using the 2D image and 3D image information to improve the quality of HSI reconstruction.Zhang et al.[13]proposed a cluster sparsity field based HSI reconstruction framework to model the correlation between specific pixels, obtaining a good reconstruction effect.Xue et al.[14] proposed a nonlocal tensor sparse and low-rank regularization(NTSRLR)approach to research nonlocal spatial spectral correlation hidden in HSI.
The above research shows that multi-band joint reconstruction can effectively improve the reconstruction effect of HSI, which considers the spectral information between various bands in HSICS.However, there are a lot of redundant bands in HSI.In multi-band joint reconstruction,the redundant band has a great influence on the effect of compressed reconstruction.Therefore,it is necessary to select the optimal band subsets for multi-band joint reconstruction in the CS reconstruction process.The band selection process can be analogous to a feature selection process.The optimal subset is affected by two most important issues, such as the evaluation criteria and search algorithm [15].Xie et al.[16] proposed an artificial bee colony optimization algorithm for band selection, using correlation coefficients and spectral curves to divide HSI into subspaces [17].Kalidindi et al.[18]used entropy measurement and Gaussian filter to extract noise-free bands,then a multi-agent particle swarm optimization algorithm was proposed to search for the optimal band subset.Tschannerl et al.[19]proposed a search algorithm based on gravity and uses shannon entropy and mutual information to evaluate HSI bands.In[20],the authors used three optimization algorithms to select the band, and analyzes the performance of the three algorithms on the problem of band selection.A band selection algorithm with information theory can remove redundant bands while selecting information-rich bands through evolutionary algorithms[21].Sawant et al.[22,23]proposed a modified wind-driven optimization algorithm and cuckoo search algorithm to find the best band,avoiding premature convergence.Similarly,Yu et al.[24]proposed a quantum evolutionary algorithm for band selection.In addition to considering the search algorithm for band selection, the band evaluation criteria are equally important.It is noted that the criterion of bands should be considered with the situation in different applications like many-objective model[25].
The HSI band selection can be constructed as a multi-objective optimization problem, and a stochastic optimization algorithm can be used to solve it to obtain the best band subset.In recent years,research on multi-objective optimization algorithms has made great breakthroughs [26–28].A new multi-objective unsupervised frequency band selection model was proposed in[29],which combined frequency band correlation and information volume and used a multi-strategy integrated multiobjective artificial bee colony algorithm to solve.A mop is an engineering problem in the real world[30].When a problem has multiple conflicting goals,it is constructed as a multi-objective optimization model [31].The solutions of this model can be obtained as a balanced solution.As multi-objective optimization problems are widely used in social engineering, scholars have proposed some classic Mop algorithms[32–34],including non-dominated sorting algorithms based on reference points[35]and grid-based evolutionary algorithms [36], multi-objective optimization algorithm [37] based on inflection point drive and evolutionary algorithm based on decomposition to balance diversity and convergence [38], etc.These algorithms usually alleviate the diversity and convergence problems in the process of model solving by improving the matching selection mechanism and the environment selection mechanism.The specific strategies can be designed according to the characteristics of different problems[39].
Aiming at the problem of low-precision reconstruction of HSICS, this paper proposes a threestage HIS-CS algorithm to reduce the redundancy of HSI.In the first phase,the Mop-BS to obtain the optimal band subsets.Then,a reweighted sparse residual(ReWSR)model and a multi-hypothesis prediction (MHP) model are established to iteratively obtain a reconstructed image.In the second phase,Intra-band reconstruction with the spatial information of the band subsets is used to obtain a preliminary restored image with the ReWSR model and MHP model.The third phase performs interband reconstruction with inter-spectral information of the band subsets with the ReWSR and MHP model.
2 Three-Stage Hyperspectral Image Compression Sensing Algorithm
In this section,we specifically introduce the three-stages HSICS.Inspired by the vi deo compression sensing reconstruction method in[4],we consider multi-band joint reconstruction,that is,using information in similar bands to recover the initial image.How to select a suitable subset of bands in the first stage for multi-band joint reconstruction is a crucial issue.In addition to the bands that cannot be effectively used,such as noise bands and water bands,bands with large reconstruction errors are also defined as redundant bands in compressed sensing.In the first phase, taking the Indian_pines dataset as an example,the band subset used for joint reconstruction in the third stage is selected from the remaining 200 bands after the water and noise bands are removed from the 224 bands through the Mop-BS model.The second and third phases are both based on the ReWSR model and the MHP model to perform BCS reconstruction algorithms.The difference is that the second phase searches for the most similar block in the current band for prediction and reconstruction.The first band and the last band in the band subset are selected as key bands.These SRs are higher than those of all other bands.Therefore,these two key bands can achieve better reconstruction results.This is used to avoid finding the adjacent band with better image quality for band reconstruction in the third phase.The third phase is to find the most similar block in the entire band subset for prediction and reconstruction.Firstly,the current band will search for another band with higher image quality in the band subset.Secondly, it will find similar blocks to provide prediction information for the reconstruction of the current block in these bands.It should be noted that the first band and the last band in the band subset do not need to be reconstructed in the third phase.The algorithm structure diagram is shown in Fig.1.

Figure 1:The algorithm structure diagram
2.1 Multi-Objective Band Selection(Mop-BS)Model
In this section,the HSI band selection is modeled as a multi-objective combination optimization problem as the first phase.In the multi-band joint reconstruction of HSICS,the similarity between the bands will greatly improve the effect of joint reconstruction.However,it is not appropriate to simply use the similarity of the bands to select the band subset of HSICS.It is also necessary to consider the amount of information in the bands.Only a band with a large amount of information can provide a better joint reconstruction effect in the second and third stages.Meanwhile, the number of band subsets is uncertain.We cannot directly judge the influence of the number of band subsets on the second and third stages.Based on the above factors,this article comprehensively considers the amount of information,band similarity and reconstruction error to establish the Mop-BS model.
The HSI compressive sensing algorithm proposed in this paper is expanded on the video block compressive sensing.In video compressed sensing, the images of each frame in a video have a time series relationship, so the images of adjacent frames have a strong correlation.After blocking the image between adjacent frames,better performance can be obtained by searching for similar blocks.However,in HSI compressed sensing,adjacent bands do not necessarily have a strong correlation.We analyze the factors that affect the band correlation to establish the Mop-BS model,and use the multiobjective optimization method to select the optimal bands.This aims to select a band combination with strong correlation,which is called the optimal band subset.Compressed sensing in subsets can greatly improve the reconstruction accuracy of HSI.The overall flow of the Mop-BS model is shown in Fig.2.
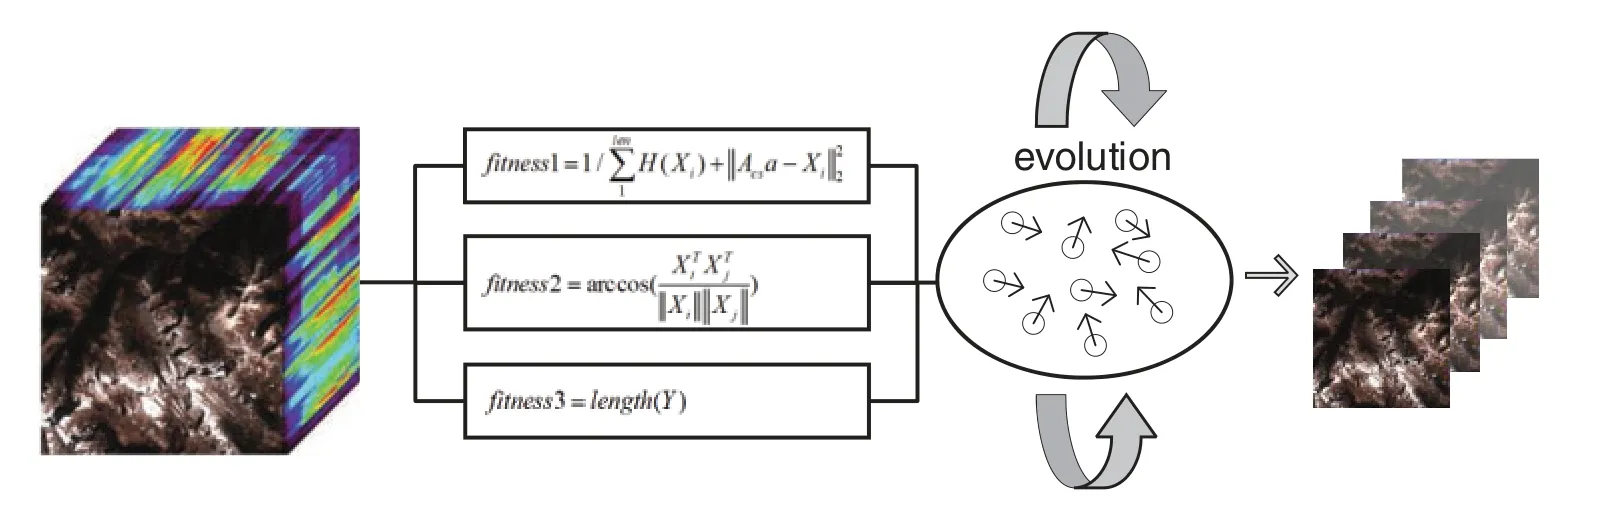
Figure 2:Band selection flowchart
HSI contains different amounts of information on different wavebands.This is due to the environments in which the spectral images are collected.the high-information band presents higher image quality,clearer structure,and higher accuracy in HSI processing.This article uses information entropy to measure the amount of band information.The formula is shown in(1):

in whichp(β)is the probability ofβ,H(B)is the information entropy of random variablesB.In the HSI,Bis the image in a band replaced as X,and theβis the pixel of an image.Therefore,

in whichh(β)is the gray value of the histogram ofX.mnis the number of pixels inX.The sum of whole band’s information entropy as shown in formula(3).

TheENrepresents the inverse of information entropy to measure the total information in the band.The len is the length of a band subset.The smaller the EN,the greater the information in the band subset.The purpose of the first stage is to select a band with good reconstruction effect as much as possible.In addition to considering the amount of information of the band subset,the reconstruction effect of a single band should also be attended.The reconstruction effect refers to the recovery error of a single band in compressed sensing.The smaller recovery error,the higher quality in the second stage,and the higher quality of the final reconstruct.This article defines the error as formula(4).

Among them,Acsarepresents the measured value of the reconstructed image,Xrepresents the original image,fitness2and reconstruction effect are inversely proportional.The ER is squared as‖Acsa-X‖2,it is converted to a positive number.A larger error has a greater impact on theER,while a smaller error will have a less impact on theER.In the iteration,the fitting effect can be increased,so that the iteration value can be closer to the true value.TheAcsain formula(3)is solved by orthogonal matching pursuit(OMP)algorithm[40].Combining formula(3)and formula(4),we proposefitness1,as shown in formula(5).

The correlation between bands is particularly important for three-stage HSICS.In the third step,the algorithm will search for similar blocks in the band subset.Here,we use the mean spectral angle(MSA)to measure the similarity between the bands.MSA measures the similarity between bands by calculating the angle of two vectors in HSI.The similarity of the band is inversely proportional to the angle.

in which theXiandXjare theith andjth band in the HSI.Through fitness1 and fitness2, we can initially establish a multi-objective band selection model,but the length of the band subset cannot be determined during the optimization process.So,a huge of repeated experiments are required to select the number of the best band subset.Therefore,the subset length is designed in fitness3 in this paper,which eliminates the need for repeated experiments,and can better describe the band subset.

where theY=[X1,X2, ...Xend]that represents the band subset.In theory,the solution set is obtained by solving the multi-objective optimization model,which includes many band subsets,and the length of each subset is different.In practical applications, we do not make a decision on the solution set, and perform joint band reconstruction on each solution in the solution set.Finally, the entire HSI compressed reconstructed image will be given.In the experiment, we randomly selected one of the solutions for the subsequent two-stage experimental simulation research.The Mop-BS model is written as formula(8).

To solve the above model,we have several inspire-algorithms to compare.A population(p×q)is randomly generated,whereqis the number of individuals in the population andpis the dimension of each individual.Fig.3 shows the coding form of the population in each individual.
The dimension of each individual is the total number of bands in HSI.A real number between[0,1]is randomly generated for each band in the initialization operation.If the value is greater than 0.5,it means that this band is selected.In encoding,the random numbers between[0,1]are uniformly distributed,and the selection probability is set to 0.5 to ensure that each band has the same probability of selection and non-selection.
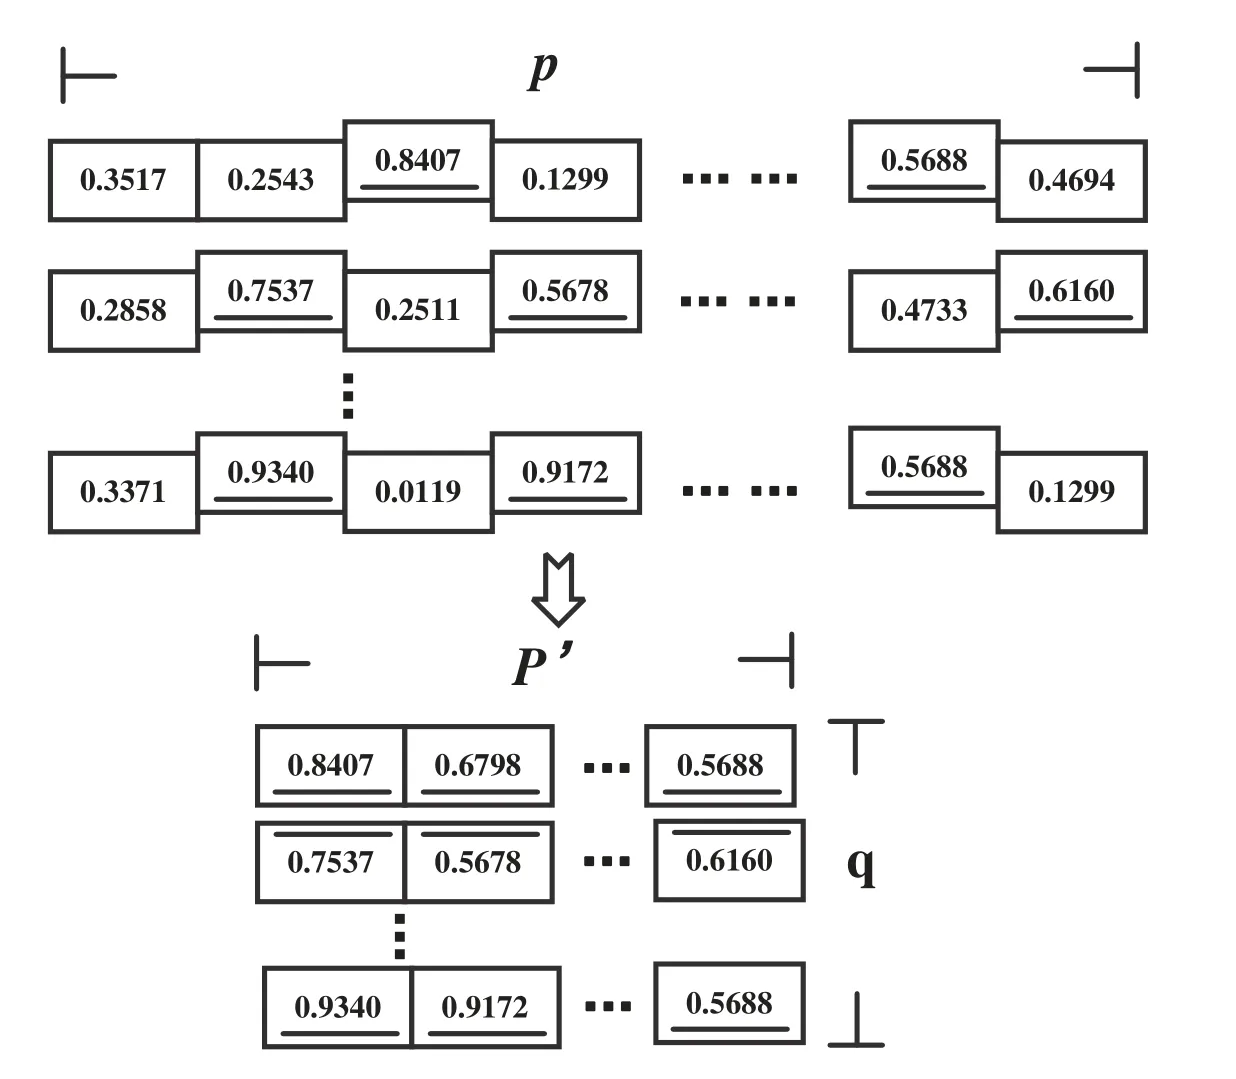
Figure 3:Population coding format
The offspring population is regarded as the solution space.The optimization process is the process of guiding the solution space convergence according to the model.When the maximum number of iterations is reached, the optimal band subset will be obtained.The process of solving the Mop-BS model is the first phase of the HSICS algorithm.
2.2 Reweighted Sparse Residual(ReWSR)Model and Multi-Hypothesis Prediction(MHP)Model
The MHP model and ReWSR model are introduced in detail in this part.These two models were originally proposed in [4] to video compressed sensing.We apply them to HSICS and make corresponding improvements.
The BCS has been proved to be effective in CS[41,42].In the three-stage HSICS,HSI is divided into blocks as[x1,x2,x3,...xj,...],thexjrepresents the current block to be restored.The blocking operation is a way with overlap defined asDk.

This overlapping block method can effectively eliminate image artifacts and suppress possible block effects.The band X is divided intoCpatches byDk.When gathering all the patch to recovery bands, the overlapping part is calculated by the average pixels to obtain the pixel value, obtaining better reconstruction results.The MHP model obtains the similarity ranking by calculating the mean square error(MSE)betweenxjand each patch,and then selectscpatches as the most similar patches ofxj.

where S2is the size of a patch.Thesecpatches are regarded as the multi-hypothesis prediction value of patchxj.The multi-hypothesis predicted valuevjwill be used to construct the reweighted sparse residual model in the next step.The residual of patchxjis defined as the difference between the pixel value ofxjand its weighted multi-hypothesis prediction value.

in whichγjis the weight of the predicted value of multiple hypotheses,and patches with high similarity should be given higher weights.To solve the weights,The[43]defines the weight as the reciprocal of the coefficient.

2.3 The Second Phase and the Third Phase
This section mainly introduces the second and third phase reconstructions in the Three-stage HSICS algorithm.In fact,the second and third stages are both based on the two models introduced in the previous section.The difference is that the second stage is intra-band reconstruction and the third stage is inter-band reconstruction.That is, the second phase searches for similar blocks in a single band,and the third stage searches for similar blocks from a subset of bands.
The bands in the first phase are initially reconstructed.The first and last two bands of the band subset are selected as the key bands,and the SR of the key band is set to 0.7.The selection of key bands is used to increase the information of the band subset after compressing.Through the first stage of the algorithm, there is a strong correlation between the selected optimal band subsets.However, in order to improve more reconstruction accuracy of HSI,we set two bands as key bands and perform a smaller compression ratio,which can retain more information of band subset.In fact,the key bands can be any two bands in the subset,which has little effect on the performance of the algorithm.
When reconstructing, the images of each band are reconstructed in sequence.In the case of multi-hypothesis prediction, similar blocks are found from within the band image.For the method of searching for similar blocks within the band,we refer to the intra-frame reconstruction method of video compressed sensing in[4].Due to the higher SR of the first and last bands,the recovered image quality is also higher than that of other bands.The initial reconstructed image generated in the second stage will be used as the initial value in the ReWSR model to iteratively generate the optimal weight,as shown in Fig.4.
In the third stage, the initial image reconstructed is reconstructed again.When the bandXiis restored,the image reconstruction quality ranking for every band is generated in the band subset.The purpose is to treat the bands with higher image quality than bandXias similar bands.Since HSI is different from video,there is no motion error between each block,so when we reconstruct blockxiby directly selecting the block corresponding to the similar band,as shown in Fig.5.

Figure 5:The third phase reconstruction
The calculation of the optimal weight in the third stage, uses the steepest descent method.The steepest gradient descent method is given in Table 1.After analysis, a larger weight will lead to a poorer recovery effect of non-zero coefficients,while a smaller weight can make the recovery of nonzero coefficients better in compressed sensing.Therefore,we use the number of non-zero coefficients recovered as the objective, and use the steepest descent method to solve the weights under different data sets.Finally,a ReWSR model is used for the selected blocks.
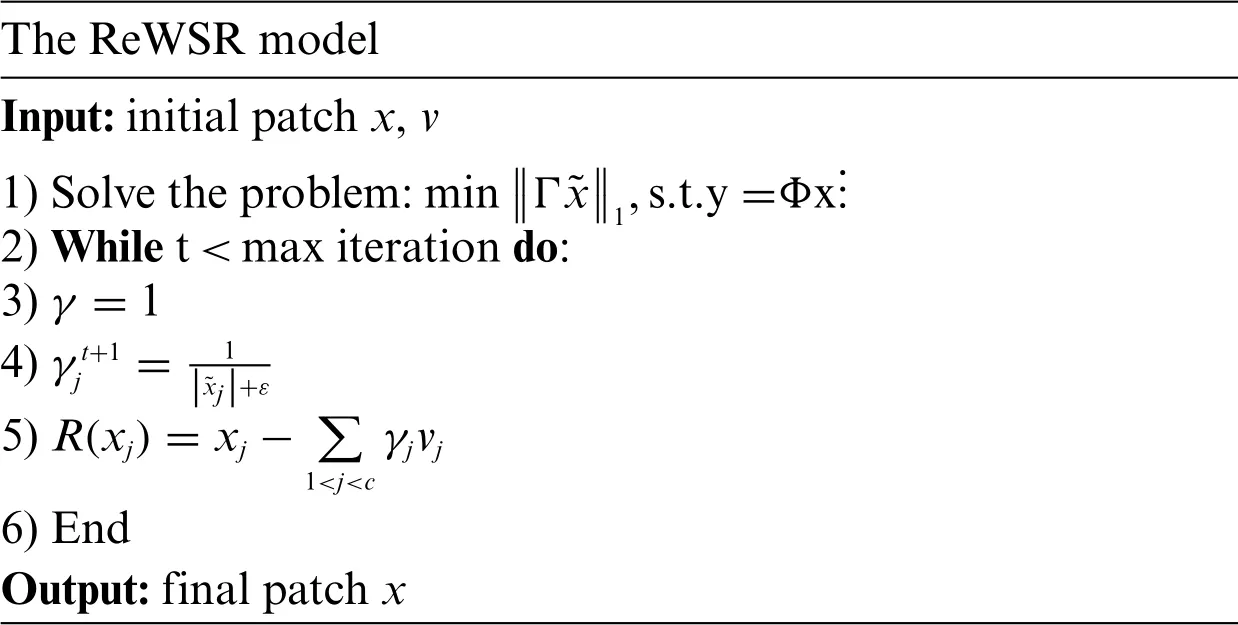
Table 1:The model process
3 Simulation Experiment
We will research and verify the advantages of the three-stage HSICS through three experiments.The comparative experiments were carried out on 3 public HSI datasets, Indian pines (IN), Salinas(SA) and Pavia University (PU).The simulation experiment environment is Intel(R) Core (TM) i7-10710U CPU@1.10 GHz,1.61 GHz,16.0 GB.
3.1 Parameter Settings
The IN dataset consists of 224 spectral reflection bands,and it has 145145 pixels in every band.The SA dataset consists of 224 spectral reflection bands, which cover 83×86 pixels in every band.The PU dataset has 115 spectral reflection bands and its size includes 610×340 pixels.The datasets is tailored to meet the experimental needs.Lis the length of the band subset.The parameter settings of the simulation experiment part are indicated in Table 2.
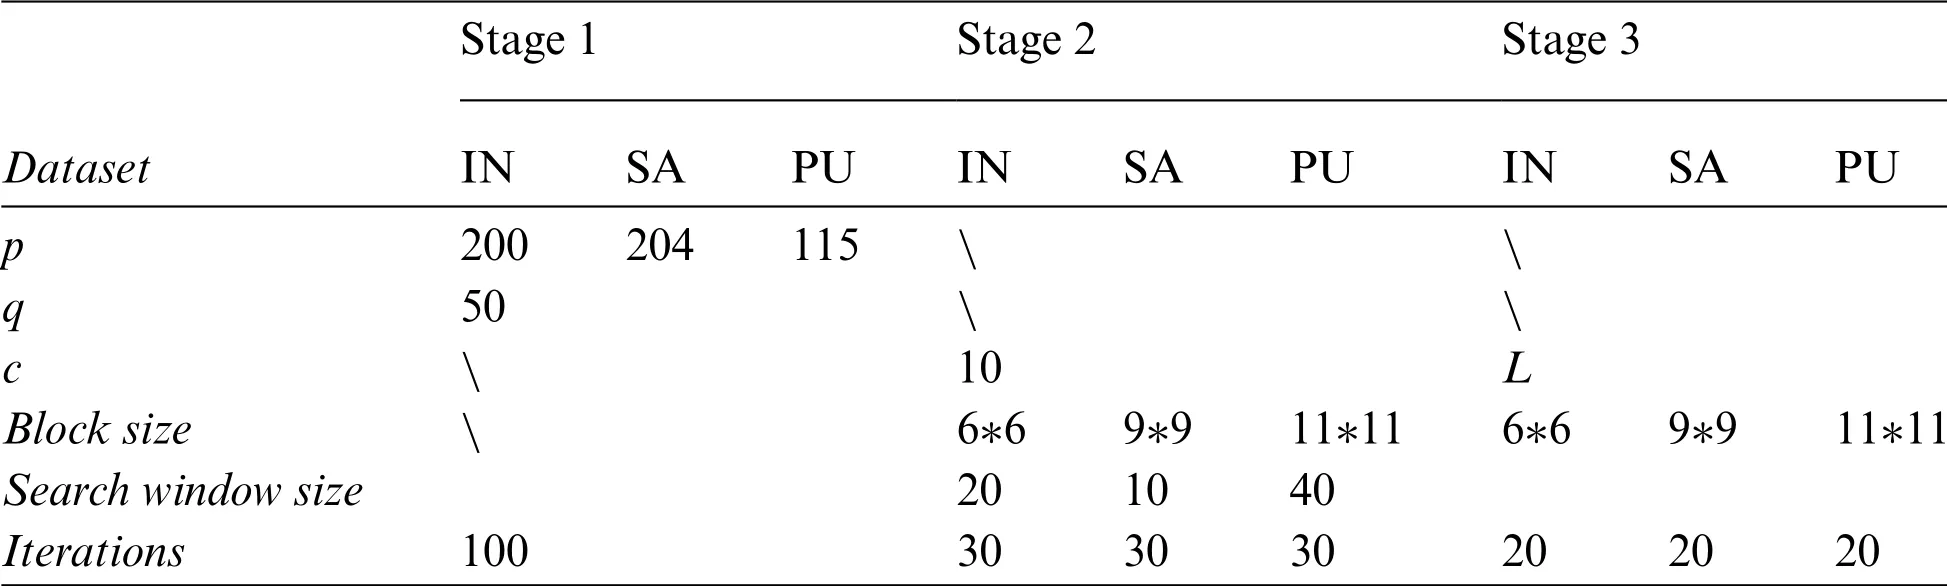
Table 2:Parameter settings
3.2 Comparative Experiment
This article sets up three comparison experiment.In the first stage, four advanced inspirealgorithms are used to solve on Mop-BS.In the second and third stages, this article takes IN and SA as examples,and conducts experiments in four cases of sampling 0.2,0.3,0.4,and 0.5.Finally,we compare with three HSI-CS algorithms to verify the performance of the algorithm proposed in this article.
3.2.1 The 1-Stage Experiment
We modeled the HSI band selection as a multi-objective combination optimization model, and conducted experiments using NSGA-III[45],GrEA[46],KnEA[47],and ISDE+[48]algorithms.The population size of the four algorithms is set to 50,the iteration number is 100,the individual crossover probability is 0.9,and the mutation probability is 0.1.The rate of knee points in the population is 0.5 on KnEA.
Table 3 shows the IGD and HV values of the four algorithms on Mop-BS.The result is an average of 30 runtimes.Through comparison with four algorithms,it is found that GrEA has better performance when solving Mop-BS.Therefore,this paper chooses GrEA to solve the model.In this experiment,50 solutions are finally obtained to form a solution set.The solutions set are the balance solution of three objectives.
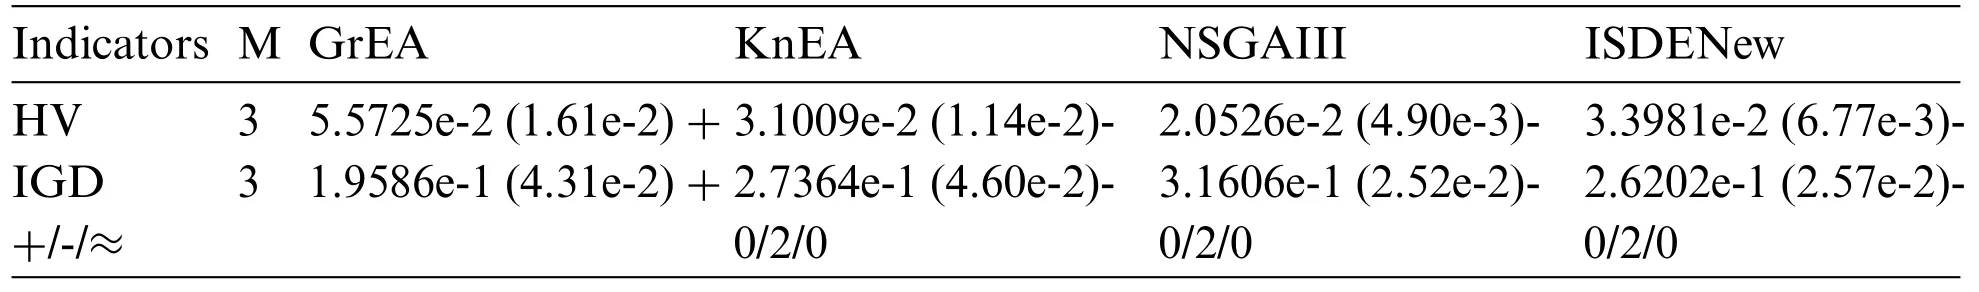
Table 3:The IGD and HV value of the Mop-BS model
From Figs.6–8, IN reached convergence around the 90th generation, SA reached convergence around the 45th generation,PU reached convergence around the 25th generation.
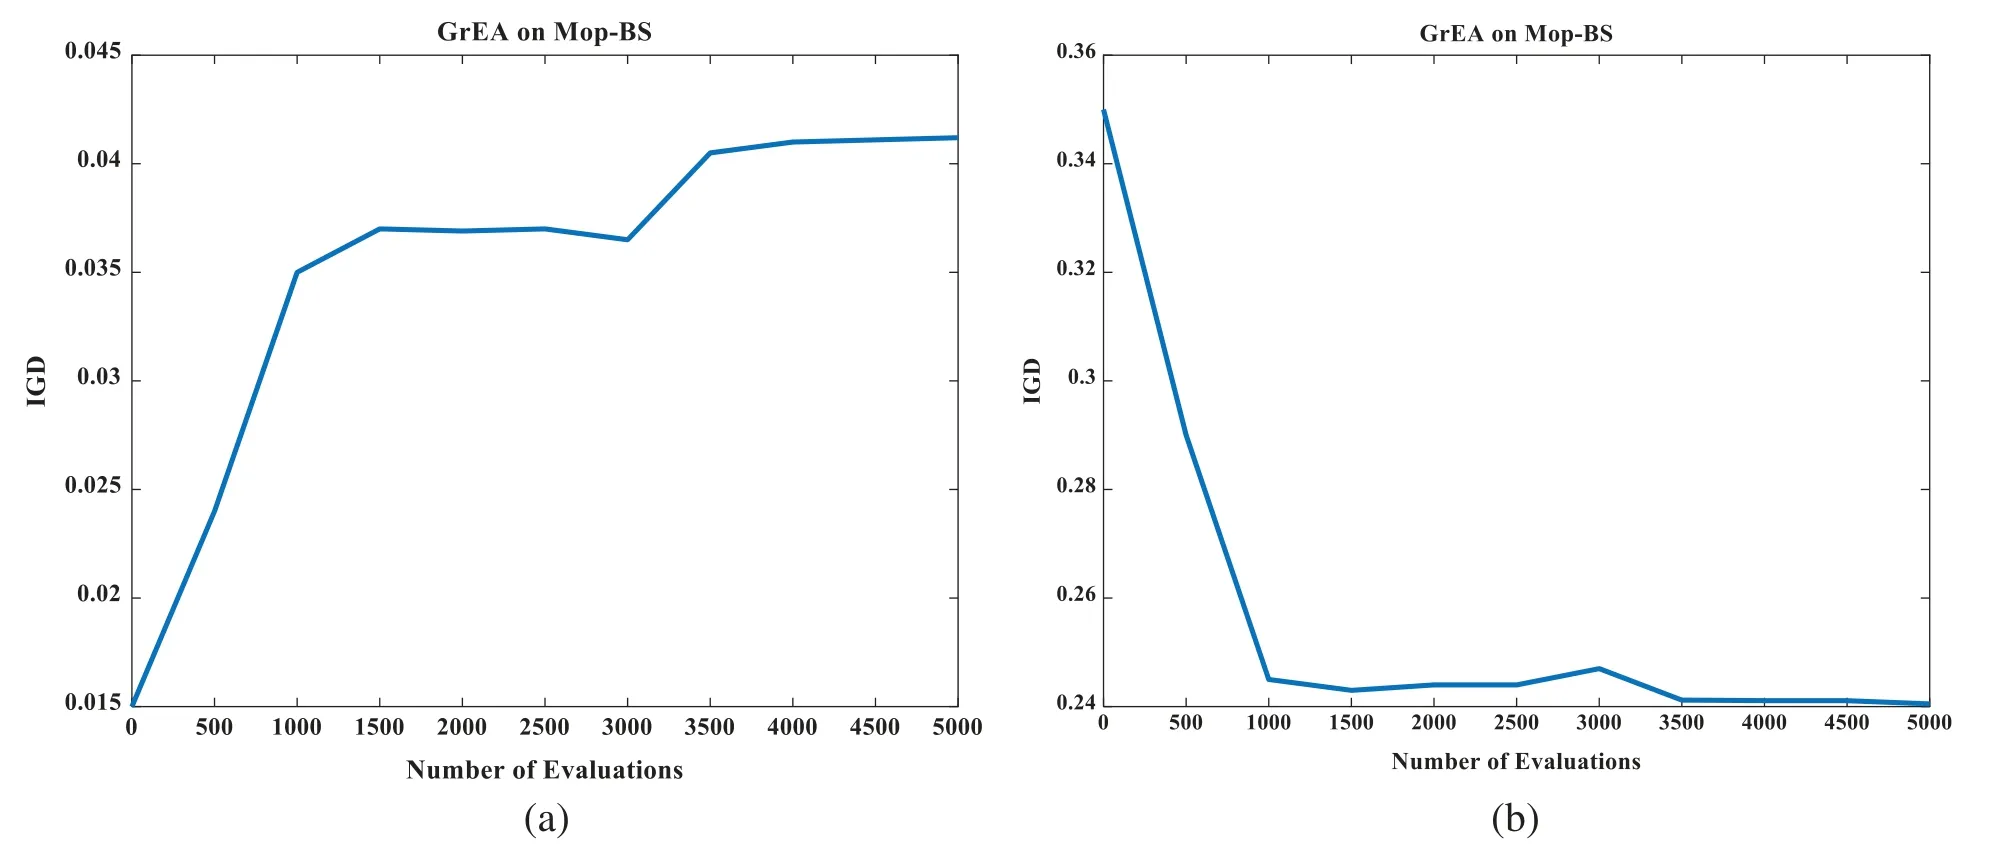
Figure 6:(a)is the IGD value of IN,(b)is the HV value of IN
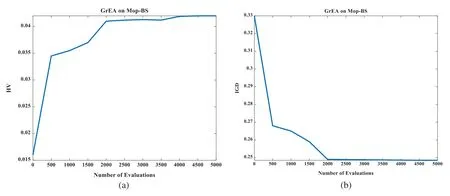
Figure 7:(a)is the IGD value of SA,(b)is the HV value of SA
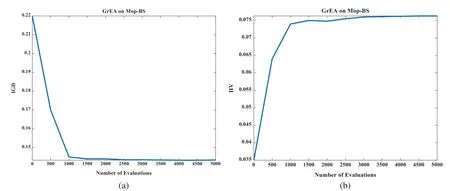
Figure 8:(a)is the IGD value of PU,(b)is the HV value of PU
Then,we randomly select one of the solution sets for the next two stages.The optimal band subsets of the three data sets are given in Table 4.

Table 4:The optimal band subset of three HSI datasets
In Fig.9,the information changes relatively smoothly,which belongs to similar bands.The average value of the difference between the band with the largest amount of information and the band with the smallest amount of information is between 0.6 and 1.
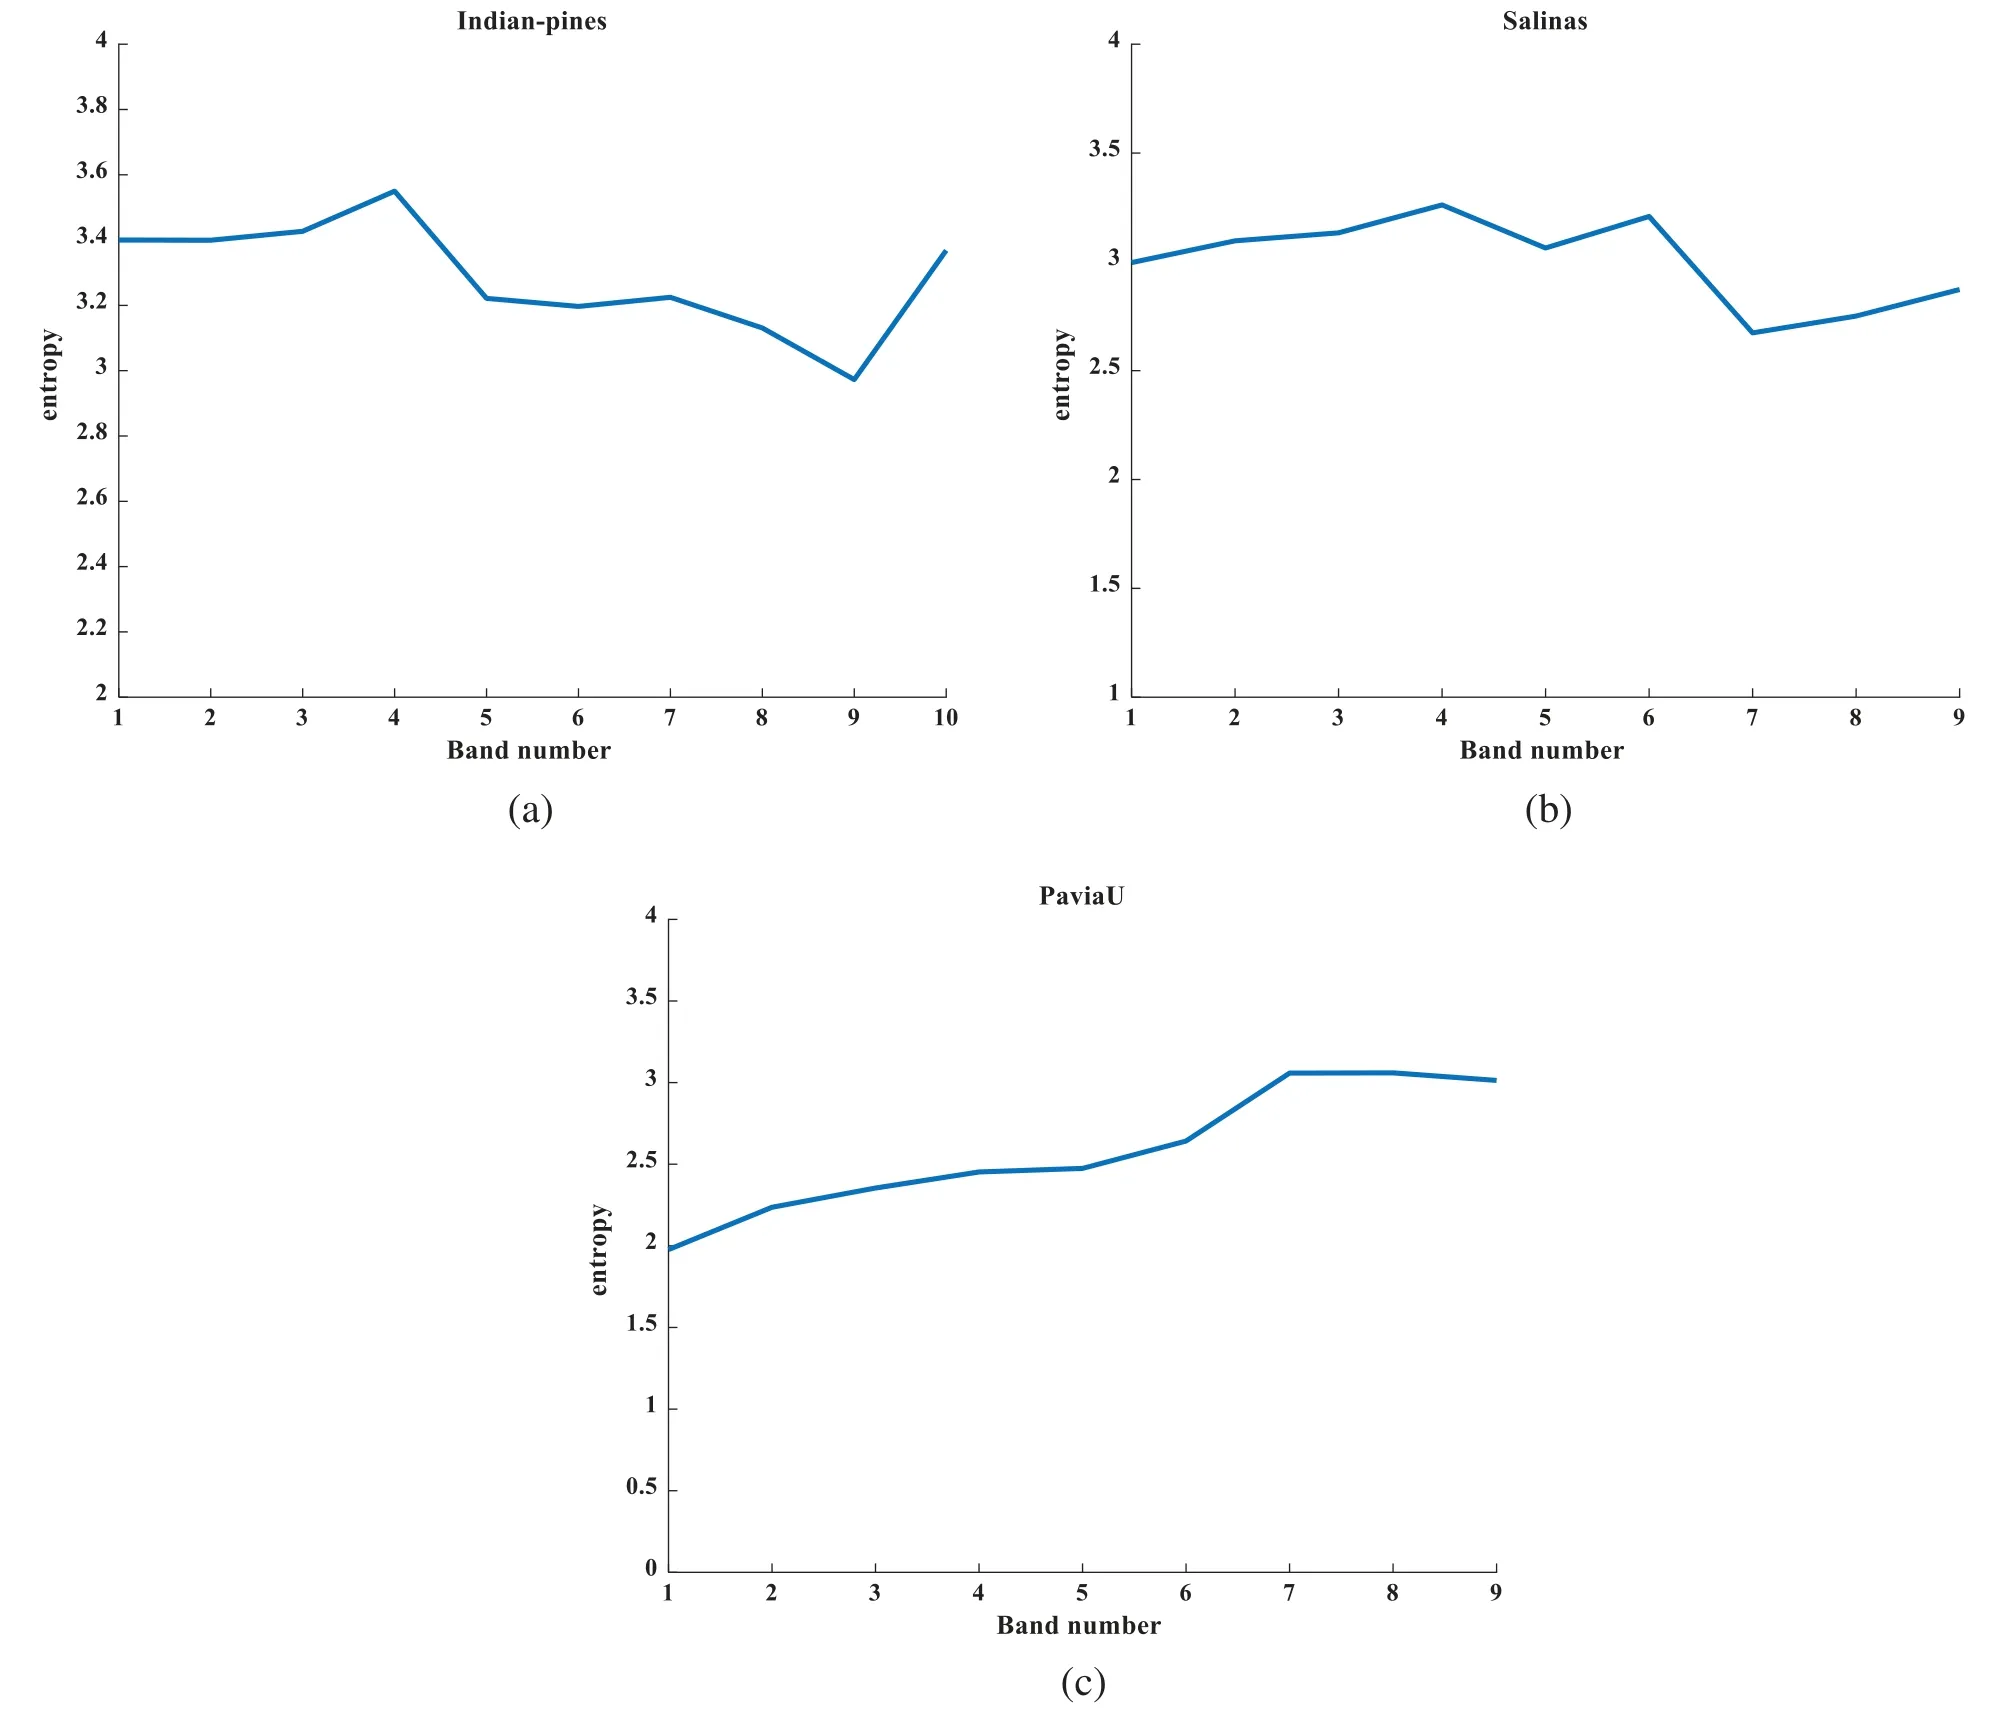
Figure 9:(a)is the information of IN,(b)is the information of SA,(c)is the information of PU
3.2.2 The 2-Stage Experiment
In the second stage, we used the band subset selected in the first stage to perform intra-band reconstruction.On the IN dataset, the optimal band subset includes ten bands, and the 27th and 120th bands were regarded as the key bands,which are sampled as 0.7.On the SA dataset,there are nine bands selected as the optimal band subset,and the 41th and 198th bands are regarded as the key bands, which are sampled as 0.7.On the PU dataset, nine bands were selected as the optimal band subset,and the 21th and 101th bands were regarded as the key bands,which are sampled as 0.7.We will introduce the simulation results on the three data sets below.
In the second phase, the iterations are set to 20.Fig.10 shows the second phase reconstructed image in IN.In Fig.11, taking the band 70 in SR=0.2 as an example, after the ReWSR model is iterated to the 10th time, the model basically converges, and the PSNR is no longer significantly improved.
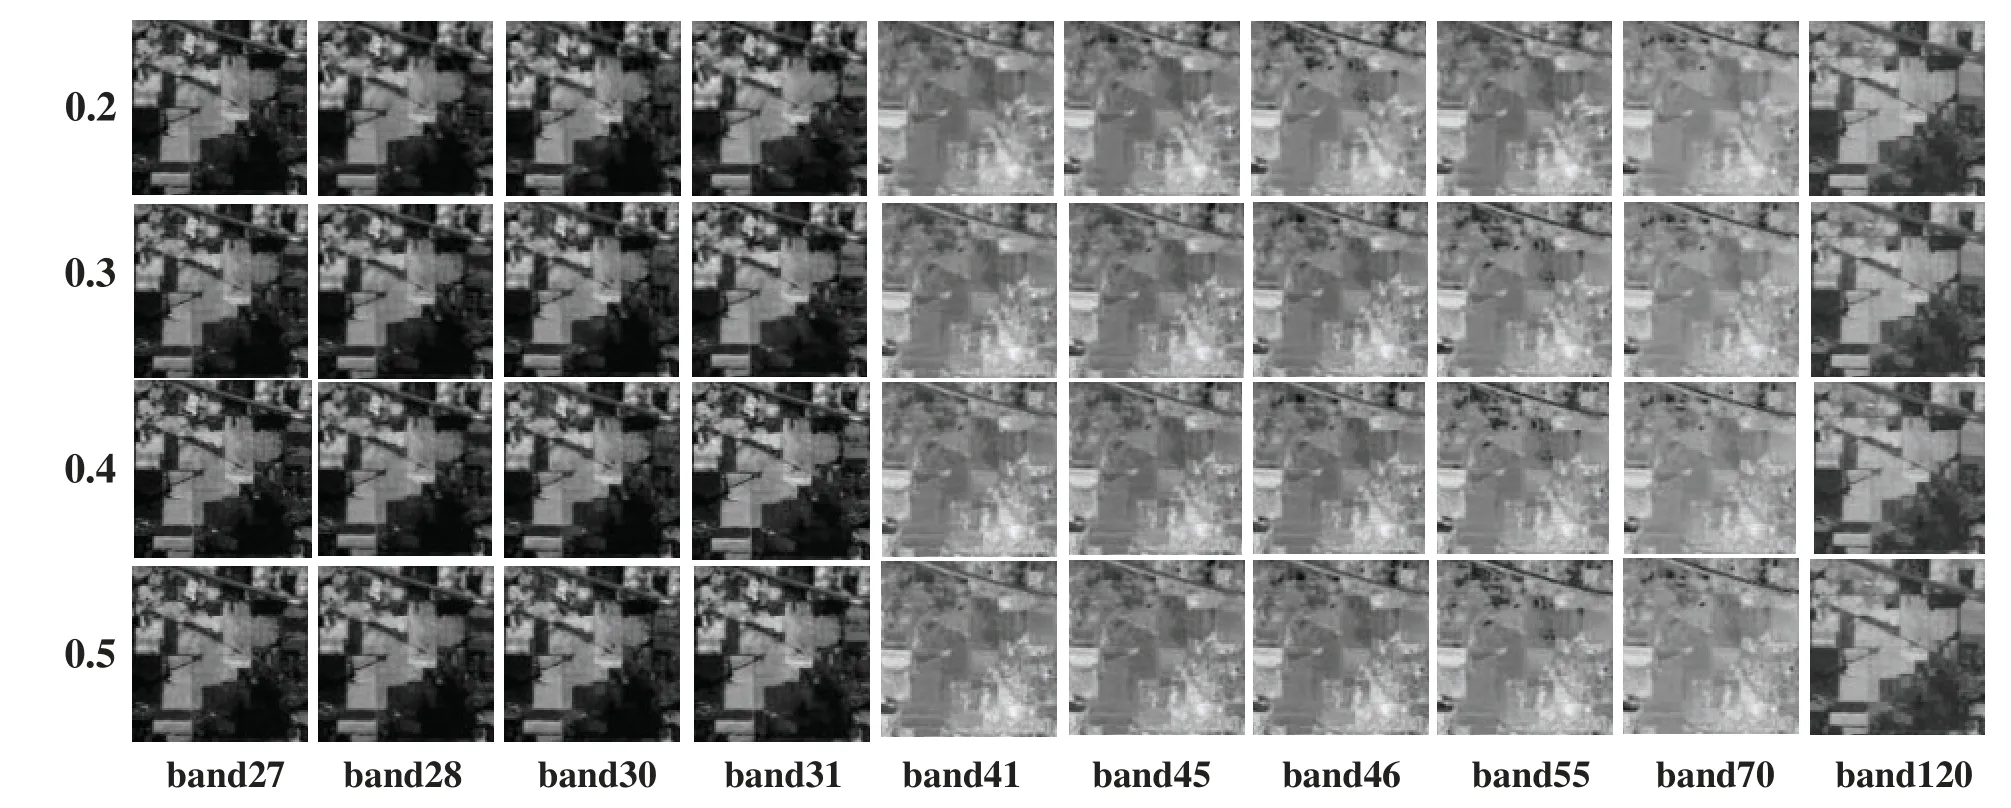
Figure 10:The reconstructed image on SR=0.2 to 0.5 in the first stage on IN
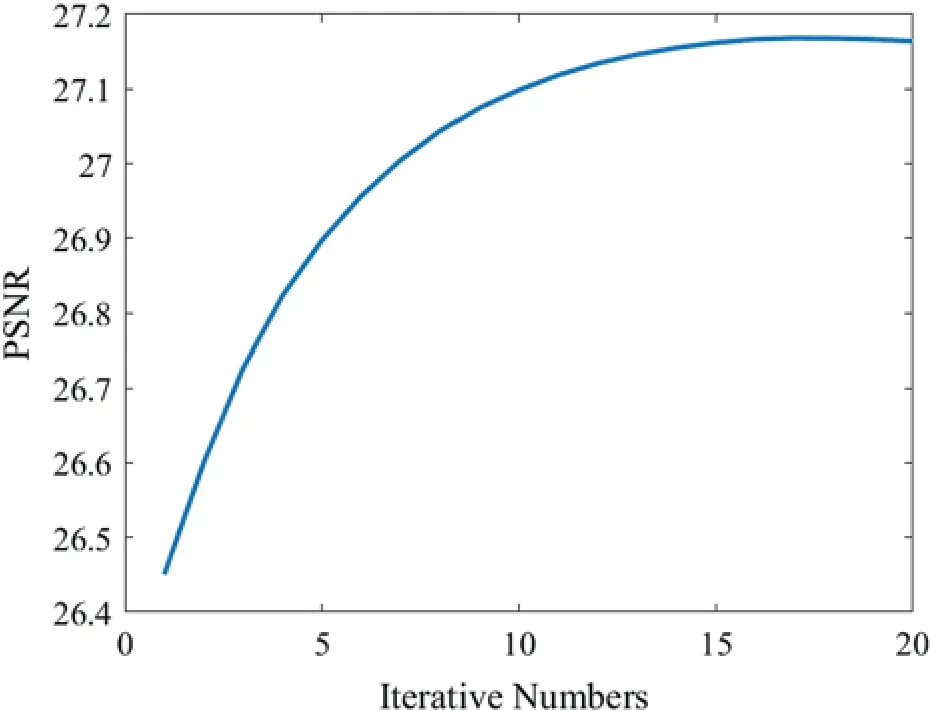
Figure 11:ReWSR model Iterative graph
The SR ranges from 0.2–0.5,and the PSNR of the restored image is shown in Table 5.The PSNR value gradually increases from SR=0.2–0.5.Where the band 27 and the band 120 as the key band,the sampling value is always 0.7.The recovery quality of the 70th band image is the best,from SR=0.2 to 0.5.The average reconstruction accuracy of the seven bands is 31.57 by dividing the two key bands in SR=0.5.The variance of PSNR values for 8 bands is 1.078 in SR=0.5.It shows that the 8 bands are similar,which reflects the importance of the first-stage band selection.
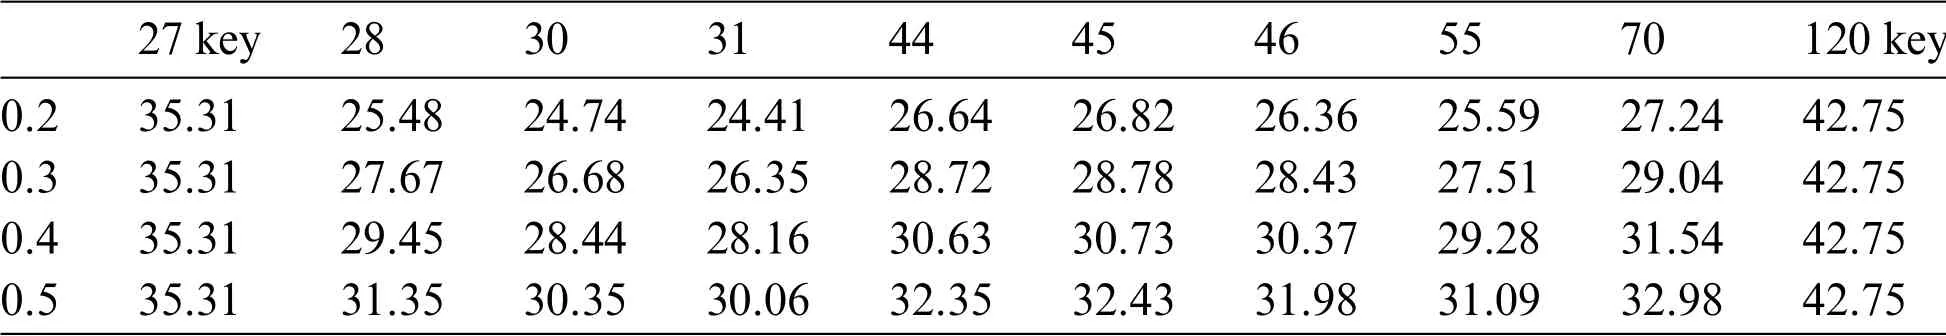
Table 5:The PSNR from SR=0.2–0.5 in the second phase on IN
Fig.12 shows that on the SA data set.It has an SR from 0.2 to 0.5.The band shows images in different spectra,so the form of expression is not the same,such as band 76,117,120.Fig.13 shows the iterative value of band 70 on the ReWSR model.When the number of iterations is 15,the model reaches convergence.

Figure 12:The reconstructed image on SR=0.2 to 0.5 in the first stage on SA
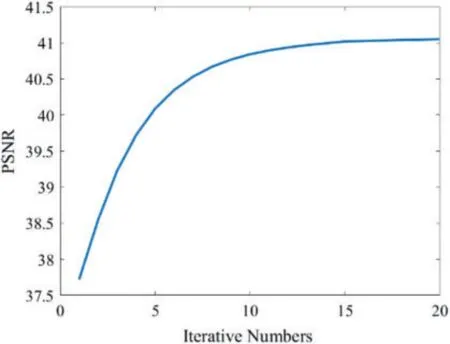
Figure 13:ReWSR model Iterative graph
The SR ranges from 0.2–0.5,and the PSNR of the restored image is shown in Table 6.The PSNR value gradually increases from SR=0.2–0.5.Where band 41 and band 198 are the key bands, the sampling value is always 0.7.The recovery quality of the band 65 image is the best,from SR=0.2 to 0.5.The band with the best recovery effect is band 65 on SA.When the SR is 0.5,the PSNR reaches 41.88.The average reconstruction accuracy of the seven bands is 40.55 by dividing the two key bands in SR=0.5.The variance of PSNR values for 7 bands is 1.9267 in SR=0.5.
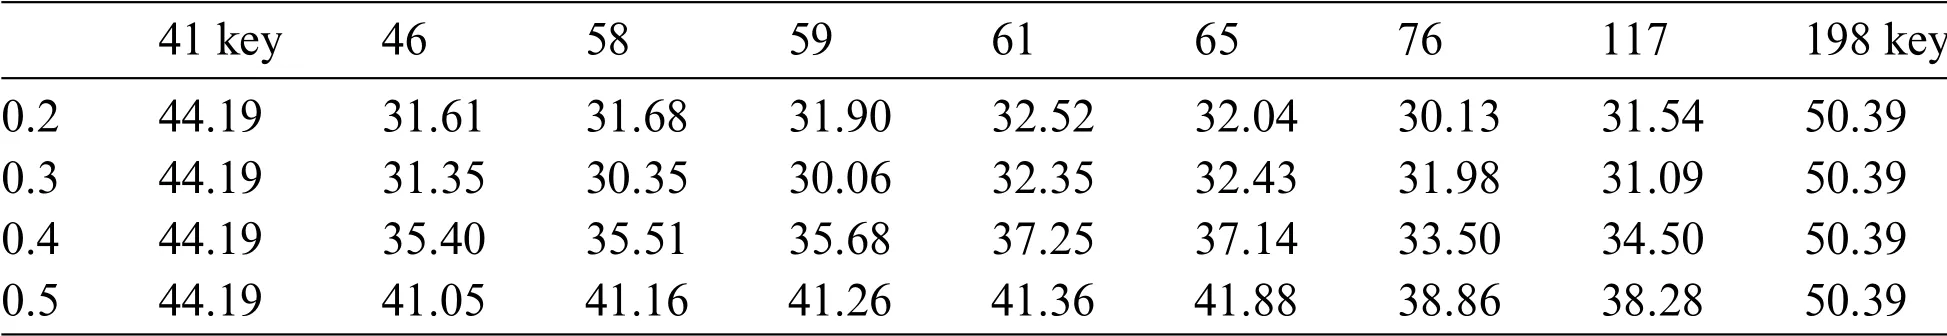
Table 6:The PSNR from SR=0.2–0.5 in the second phase on SA
Fig.14 shows the reconstructed images of 9 bands for the PU dataset with SR from 0.2 to 0.5.Compared with IN and SA,the PU dataset has a larger size and denser pixels,so the reconstruction effect is better when sampling within the band in the first stage.Fig.15 shows the iteration trend of band 61 in the MHP model.When the number of iterations reaches 15,the model accuracy tends to converge.
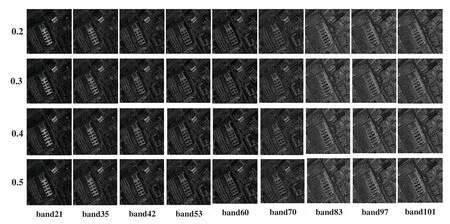
Figure 14:The reconstructed image on SR=0.2 to 0.5 in the first stage on PU
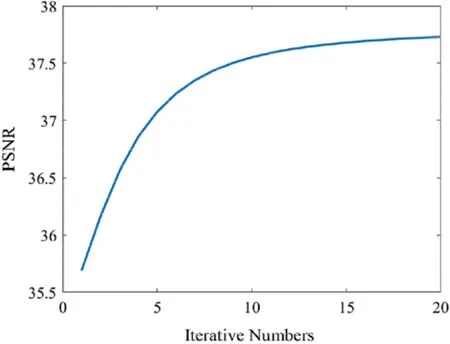
Figure 15:ReWSR model Iterative graph
The SR ranges from 0.2–0.5,and the PSNR of the restored image is shown in Table 7.The PSNR value gradually increases from SR=0.2–0.5.Where band 21 and band 101 are the key bands, the sampling value is always 0.7.The recovery quality of the band 35 image is the best from SR=0.2 to 0.5.The band with the best recovery effect is band 35 on PU.When the SR is 0.5,the PSNR reaches38.39.The average reconstruction accuracy of the seven bands is 37.22 by dividing the two key bands in SR=0.5.The variance of PSNR values for 7 bands is 1.9764 in SR=0.5.
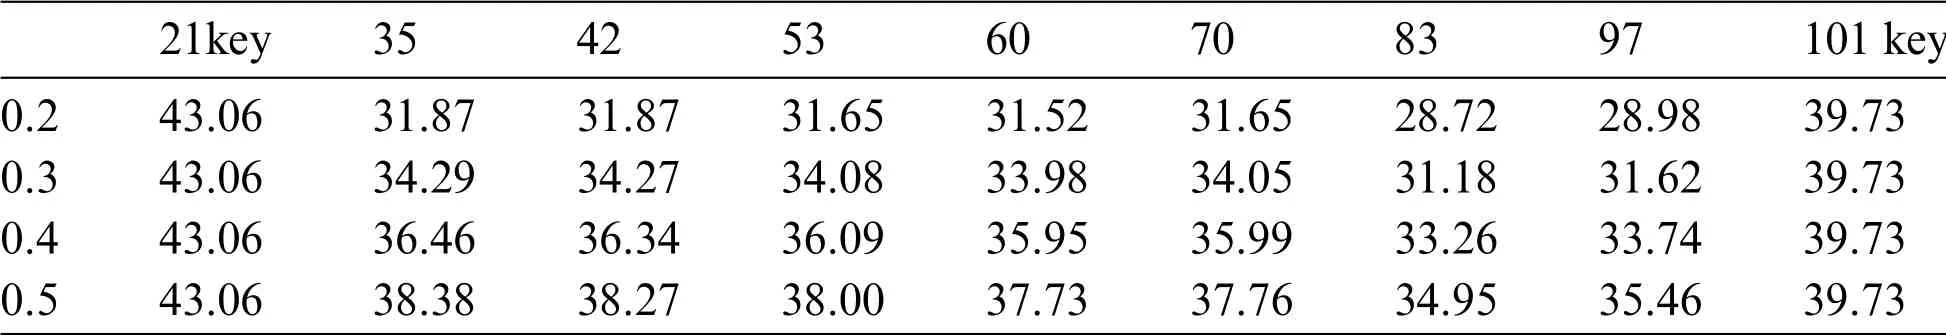
Table 7:The PSNR from SR=0.2–0.5 in the second phase on PU
3.2.3 The 3-Stage Experiment
In the third stage, we use the initial image reconstructed in the second stage.During the reconstruction, firstly, the algorithm searches for images with a higher reconstruction quality than the current band in the initial restored image,and weight coefficients are added to these images.The key band is set to ensure that a band with a higher reconstruction quality than the current band can be searched.
Fig.16 shows the reconstruction values of nine bands when the SR is 0.2–0.5 on IN.There are obvious differences between bands 27 to 31 and bands 41 to 70,but the similarity is great.It is because the images show different forms in different spectra.From the image,after the reconstruction of the three-stage algorithm,IN has obtained a relatively good visualization effect.
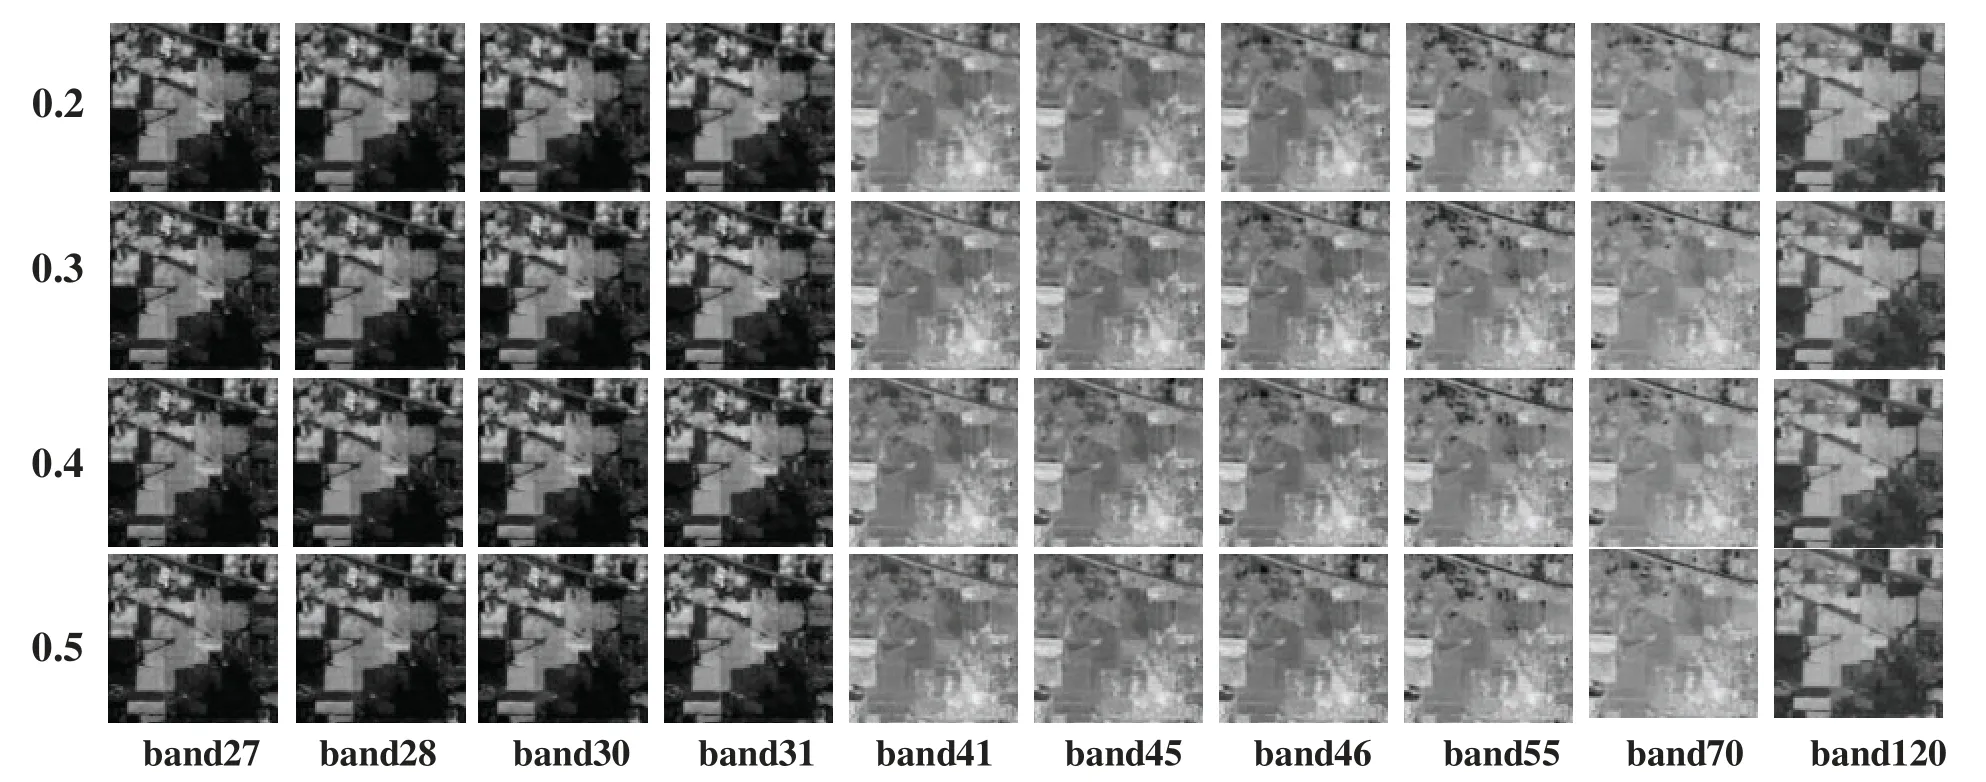
Figure 16:The reconstructed image on SR=0.2 to 0.5 in the second stage on IN
In the third stage, the band with the best reconstruction quality is the 70 band in Table 8 on SR=0.5.When the SR is 0.2,the PSNR increases from 27.24 to 28.18.When the SR is 0.5,the PSNR increased from 32.08 to 34.72.Overall,the sum of PSNR increased by eight bands is 15.9.
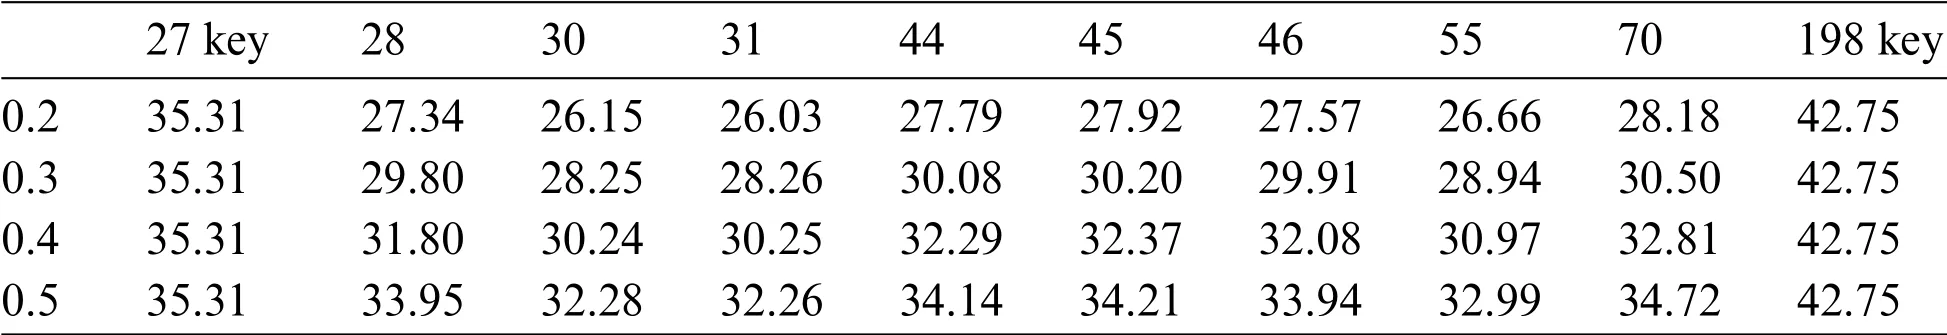
Table 8:The PSNR from SR=0.2–0.5 in the third phase on IN
Fig.17 shows the reconstruction values of 7 bands when the SR is 0.2–0.5 on SA.Similar to the IN dataset,the differences between the bands are due to spectral properties.From the image,after the reconstruction of the three-stage algorithm,SA has obtained a relatively good visualization effect.
Similarly, the band with the best reconstruction quality is the 65 band in Table 9 on SR=0.5.When the SR is 0.2,the PSNR increases from 32.04 to 32.88.When the SR is 0.5,the sum of PSNR increased from 41.88 to 42.68.Overall, the PSNR increased by seven bands is 3.75.The algorithm does not perform well on SA,which is due to the SA dataset size of 83×86.Its dataset size is small,but the algorithm mainly relies on the relevant information to search for the bands.
Fig.18 shows the reconstruction values of 7 bands when the SR is 0.2–0.5 on SA.From the image, PU has obtained a relatively good visualization effect after the reconstruction of the threestage algorithm.
The band with the best reconstruction quality is the 97 band in Table 10 on SR=0.5.When the SR is 0.2,the PSNR increases from 28.98 to 35.35.When the SR is 0.5,the sum of PSNR increased from 35.46 to 41.02.Overall,the PSNR increased by 7 bands is 14.17.
Next,we compared four hyperspectral image compressed sensing algorithms,MT-BCS[49],ITV[50],CCPCA[51]and our work.

Figure 17:The reconstructed image on 0.2 to 0.5 SR in the second stage on SA
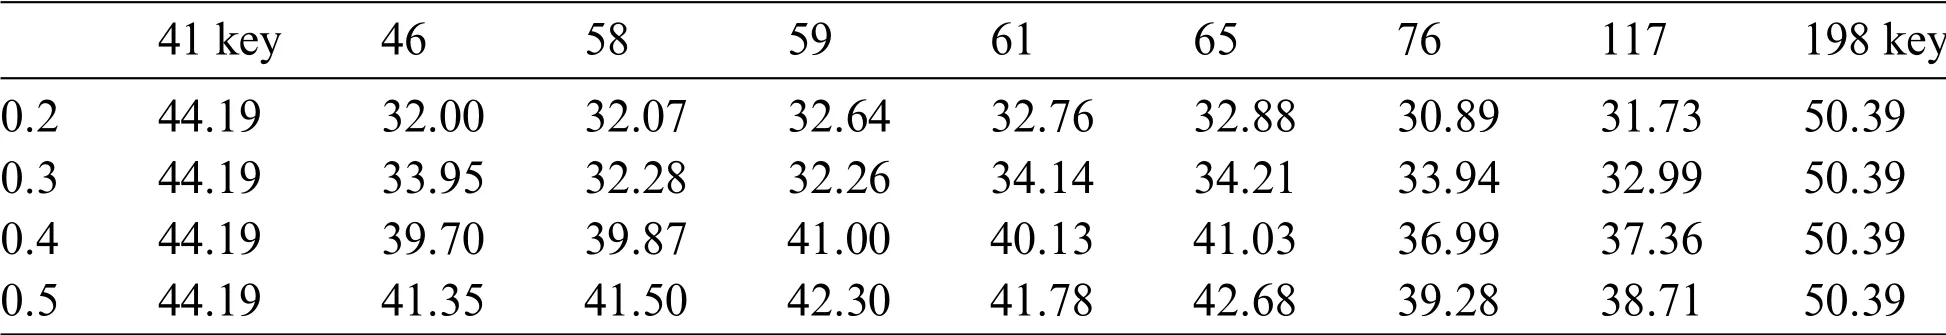
Table 9:The PSNR from SR=0.2–0.5 in the third phase on SA
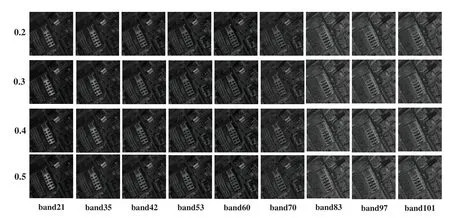
Figure 18:The reconstructed image on 0.2 to 0.5 SR in the second stage on PU
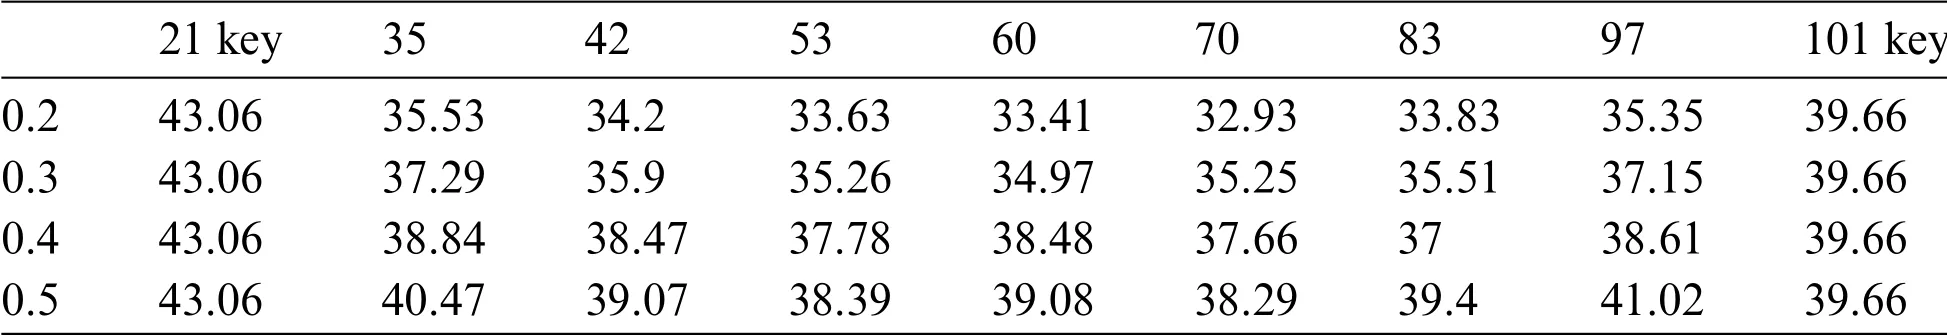
Table 10:The PSNR from SR=0.2–0.5 in the third phase on PU
In Fig.19,when SR=0.2–0.5,the PSNR of the four algorithms shows an increasing trend.The three-stage HSICS algorithm performs better performance on IN dataset and PU dataset.On the SA dataset,when the SR is less than 0.3,the PSNR is slightly inferior.
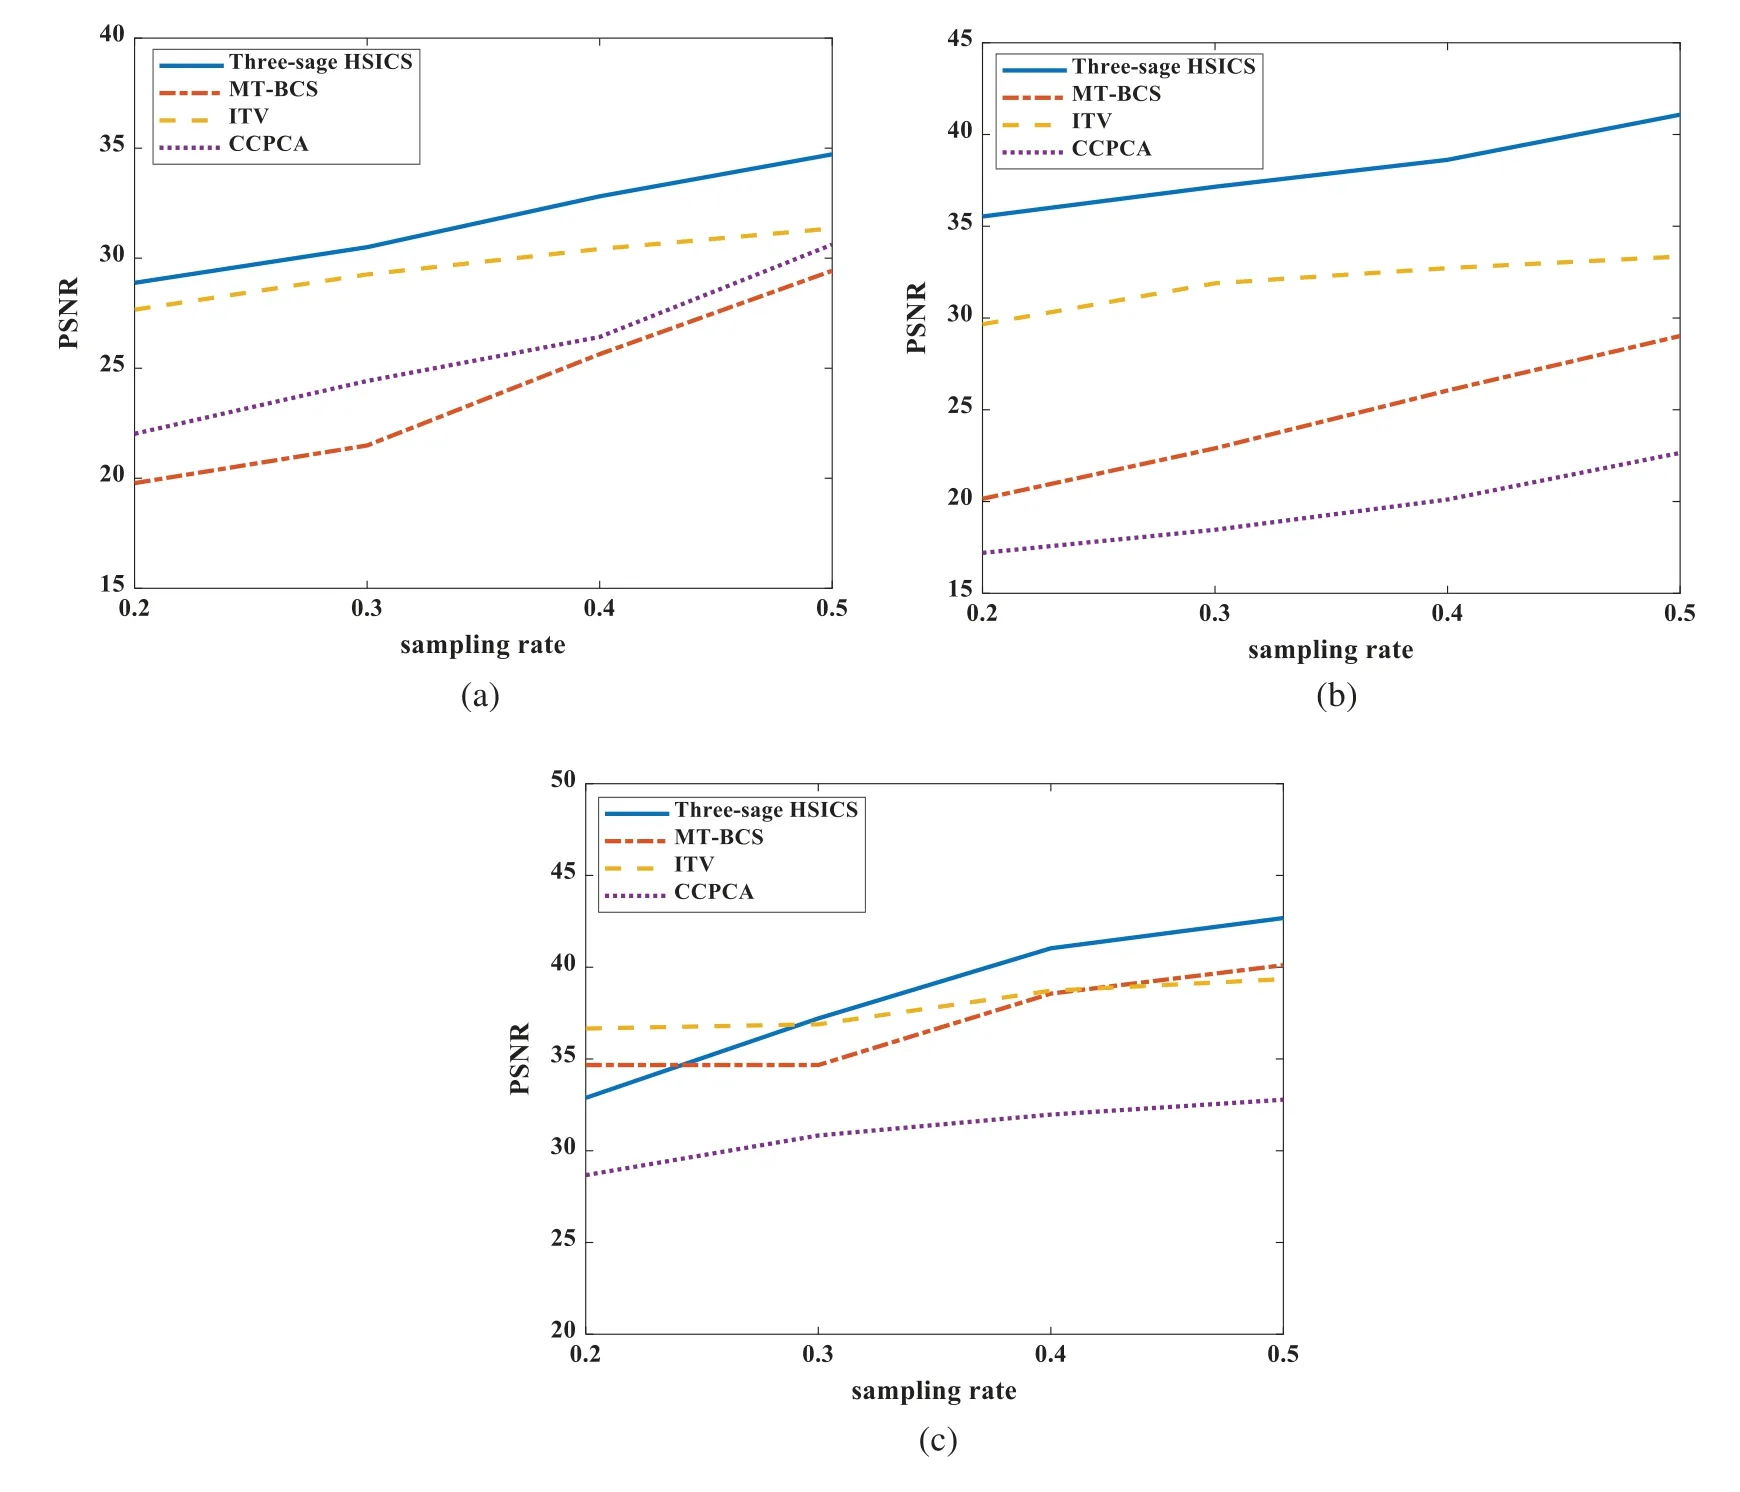
Figure 19:(a)is the algorithms comparison in IN.(b)is the algorithms comparison in SA and(c)is the algorithms comparison in PU
To sum up,taking SR=0.5 as an example,we compare the average improved PSNR from Stage 2 to Stage 3 of the three datasets, where IN is 1.99, SA is 0.54, and PU is 2.16.This also reflects a drawback of our work.When the size of the dataset is small,the information obtained by the algorithm through inter-band and intra-band will be less,which leads to the performance of the MHP model and the ReWSR model,which reduces the accuracy of the final reconstructed image.
4 Conclusion
A three-stage HSICS algorithm is proposed to recover HSI.In the first phase,we suggest an HSI band selection model, which makes the HSI band selection as Mop-BS, and uses advanced inspirealgorithms to solve it.In the second and third phases,this paper improves the MHP model and ReWSR model,optimizes the block indexing method in the BCS of HSI.Through the most similar block,intraband and inter-bands.The similar blocks are modeled with residuals,and the weights are re-iterated.In the HSICS,the algorithm can effectively improve the reconstruction accuracy from experience results.
In the future,we will consider modifying the weights of the ReWSR model and designing more advantageous algorithms to optimize the weights to fit the relationship of band similarity and further improve the performance of HSICS reconstruction.On the other hand,we will consider reducing the time consumption in HSICS,and improving the practicality of the algorithm.
Funding Statement:This work is supported by the National Natural Science Foundation of China under Grant No.61806138;Key R&D program of Shanxi Province(High Technology)under Grant No.201903D121119;Science and Technology Development Foundation of the Central Guiding Local under Grant No.YDZJSX2021A038.
Conflicts of Interest:The authors declare that they have no conflicts of interest to report regarding the present study.
 Computer Modeling In Engineering&Sciences2023年1期
- Computer Modeling In Engineering&Sciences的其它文章
- A Fixed-Point Iterative Method for Discrete Tomography Reconstruction Based on Intelligent Optimization
- A Novel SE-CNN Attention Architecture for sEMG-Based Hand Gesture Recognition
- Analytical Models of Concrete Fatigue:A State-of-the-Art Review
- A Review of the Current Task Offloading Algorithms,Strategies and Approach in Edge Computing Systems
- Machine Learning Techniques for Intrusion Detection Systems in SDN-Recent Advances,Challenges and Future Directions
- Cooperative Angles-Only Relative Navigation Algorithm for Multi-Spacecraft Formation in Close-Range